
ABSTRACT
The concept of “big” data is nothing new to archaeologists; we have long made a profession of collecting, organizing, and analyzing a surfeit of data describing everything from minute artifact attributes to landscape-wide environmental characteristics. Regardless of this abundance, we have and continue to confront the self-same problem inherent in “big” data, namely what analyses will actually help us use these data to advance understandings of past human behaviors. With burgeoning remote sensing technologies archaeology faces a new wave of “big” data, but how do these techniques improve our ability to make the inferential leaps to bridge the present to the past and bring new insights forward? We argue that, to date, remote sensing techniques (satellite, aerial, and unpersonned aerial imagery) have been applied somewhat narrowly to mostly high-resolution site-based research in archaeology. To truly unleash the capabilities of these techniques, and expand our capacity for wrangling “big” data to more fully investigate past patterns, we need to conduct iterative analyses incorporating remotely sensed data on bounded archaeological sites and regions and unbounded landscapes. A case study from the Late Precontact (ca. A.D. 1200–1600) period in the northern Great Lakes of North America detailing how such an iterative approach can be initiated is explored here.
Introduction
Archaeology has long been in the realm of “big” data, a field of study focused on the capture, analysis, information extraction, storage, and privacy of large and complex data sets. Archaeologists recover numerous artifacts during excavation; each artifact has numerous attributes that can be variously described, measured, and quantified. An array of techniques can be applied to analyzing archaeological materials that produce even more data outputs, from geochemical to genomic analyses. There is no shortage of measurements we can make, statistics we can run, or analytic approaches we can adopt to produce a plethora of data on past artifacts and sites. Inherent in all of archaeological data is the perennial ambiguity of whether there is a direct relationship between past human activities and the patterns we identify in our analyses of these data (Cowgill Citation1989, 137).
While archaeology has long been involved in generating, analyzing, and interpreting big data, geospatial methodologies have more recently transformed archaeology—in terms of the questions we ask and the techniques used to investigate them—and ushered in a distinctly expansive wave of “big” data for the field (see Bevan Citation2015; Cooper and Green Citation2016; Hacigüzeller Citation2012; Huggett Citation2015; Kintigh et al. Citation2014; Lock and Pouncett Citation2017; McCoy Citation2017). With constantly expanding varieties and capacities of geospatial collection strategies and analytical methods, we have access to more and better geospatial data. Yet the old question remains: do we gain improved insights into the past from the seemingly ever-expanding geospatial data available to us as archaeologists? How does geospatial data impact archaeological knowledge creation (Huggett Citation2015, 89)? These questions return us to the perpetual problem with all archaeological data: does more data mean we are getting closer to understanding the actual activities in the past we are interested in as archaeologists?
In this paper, we focus on one component of the geospatial data boom in archaeology, remote sensing (satellite, aerial, and unpersonned aerial imagery). Advancements in remote sensing technology and its availability have led to a particularly popular flavor of analysis, what could be called a kind of “massification” of archaeological site detection and high-resolution site-based imaging (VanValkenburgh and Dufton, this volume). Remote sensing technologies are most frequently applied with the aim of increasing the expediency of archaeological site detection over traditional archaeological field-based survey, or for enhancing high-resolution imaging of known sites’ intrasite features and organization. Such work has been, and continues to be, significant for advancing our understanding of the documented archaeological record, especially in understudied regions and/or places where sites are particularly vulnerable to destruction (e.g., Casana and Laugier Citation2017; Franklin and Hammer Citation2018; McLeester et al. Citation2018; Parcak et al. Citation2016). While these applications are undoubtedly significant, as we have argued elsewhere, we feel it is also critical for geospatial applications in archaeology, including remote sensing, to go beyond the site concept—that is, to become unbound from an overreliance on analyses tethered to fixed points in space (Howey and Brouwer Burg Citation2017).
Ecology, another geospatially-engaged discipline, has been at the forefront in calling attention to the ways fixed site-based or “point-to-point” geospatial modeling result in critically incomplete understandings of how ecological processes flow across large areas (Estes et al. Citation2008; Treat et al. Citation2018). Ecological geospatial efforts pushing beyond point-to-point analyses are often called “wall-to-wall” modeling (cf. Pelletier et al. Citation2014; see Amaral et al. Citation2016; Crooks and Sanjayan Citation2006; McRae et al. Citation2008; Shirk et al. Citation2010; Spear and Storfer Citation2010), techniques that by dint of their broader sample area tend to yield more accurate and encompassing explanations of ecological processes (Chambers et al. Citation2007).
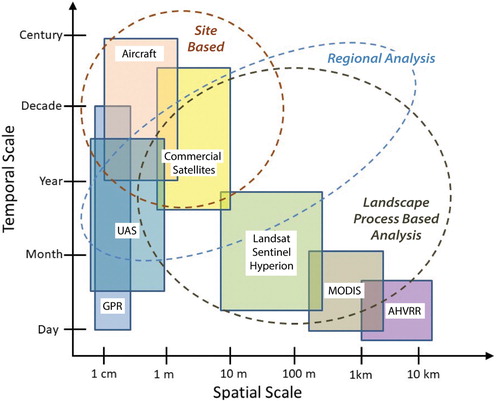
Archaeology has been slower to implement similar wall-to-wall modeling in the form of landscape-scale, culture process-based geospatial analyses, although efforts at such total surface (or wall-to-wall) modeling are emergent (cf. Brouwer Burg Citation2013; Connolly and Lake Citation2006; Gillings Citation2015; Llobera Citation2003, Citation2012; Lock, Kormann, and Pouncett Citation2014; Kohut Citation2018). We suggest this is, in part, a result of the relationship between available and affordable remote sensing technologies, resolution limitations, extent of coverage, and the nature of the connection between remotely sensed data and archaeological sites or features. In , we chart the relationship between an array of remote sensing technologies at three analytic spatial scales: site, region, and landscape. We also include the temporal cycles of each technology’s data collection/availability. Archaeologists have tended to use remote sensing technologies best suited to site-based and regional-scale analysis and explored the technologies on the landscape process-based analysis side of this chart less frequently.
Figure 1. A chart of the relationship between an array of remote sensing technologies and analytic spatial scale as well as temporal cycles of each technology’s data collection/availability. GPR: ground penetrating radar; UAS: unmanned aerial survey; MODIS: moderate resolution imaging spectroradiometer; AVHRR: advanced very high resolution radiometer.
Challenges of Landscape in Remotely Sensed Data
Archaeological applications of remote sensing technologies tend to feel “safer” on the left side of the chart in and this safety decreases as you move right on the bottom axis of spatial scale. By “safe,” we mean where the connection between remotely sensed data and the archaeological record relies on less inference building. Detecting sites is an obvious use of remote sensing data for an archaeological end; exploring the distribution of sites across a region is a bit more attenuated but still a clear use of remote sensing data for an archaeological result. The investment in learning and deploying remote sensing technologies at these scales offers the potential of a clear pay-off for archaeological research programs and so, archaeologists have tended to harness those remote sensing technologies best suited to site-based and regional-scale analysis. This is not that surprising as sites and regions are bounded archaeological units. Regions contain sites and have extents defined typically by physical boundaries such as rivers or mountain chains, but boundaries can also be social, political, or religious.
Landscape, in contrast to site and region, is an unbounded concept that includes the full extent of all area(s) people might move through and interact in (cf. Basso Citation1996; Ingold Citation1993). Both the vastness of landscape and the complexity of ways landscape impacts sociocultural behaviors is widely recognized (such as the way landscape inhabits Apache peoples [see Basso Citation1996]; or the “big rough spaces” of the Labrador Innu-Naskapi or Montagnais [see Lovis and Donahue Citation2016]; or the totemic significance of dreamscapes among the Walbiri of Central Australia [Meggitt Citation1962]). While you can ask of a site or region how much of it there is, you cannot ask that of a landscape, rather, you can ask what it is like (Ingold Citation1993, 154; emphasis added). Remote sensing technologies that cover vast geographic areas are available but these have data output resolutions that do not offer the opportunity for direct detection of archaeological remains. So, as you move further along the spatial resolution spectrum presented in to landscape process-based analyses, archaeological applications become less frequent even as the significance of landscape in the past is well recognized.
Moderate-resolution instruments have been employed much less frequently in archaeology than their high-resolution counterparts (Howey et al. Citation2014; Palace et al. Citation2017). Moderate-resolution instruments have high temporal frequency, with daily or near-daily repeat intervals, but contain less detailed spectral and spatial information about the land surface (Frolking et al. Citation2009; Palace et al. Citation2018). These facts limit their utility for direct detection of archaeological features, bringing us back to that perennial ambiguity of data analysis in archaeology which is also, then, a perennial quest in archaeology—that is, for a direct relationship between data/data patterning and past human activities. Added to this, additional knowledge and/or collaborative research with environmental scientists is necessary to provide interpretive understandings of processes and events at this scale (Palace et al. Citation2017). The net effect is these moderate-resolution data sets have been less frequently deployed in archaeology. Using remote sensing to image known sites, find new sites and understand inter-site relationships across a region are all analyses where the relationship between remote sensing “big” data and archaeology is, or at least feels, more direct. As the resolution of remote sensing instruments decreases, there is an increasingly indirect relationship to archaeological sites/features, more inferential steps in analysis, and the concurrent need for additional, outside knowledge.
Despite the challenges this may pose, we suggest archaeology can productively utilize remotely sensed data to conduct landscape process-based analyses of past landscapes by a) approaching landscape-scale climatic and ecological variables not as absolute equivalents to past conditions but as indices (or bounded spectra of variation that slide over time on the absolute scale) that can be examined for relative patterns that would have been significant in the past (i.e., places with persistently higher annual mean temperatures than surrounding areas would have maintained that quality/condition even if the absolute measure of annual mean temperature differs; of course, such relative patterns cannot be extended into periods in which there is evidence to suggest sufficiently different geomorphological and ecological conditions) and b) focusing on physical factors (landforms, ecological habitats) that remain stable over centuries to millennia, thereby isolating features that likely impacted past activities (rather than landforms or habitats known to change relatively rapidly given widespread landscape change or climate perturbations, for example).
Using moderate-resolution remotely sensed data may not allow for direct identification of new archaeological features but it can be used to relate archaeological, ecological, and climactic data, which can, then, help archaeologists ask an array of important questions. What range of social and ecological possibilities inhered across space that past peoples could have experienced? How did landscape matrix composition relate to past land use, site location, and regional interactions? Landscape-scale remotely sensed data can be harnessed to conduct research that moves from asking how much of a landscape there is to asking what a landscape was like (sensu Ingold Citation1993, as above). Such work can advance new insights into the ways past peoples made decisions and adapted their behaviors in relation to the potentialities their landscapes presented to them.
An Iterative Approach to High-Resolution Site-Based and Landscape Process-Based Analyses
We turn to a case study that explores landscape process-based geospatial modeling using remotely sensed data for archaeological research. We aim to show through our case study, and our own learning and research refinement, the importance of adopting a flexible and iterative approach to different spatial and temporal scales of remote sensing “big” data work in archaeology. That is, while we encourage archaeologists to unbind from the site concept and conduct more regional and landscape-based analyses, this unbinding process does not mean abandonment of site-based analyses. Rather, we suggest that the more archaeology can be creative and thoughtful in combining different remote sensing technologies and analyses together, and the more research can move back and forth across the chart we presented in , the better we will become at developing multivalent, robust, and meaningful insights into the past. High-resolution site-based data and landscape process analyses are not mutually exclusive; rather, they can and should be crossed and combined in ways that are mutually enriching for archaeological research.
Airborne lidar (Light Detection And Ranging) is a remote sensing tool that uses pulses of light to measure the distance to reflecting surfaces (allowing for generation of an elevation map), as well as forest structural attributes (Palace et al. Citation2015). Lidar is one of the more commonly-used tools by archaeologists allowing for high-resolution site-based imaging. Lidar has furthered archaeological research across the world and often in incredible ways, revealing detailed features on the land surface long obscured by forest canopy (Canuto et al. Citation2018; Chase et al. Citation2012; Evans et al. Citation2013; Lasaponara, Coluzzi, and Masini Citation2012; Liebmann et al. Citation2016; McCoy, Asner, and Graves Citation2011). The majority of these efforts have focused on complex, stratified, sedentary societies with substantial archaeological features like buildings, monuments and terraces.
In ongoing research, our team has been focusing on finding novel ways to use lidar to target the identification of microtopographic features made by mobile, relatively low density, egalitarian hunter-gatherer (and low-level horticultural) societies in order to expand understandings that these societies too had the capacity to modify their landscapes to ensure community well-being and survival (Howey et al. Citation2016). More specifically, we are examining the role of physical food storage in these societies. Recognizing that among mobile hunter-gatherer societies food storage was a process that played out across an unbounded landscape, as we explain more below, we chose not to conduct a standard point-by-point feature identification process with lidar. Instead, we developed a total surface analytic approach working with lidar that proved successful but also presented scaling challenges, which have required us to develop an iterative approach to our analyses.
Physical Food Storage Practices of Mobile Hunter-Gatherer Societies
Physical food storage emerges through the dynamics of mobile hunter-gatherer society’s adaptation to the conditions of their environment, particularly when conditions, both natural and cultural, carry increased risk of severe and unpredictable food scarcity (Cunningham Citation2011, 143; Halstead and O'Shea Citation1989, 5; Ingold Citation1993, 171). Diverting social and material resources day-to-day as well as over the course of the annual round to support larger-scale food storage practices restricts the ability of spatially and temporally diffuse mobile societies to pursue other scarcity-mitigation strategies (Halstead and O'Shea Citation1989). This means, if these food storage practices fail, a community’s most basic well-being is threatened. To understand the conditions that lead groups to adopt storage practices even with the associated pressures and social, economic, and ecological ramifications, we need more complete archaeological records of the physical food storage practices of hunter-gatherer and low-level horticulturalist societies across the globe.
Unfortunately, finding these archaeological features can be difficult. When food is stored, a “storer’s intent is to re-access and eat stored food” (Morgan Citation2012, 716). This means the food evidence itself will be gone. Food storage facilities offer another line of evidence to document when mobile societies engage in larger-scale storage practices, but these too can be hard to find. This is because when mobile societies build storage facilities, they place them in locations they will move through, and/or purposefully to, in their annual rounds (Binford Citation1980; Ingold Citation1983; Morgan Citation2012). This means many of their physical food storage features will be spatially dispersed across the landscape, along paths and routes, and will not be near archaeologically dense locales like village sites. In comparison, when sedentary societies build immovable food storage facilities, they generally place them in, or in close proximity to, the settlements where they reside long-term (often including directly within houses) (Barrier Citation2010; DeBoer Citation1988; Hendon Citation2000; Law Citation1999). Artifact density at dispersed storage facilities is likely to be low and so, when they are far from living sites, standard ground reconnaissance methods are likely to miss them. In addition, modern land use and cover can reduce both the preservation and visibility of widely spaced, small, low artifact density archaeological features.
Documenting storage features at settlement sites of sedentary societies can provide an imperfect but robust record of physical food storage practices, but when dealing with mobile hunter-gatherer and low-level horticulturalist societies, food storage features far from settlements must be documented. The construction of physical food storage features, while routine and practical, was still one way past mobile hunter-gatherers shaped the landscapes they inhabited in order to mitigate against episodes of scarcity, ensure survival, and increase social well-being (Howey and Frederick Citation2016). Without more complete records of these features—and of their distribution across past landscapes—archaeologists will continue to overlook the full scope, scale, and extent of food storage practices and associated landscape modifications in these societies.
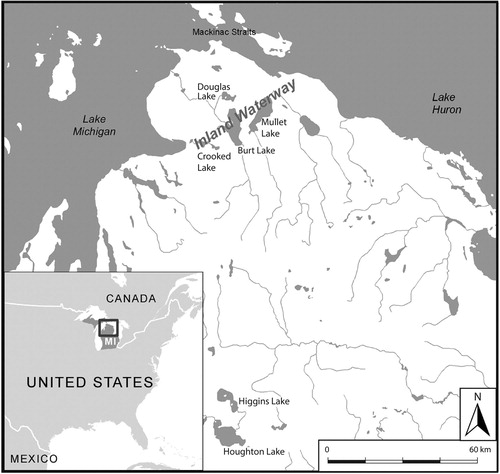
Given that standard archaeological field-based methods carry limitations for finding these storage features, archaeologists have to seek new ways of documenting dispersed food storage features. Remote sensing offers one productive avenue. We recently turned to lidar to advance the study of a region where mobile, relatively low density, hunter-gatherer communities are known to have built dispersed food storage facilities: the Late Precontact period (ca. A.D. 1100/1200–1600) in the northern Great Lakes region of North America ().
Figure 2. Map of the northern Great Lakes with the location of the Inland Waterway project area indicated.
Dispersed Food Storage Features in the Northern Great Lakes Region
While there is evidence for some physical food storage in earlier time periods, the Late Precontact was marked by a notable rise in physical food storage realized through the construction and use of dispersed cache pit clusters (Dunham Citation2000, Citation2009; Holman and Krist Citation2001; Holman and Lovis Citation2008; Howey and Frederick Citation2016; O’Shea Citation2003). Historic Anishinaabeg groups continued to construct cache pits to some degree through the early 1900s. Ethnohistoric accounts indicate that cache pits in active use were subterranean u-shaped features, ranging from 1 to 2 meters wide and deep, lined with birch bark, filled with multiple foodstuffs in containers with grass-type fill in between, and capped with mounded dirt (Densmore Citation1929; Kinietz Citation1947; Tanner Citation1940 [1830]).
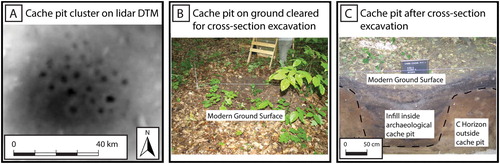
Today in the northern Great Lakes, cache pits survive as microtopographic archaeological features in forested areas subject to less EuroAmerican disturbance. Microtopographic features exhibit “topographic variability on the scale of individual plants [… and] describe soil surface variation within an elevation range from roughly one centimeter to as much as one meter, encompassing both vertical relief and surface roughness” (Moser, Ahn, and Noe Citation2007, 1081). Cache pits are subtle, low-relief circular depressions with diameters ranging from one to two meters and current surface depths between 0.3 to 0.6 meters. Cache pits almost always occur in clusters, typically with 10 to 25 pit depressions although some clusters encompass hundred(s) of pits (Brown Citation1917; Dunham Citation2000; Dustin Citation1966; Greenman Citation1926; Hambacher and Holman Citation1995; Howey Citation2015; Schneider Citation1942; Schumacher Citation1918) ().
Figure 3. Three images of cache pits illustrating (A) how they appear as detected in a lidar derived DTM, (B) when found in field-based survey, and (C) when excavated in cross-section.
Cache Pit Field Research and Airborne Lidar Delineation at Douglas and Burt Lakes
While cache pits are recognized as being a distinct part of the archaeological record of the Late Precontact period, they have not seen extensive archaeological research. To counteract this scenario, we initiated a long-term archaeological field research program on cache pits located in an inland lake landscape in the northern lower peninsula of Michigan, and surrounding Douglas and Burt Lakes. Douglas Lake is located on the northern tip of the lower peninsula, roughly 25 km south of the Mackinac Straits, where Lake Michigan and Lake Huron meet (). Douglas Lake drains into the topographically lower and larger Burt Lake some three kilometers south. Burt Lake is within the Inland Waterway, a series of lakes, rivers, and streams that creates an inland route between Lakes Michigan and Huron, providing an alternate route to the oft-dangerous passage through the Mackinac Straits (Lovis Citation1976, 366) ().
The first systematic archaeological survey carried out in this area was the NSF-funded 1974/1975 Inland Waterway Project, focused on finding prehistoric habitation sites (Lovis Citation1976, Citation1978a,Citationb). No cache pits were found in this foundational survey work, which is not surprising given both the numerous obstacles of finding dispersed storage features of mobile societies in field survey (discussed above) and the microtopographic archaeological signature of Great Lakes cache pits. Cache pits from this inland lake landscape were first documented adjacent to Burt Lake during a University of Michigan Biological Station (UMBS) research program on pre-EuroAmerican landcover (Albert and Minc Citation1987). UMBS preserves 10,000 forested acres along Douglas and Burt Lakes providing a unique opportunity to find relatively undisturbed archaeological sites. Follow-up research on cache pits began in 2007 with the Cultural Landscapes of Douglas Lake (CLOD) field-based archaeological research program stationed out of UMBS.
CLOD’s program prioritized finding more dispersed cache pit clusters, understanding their distribution across the landscape, and contextualizing their significance in past local and regional social, economic, and ideological processes (Howey Citation2015; Howey and Frederick Citation2016; Howey and Parker Citation2008). Conducting a field survey targeted at documenting cache pits came with various challenges, as might be expected given the above discussion. Field-based archaeological surveys in forests can be arduous and time-intensive. Cache pits, being microtopographic features, are easily obscured by leaf litter and groundcover, making it difficult to see them until standing almost right on top of them (). Moreover, cache pits share morphological similarities with “treethrow,” or pit-and-mound topography, a type of natural, non-anthropomorphic microtopography very common in eastern deciduous naturally forested ecosystems (Brubaker et al. Citation2013; Schaetzl and Follmer Citation1990). Two key factors make it possible to distinguish cache pits as anthropogenic microtopographic features distinct from the much more abundant natural treethrows. One factor is the fact that cache pits have a more uniform circular shape and lack the mounding up of treethrow pits; the other factor is that, as discussed above, cache pits almost always occur in regularized clusters. While these factors make it possible to distinguish cache pit topographic features from pit-and-mound ones, it still requires a trained eye to do so reliably in archaeological field survey.
We identified the optimal season to survey for cache pit clusters to be late spring, as snow laying in surface depressions melts slower than on the ground, making cache pits stand out. UMBS Resident Biologist Robert VandeKopple led the UMBS Camp Stewards, a team of volunteer citizen scientists who live in the area, in a springtime survey starting in 2008 (results confirmed during summers between 2008 and 2013). Survey methodology involved walking out from the lakeshore with GPS units in 50 meter transects (standing water/steep gradients excluded). Through this work, 69 clusters of cache pits were found. Pit clusters were defined when no additional pits were found within a 75 meter buffer of the cluster. This buffer distance was based on the existing spatial extent of field surveyed cache pits. Most clusters we found have 10 to 25 pits although one had 60+ pits and another had over 220 pits (see Howey Citation2015; Howey and Frederick Citation2016).
To contextualize these features, we cross-sectioned pits, performed shovel-test survey around pit clusters, and located and excavated occupation sites in the vicinity of pits. The results of this work indicate that cache pit clusters date to the Late Precontact period (ca. A.D. 1100/1200–1600) which is when, as discussed, cache pits are understood to have become used by mobile hunter-gatherer and low-level horticulturalist communities in the northern Great Lakes (Howey and Frederick Citation2016). What is most significant about this research is that if we had not specifically looked for and documented these cache pits they would be overlooked entirely, or erroneously considered an insignificant part of the area’s archaeological record. The fact that physical food storage formed a major aspect of past life is critical to ongoing and future research and greatly informs understandings and interpretations of this period in the Great Lakes.
Unfortunately, the time- and labor-intensive process described above has been slow to produce results, and across only a relatively small area. As a result, large areas around these two lakes and, of course, across the rest of the northern Great Lakes region remain unexamined for these types of storage features. To try to produce a landscape-wide analysis of food storage behavior among mobile societies, and achieve a much deeper understanding of how and why these features were placed in the landscape and used in daily practice, we realized that a different research strategy was required. By integrating the results of this field research program with lidar we found that, indeed, current records of storage features are markedly incomplete and in dire need of improvement.
The State of Michigan recently launched a lidar collection program, Michigan Statewide Authoritative Imagery & LiDAR (MiSAIL). The University of Michigan Biological Station (UMBS) became an early partner with MiSAIL, which enabled acquisition of lidar data to occur within the extent of UMBS property on Douglas and Burt Lake (flown during leaf-off conditions in the spring of 2015). With early access to these data, we saw an opportunity to test the utility of lidar to provide new insight on the presence and distribution of cache pits around these lakes. The lidar output resolution standard for MiSAIL is a one-meter Digital Terrain Model (DTM), which would leave many cache pit microtopographic features unidentifiable. However, we found the resulting lidar data, acquired as an LAS Dataset (the industry standard, binary format for storing airborne lidar data), were in fact suitable for generation of a one-foot (0.305 meter) DTM.
We generated this higher resolution DTM and developed an analytic workflow to delineate candidate cache pit clusters for the entire DTM we had produced. We did not use known cache pits, rather our process examined the entire DTM for candidate cache pits based on physical aspects of cache pit microtopography. The full details of our cache pit delineation workflow are published in PLOS One and we refer the reader to this open access publication for this information (Howey, Palace, and McMichael Citation2016). After the application of our cache pit delineation workflow, we had a total of 543 candidate cache pit clusters. It was at this stage we turned to user-led, knowledge-based interpretation of these candidate locations, examining each one manually. We visually identified 139 of these 543 candidate clusters as having high potential to be anthropogenic cache pit features ( shows the DTM visual appearance of one field-identified cache pit cluster). All of our field-surveyed cache pit clusters were picked up by the lidar delineation routine. We also ground-truthed eight previously unknown candidate cache pit clusters that were found in our lidar workflow and all were verified as cache pits.
Developing a Landscape Cache Pit Detection Program for the Northern Great Lakes
Given we identified several new cache pit clusters in an area that has seen some of the most intensive archaeological field surveys ever done for these features, the possibility of numerous currently unknown cache pit clusters across the rest of the northern Great Lakes region is very high. Conducting archaeological field survey to find these dispersed storage features is time consuming, as our program around Douglas and Burt Lakes has shown, and does not allow examination of the vast geographic swaths necessary to establish a more comprehensive record of microtopographical archaeological cache pit features. Thus, we began an additional program to expand the high-resolution lidar detection workflow established with the early release MiSAIL data of UMBS property around Douglas and Burt Lake to all MiSAIL lidar data currently available in the northern lower peninsula and eastern upper peninsula of Michigan.
The State of Michigan is collecting these data on a county-by-county basis as funding becomes available and they contract with the Sanborn Map Company. Sanborn has been tasked by the State of Michigan in their collection process to deliver high point density returns with Nominal Point Spacing of 0.71 m. Data are collected using a Leica ALS80 sensor flown onboard an aircraft at an altitude of approximately 1200 meters with a maximum scan angle of 32 degrees. Lidar acquisition is in compliance with Quality Level 2 of the United States Geologic Survey (USGS) National Geospatial Program (NGP) Base LiDAR Specifications. While the Digital Terrain Model (DTM) output standard for this MiSAIL data is one meter these collection standards have produced data suitable for much higher resolution DTMs, as our pilot work has shown (Howey, Palace, and McMichael Citation2016).
Having developed a successful workflow to identify cache pit clusters, we selected Emmet County, adjacent to Cheboygan County (where Douglas and Burt Lakes are located), to begin scaling our cache pit cluster detection state-wide. While the area of our pilot study was approximately 120 square kilometers, Emmet County has a total area 2,284 square kilometers. Needless to say, the computation of DTMs for an entire county is much more demanding. Traditionally, lidar data is delivered to end-users as tiled point clouds. In this case, Emmet County is composed of 224 tiles of approximately 16.2 square kilometers. Generating a single DTM with natural neighbor interpolation at a spatial resolution of one foot for a 16.2 square kilometer tile with approximately 1.6 million ground returns using our Python (v 2.7) script and machine takes approximately two weeks. With multiprocessing techniques, we were able to calculate eight DTMs at a time utilizing eight cores of a multi-use system. Even at this rate, generating DTMs for the county would have taken us on the order of one year to complete. With a goal of processing an entire state worth of lidar data within the time constraint of a two-year project, we encountered a computational reality of remotely sensed “big” data. Our system was not sufficient to deal with all of the data, and reducing our area of interest was imperative to prevent the research program from gridlock. We evaluated pursuing the use of more processors or cloud computing, but given the temporal and budgetary limitations of our grant, we pursued a novel and nuanced approach.
Our original aim was to take a high-resolution imaging approach and do it at a landscape scale within appropriate time constraints. While our aim was to stay on that safe side of and create a landscape-scale detection workflow using high-resolution imaging detection of cache pits, this proved a computationally unrealistic goal. Faced with this reality, we decided to cross over from the more comfortable, but proving to us computationally unfeasible, side of the chart in and harness the power of coarser resolution, more indirect landscape-process geospatial modeling. While various landscape-process geospatial modeling approaches are available, Maximum Entropy modeling was chosen as a particularly powerful technique for working with presence-only data, characteristic of the cache pit data set we have established around Douglas and Burt Lakes (Howey, Palace, and McMichael Citation2016; McMichael et al. Citation2014a; McMichael et al. Citation2014b).
Maximum Entropy Modeling of Cache Pit Suitability
The principle of maximum entropy (or MaxEnt) originates in statistical mechanics but its application has been expanded to many disciplines (Phillips, Anderson, and Schapire Citation2006). MaxEnt has been especially developed as a species distribution modeling approach in ecology used for predicting habitat suitability of plant and animal species from presence-only records (Amaral et al. Citation2016; Algeo et al. Citation2017). MaxEnt allows for any number of continuous or discrete spatio-environmental factors to be used as predictor variables for the species of interest. Predictor variable values are extracted from occurrence locations and randomly located background points across the sampling area to develop a statistical model that extrapolates a species habitat probability map across the landscape (McMichael et al. Citation2014a; McMichael et al. Citation2014b).
We constructed a maximum entropy model of Late Precontact (ca. A.D. 1200–1600) subterranean food storage (cache pit) distribution across northern Michigan to understand what landscape processes influenced cache pit geographical placement (). We used all cache pits found around the Inland Waterway in Northern Michigan from our ground survey and lidar work. We incorporated 12 spatio-environmental variables derived from remotely sensed data (). These variables were processed and organized using Google Earth Engine, QGIS, and ArcGIS in order to develop a geospatial database where raster layers would have the same projection, pixel resolution, and domain edges. In selecting input variables, we focused on those with landscape stability in order to strengthen the inferential bridge to the Late Precontact period. We eliminated variables that showed non-normal distributions based on our known cache pit sample to reduce inclusion of atypical patterning in our scaled-up model of cache pit suitability across northern Michigan.
Figure 4. MaxEnt cache pit probability output model. Higher probability areas in yellow and lower probability areas in purple.
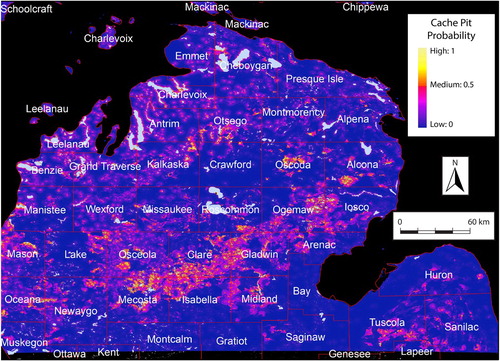
Table 1. Input spatio-environmental variables and MaxEnt permutation importance outputs.
To quantify and compare the relative importance of input spatio-environmental variables to cache pit landscape suitability, we: computed a table of variable overall contribution to MaxEnt model fit, ran jackknife tests for the training and testing datasets, and created individual variable response curves. We also ran 50 permutations of the model using a replicate cross validation, in essence withholding some of the pit locations and running the model using the withheld locations as a validation exercise. Each model was run using 500 maximum iterations. We also performed a jackknife routine to measure each variables’ importance or contribution to the model and how the variable performed by itself. What that means is each variable was excluded in turn, and a model was created with the remaining variables. Then, a model was created using each variable in isolation. Using these jackknife tests, we identified which input variable produced the largest gain value when it was excluded and which one produced the largest gain value when it was used as a single predictor. This allowed us to see the importance of each individual variable for model predictive abilities.
Our overall output model for cache pit probability is shown in . Overall model fit was strong; our MaxEnt model had an average test area under the curve (AUC) for the replicate runs of 0.910 and the standard deviation of 0.080. The results help us understand which spatio-environmental variables factored most heavily into cache pit landscape suitability. We found that land cover ca. 1800 A.D. (an historic-modeled land cover data layer) and distance to inland lake were the most important factors in cache pit placement (). shows the geospatial input of these two variables into the model.
Figure 5. Geospatial inputs of the two variables that emerged as most significant in the MaxEnt modeling of cache pit probability, respectively, (A) Distance to Inland Lake and (B) Dominant Landcover Classes ca. 1800.
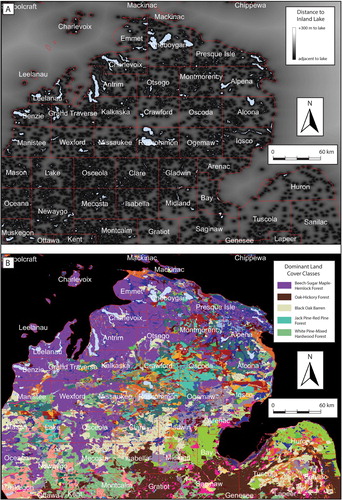
Our working MaxEnt model for cache pit probability has allowed us to start identifying key driving ecological processes behind cache pit geographical location during the Late Precontact in the northern Great Lakes. While this is significant in its own right, we are also able to now apply the results of this landscape process-based modeling iteratively and enhance our lidar high-resolution cache pit feature detection routine. Now, rather than geospatially processing entire counties, we are focusing on processing lidar data for smaller areas of interest determined by the MaxEnt model to have highest cache pit suitability (yellow in ). Clusters identified will be ground-verified and added to our growing cache pit database. Periodically, we will re-run our MaxEnt modeling with the additional input of these new, known cache pit locations. In this way, we are iteratively refining both our landscape process-based analysis and cultural feature detection.
Conclusion
Our case study helps illustrate that to harness the full power of remote sensing “big” data in archaeology we must be willing to be flexible with research design, to move between high-resolution and moderate-resolution data in order to examine bounded sites and regions as well as unbounded landscapes, and to conduct iterative analyses. We began our project, having had success in our pilot research, with the intent of using high-resolution lidar imaging to identify actual archaeological cache pit features directly with remotely sensed data across all of northern Michigan. We soon had to let go of that original idea when the remotely sensed “big” data led us to “big computational time.” We faced a dilemma. We could, with time and budget available to us, produce high-resolution imaging and conduct our lidar cache pit delineation workflow for one county in northern Michigan, or we could develop a new research approach. Working in only one county felt like a narrow outcome for what started as an ambitious project aimed at producing an appreciation of past storage pit placement across a large area. So, we pivoted toward landscape process-based modeling. While dependent on moderate-resolution data and thus more indirect in terms of archaeological interpretations, this has allowed our research to move forward in unplanned yet fruitful ways.
In crossing from the safe side of to the less direct, coarser-resolution side, we gained not only a novel yet feasible way to advance our high-resolution lidar imaging, but also new appreciations of the dynamic mix of ecological factors at play in cache pit suitability across the region. Our maximum entropy modeling has allowed us to identify landscape matrix variables critical to hunter-gatherers’ decisions around food storage during the Late Precontact that we had not previously considered. While we had understood inland lakes as important to cache pit placement, our maximum entropy modeling emphasized it is even more a factor than we previously appreciated, with areas without inland lakes having almost no probability of cache pits. We had not considered landcover ca. 1800 before this modeling and now we are interested in exploring further how land cover interfaced with the way groups made decisions about when and how to harvest, process and store food for their well-being. Were people placing cache pits in forest compositions with storable resources, like oak trees, or were there technical considerations at play, for instance in what kind of forests are easier to dig through to make subterranean pits. We turned to this landscape process-based modeling to help develop an efficient approach to finding more cache pit sites. We were asking the Late Precontact landscape how much of it there was; how many cache pit sites were there? With our broader approach, we have been able to expand beyond a focus on bounded sites and ask rather of this landscape, what it was like. What potentialities inhered in the landscape for food storage and how did Late Precontact hunter-gatherer-fishers engage in a dialectical relationship with the landscape to ensure well-being?
Taking a more flexible and iterative approach to remotely sensed big data is critical for archaeological applications. Archaeology must venture beyond the safe side of , that comfort zone of high-resolution, site-based analyses and unlock landscape process-based analytic potentials. This is especially critical given future satellite plans of organizations like NASA, which are largely landscape-scale instruments, and the flood of “big” data these new technologies will produce. If archaeology does not find creative ways to harness moderate-resolution data to answer archaeological research questions of enduring significance, we will be missing a major aspect of the global geospatial revolution. Though we may study the past, our techniques should not be relegated to the past. Instead, the future of studying the past is in following the lead of sister fields like ecology and earth sciences to meaningfully grapple with and pioneer novel applications of burgeoning remote sensing methods.
Acknowledgments
We are grateful to the many people who have helped with this research, with especially deep gratitude to Bob Vande Kopple, Kathryn Parker, and Kate Frederick for their instrumental involvement in years of archaeological fieldwork on cache pits. The University of Michigan Biological Station provided critical support and access to data and sites. We thank Parker VanValkenburgh and J. Andrew Dufton for inviting us to participate in this special issue. The material presented here is based upon work supported by the National Science Foundation under Grant No.1659000.
Disclosure Statement
No potential conflict of interest was reported by the author(s).
Notes on Contributors
Meghan C. L. Howey (Ph.D. 2006, University of Michigan) is professor and chair of Anthropology and is jointly appointed in the Earth Systems Research Center, Institute for at the Institution for the Study of Earth, Oceans at the University of New Hampshire. She is an anthropological archaeologist specializing in landscape archaeology, geospatial analysis, and interdisciplinary approaches to deep-time coupled human natural systems. As the current James H. Hayes and Claire Short Hayes Professor of the Humanities, Dr. Howey is heading a project entitled “A Deep Time, Multi-Archive Narrative of the Anthropocene in the Great Bay.” In this capacity, she is the Director of the Great Bay Archaeological Survey (GBAS), a community-engaged and interdisciplinary archaeology program working to find and excavate seventeenth century early colonial sites in the Great Bay Estuary, the largest estuary in the Gulf of Maine, northwest Atlantic Ocean.
Franklin B. Sullivan (M.S. 2011, University of New Hampshire) is a research scientist at the Earth Systems Research Center, Institute for the Study of Earth, Oceans, and Space at the University of New Hampshire. His work is in near-Earth remote sensing and spatial data analysis of terrestrial ecosystems using lidar and hyperspectral imaging, with an emphasis on forest structure, and more recently terrain mapping. He is a key member of the Satellite, Airborne, and Drone Lab at UNH and is involved in deploying UASs at multiple field study sites around the globe.
Marieka Brouwer Burg (Ph.D. 2011, Michigan State University) is an assistant professor in the Department of Anthropology at the University of Vermont and an affiliate research faculty at the University of New Hampshire. Dr. Brouwer Burg has conducted research in the Netherlands, Belize, New Mexico, and New Hampshire. She is interested in the effects of landscape evolution and climate change on human communities, as well as reconstructing decision processes and perceptions of landscape in the past. She uses GIS-based archaeological computational modeling to explore these processes in both Old and New World contexts, interweaving indigenous accounts and ontologies through ethnohistoric documents and collaborative techniques. Some of her current research focuses on investigating the spatiotemporal dimensions of ancient Maya land use, mobility and socioeconomic interactions in the central Belize River Valley, Belize.
Michael W. Palace (Ph.D. 2006, University of New Hampshire) is associate professor in Earth Sciences and the Earth Systems Research Center, Institute for at the Institution for the Study of Earth, Oceans at the University of New Hampshire. He is an earth scientist focusing on the terrestrial carbon cycle, vegetation dynamics, landscape ecology, and snow characterization using field measurements, remote sensing, and geospatial science. His research ranges from field studies of vegetation structure to the use of satellite imagery in an effort to predict disease, understand forest dynamics, and find and interpret past human settlement patterns. He has been a Principal Investigator on many major remote sensing projects, with research funding from NASA, NSF, USAID, USDA, USGS, and DOD. He leads the Satellite, Airborne, and Drone Lab at UNH, which is currently deploying UASs at five different field research projects around the globe.
References
- Albert, D. A., and L. Minc. 1987. “The Natural Ecology and Cultural History of the Colonial Point Red Oak Stands.” Technical report No. 14. Douglas Lake, Michigan. 80 p. (on file at UMBS).
- Algeo, T. P., D. Slate, R. M. Caron, T. Atwood, S. Recuenco, M. Ducey, R. B. Chipman, and M. Palace. 2017. “Modeling Raccoon (Procyon lotor) Habitat Connectivity to Identify Potential Corridors for Rabies Spread.” Tropical Medicine and Infectious Disease 2 (3): 44.
- Amaral, K. E., M. Palace, K. O’Brien, L. Fenderson, and A. I. Kovach. 2016. “Anthropogenic Habitats Facilitate Dispersal of an Early Successional Obligate: Implications for Restoration of an Endangered Ecosystem.” PLoS ONE 11 (3): e0148842. https://doi.org/10.1371/journal.pone.0148842.
- Basso, K. 1996. Wisdom Sits in Places: Landscape and Language among the Western Apache. Albuquerque, NM: University of New Mexico Press.
- Barrier, C. 2010. “Storage and Relative Surplus at the Mississippian Site of Moundville.” Journal of Anthropological Archaeology 30: 206–219.
- Bevan, A. 2015. “The Data Deluge.” Antiquity 89 (348): 1473–1484. doi:10.15184/aqy.2015.102.
- Binford, L. R. 1980. “Willow Smoke and Dogs’ Tails: Hunter-Gatherer Settlement Systems and Archaeological Site Formation.” American Antiquity 45 (1): 4–20.
- Brouwer Burg, M. 2013. “Reconstructing “Total” Paleo-Landscapes for Archaeological Investigation: An Example from the Central Netherlands.” Journal of Archaeological Science 40: 2308–2320.
- Brown, C. E. 1917. “Antiquities of Green Lake.” Wisconsin Archeologist 16 (1): 1–55.
- Brubaker, K. M., W. L. Myers, P. J. Drohan, D. A. Miller, and E. W. Boyer. 2013. “The Use of LiDAR Terrain Data in Characterizing Surface Roughness and Microtopography.” Applied Environmental Soil Science Vol. 2013, Article ID 891534. http://doi.org/10.1155/2013/891534.
- Canuto, M. A., F. Estrada-Belli, T. G. Garrison, S. D. Houston, M. Jane Acuña, M. Kovác, D. Marken, et al. 2018. “Ancient Lowland Maya Complexity as Revealed by Airborne Laser Scanning of Northern Guatemala.” Science 361: 6409. DOI: 10.1126/science.aau0137.
- Casana, J., and E. J. Laugier. 2017. “Satellite Imagery-Based Monitoring of Archaeological Site Damage in the Syrian Civil War.” PLoS ONE 12 (11): e0188589. https://doi.org/10.1371/journal.pone.0188589.
- Chambers, J. Q., G. P. Asner, D. C. Morton, L. O. Anderson, S. S. Saatchi, F. D. B. Espírito-Santo, M. Palace, and C. Souza Jr. 2007. “Regional Ecosystem Structure and Function: Ecological Insights from Remote Sensing of Tropical Forests.” Trends in Ecology & Evolution 22 (8): 414–423. https://doi.org/10.1016/j.tree.2007.05.001.
- Chase, A. F., D. Z. Chase, C. T. Fisher, S. J. Leisz, and J. F. Weishampel. 2012. “Geospatial Revolution and Remote Sensing LiDAR in Mesoamerican Archaeology.” Proc Natl Acad Sci U S A 109 (32): 12916–12921. DOI: 10.1073/pnas.1205198109.
- Connolly, J., and M. Lake. 2006. Geographical Information Systems in Archaeology. Cambridge: Cambridge University Press.
- Cooper, A., and C. Green. 2016. “Embracing the Complexities of ‘big Data’ in Archaeology: The Case of the English Landscape and Identities Project.” Journal of Archaeological Method and Theory 23 (1): 271–304.
- Cowgill, G. L. 1989. “The Concept of Diversity in Archaeological Theory.” In Quantifying Diversity in Archaeology, edited by R. D. Leonard and G. T. Jones, 131–141. Cambridge: Cambridge University Press.
- Crooks, K., and M. Sanjayan, eds. 2006. Connectivity Conservation. Cambridge: Cambridge University Press.
- Cunningham, P. 2011. “Caching Your Savings: The Use of Small-Scale Storage in European Prehistory.” Journal of Anthropological Archaeology 30 (2): 135–144. DOI: 10.1016/j.jaa.2010.12.005.
- DeBoer, W. R. 1988. “Subterranean Storage and the Organization of Surplus: The View from Eastern North America.” Southeastern Archaeology 7 (1): 1–20.
- Densmore, F. 1929. Chippewa Customs. Smithsonian Institution Bureau of American Ethnology Bulletin 86. Washington, D.C.: Government Printing Office.
- Dunham, S. B. 2000. “Cache Pits: Ethnohistory, Archaeology, and the Continuity of Tradition.” In Interpretations of Native North American Life: Material Contributions to Ethnohistory, edited by M. S. Nassaney and E. S. Johnson, 225–260. Gainesville, FL: University of Florida Press.
- Dunham, S. B. 2009. “Nuts about Acorns: A Pilot Study on Acorn Use in Woodland Period Subsistence in the Eastern Upper Peninsula of Michigan.” The Wisconsin Archaeologist 90 (1&2): 113–130.
- Dustin, F. 1966. “Prehistoric Storage Pits in Saginaw County, Michigan.” Michigan Archaeologist 14 (1/2): 48–52.
- Estes, L. D., G. S. Okin, A. G. Mwangi, and H. H. Shugart. 2008. “Habitat Selection by a Rare Forest Antelope: A Multi-Scale Approach Combining Field Data and Imagery From Three Sensors.” Remote Sensing of Environment 112 (15): 2033–2050. https://doi.org/10.1016/j.rse.2008.01.004.
- Evans, D. H., R. J. Fletcher, C. Pottier, J.-B. Chevance, D. Soutif, B. Suy Tan, S. Im, et al. 2013. “Uncovering Archaeological Landscapes at Angkor using Lidar.” Proc Natl Acad Sci U S A 110 (31): 12595–12600. https://doi.org/10.1073/pnas.1306539110.
- Frolking, S., M. Palace, D. Clark, J. Chambers, H. Shugart, and G. C. Hurtt. 2009. “Forest Disturbance and Recovery—A General Review in the Context of Space-Borne Remote Sensing of Impacts on Aboveground Biomass and Canopy Structure.” Journal of Geophysical Research 114 (G2): G00E02. DOI: 10.1029/2008JG000911.
- Gillings, M. 2015. “Mapping Invisibility: GIS Approaches to the Analysis of Hiding and Seclusion.” Journal of Archaeological Science 62: 1–14. https://doi.org/10.1016/j.jas.2015.06.015.
- Greenman, E. 1926. “Michigan Mounds, with Special Reference to Two in Missaukee County.” In Papers of the Michigan Academy of Science, Arts, and Letters Vol. 7, 1–9. Ann Arbor: Museum of Anthropology, University of Michigan.
- Hacigüzeller, P. 2012. “GIS, Critique, Representation and Beyond.” Journal of Social Archaeology 12 (2): 245–263. https://doi.org/10.1177/1469605312439139.
- Halstead, P., and J. O'Shea. 1989. “Introduction: Cultural Responses to Risk and Uncertainty.” In Bad Year Economics: Cultural Responses to Risk and Uncertainty, edited by P. Halstead and J. O'Shea, 1–8. Cambridge: Cambridge University Press.
- Hambacher, M. J., and M. B. Holman (with contributions from Katie C. Egan and Beverly A. Smith). 1995. “Camp, Cache and Carry: The Porter Creek South Site (20MN100) and Cache Pits at 20MN31 in the Manistee National Forest.” Michigan Archaeologist 41: 47–94.
- Franklin, K., and E. Hammer. 2018. “Untangling Palimpsest Landscapes in Conflict Zones: A “Remote Survey” in Spin Boldak, Southeast Afghanistan.” Journal of Field Archaeology 43: 58–73.
- Hendon, J. A. 2000. “Having and Holding: Storage, Memory, Knowledge, and Social Relations.” American Anthropologist 102 (1): 42–53.
- Holman, M. B., and F. J. Krist. 2001. “Late Woodland Storage and Mobility in Western Lower Michigan.” Wisconsin Archeologist: Papers in Honor of Carol I Mason 2: 7–32.
- Holman, M. B., and W. A. Lovis. 2008. “The Social and Environmental Constraints on Mobility in the Late Prehistoric Upper Great Lakes Region.” In The Archaeology of Mobility: Old and New World Nomadism, edited by H. Barnard and W. Wendrich, 280–306. Cotsen Advanced Seminars 4. Los Angeles: Cotsen Institute of Archaeology, University of California.
- Howey, M. C. L. 2015. “Geospatial Landscape Permeability Modeling for Archaeology: A Case Study of Food Storage in Northern Michigan.” Journal of Archaeological Science 64: 88–99.
- Howey, M. C. L., and M. Brouwer Burg. 2017. “Assessing the State of Archaeological GIS Research: Unbinding Analyses of Past Landscapes.” Journal of Archaeological Science—Special Issue: Archaeological GIS Today: Persistent Challenges, Pushing Old Boundaries, and Exploring New Horizons 84: 1–9.
- Howey, M. C. L., and K. Frederick. 2016. “Immovable Food Storage Facilities, Knowledge, and Landscape in Non-Sedentary Societies: Perspectives from Northern Michigan.” Journal of Anthropological Archaeology 42: 37–55.
- Howey, M. C. L., and K. Parker. 2008. “Camp, Cache, Stay Awhile: Preliminary Considerations of the Social and Economic Processes of Cache Pits Along Douglas Lake, MI.” Michigan Archaeologist 54: 19–43.
- Howey, M. C. L., M. W. Palace, C. H. McMichael, and B. Braswell. 2014. “Moderate-Resolution Remote Sensing and Geospatial Analyses of Microclimates, Mounds, and Maize in the Northern Great Lakes.” Advances in Archaeological Practice—Special Issue on Digital Domains 2 (3): 195–207.
- Howey, M. C. L., M. W. Palace, and C. H. McMichael. 2016. “Geospatial Modeling Approach to Monument Construction using Michigan from A. D. 1000–1600 as a Case Study.” Proc Natl Acad Sci 113 (27): 7443–7448.
- Howey, M. C. L., F. Sullivan, J. Tallant, R. Vande Kopple, and M. W. Palace. 2016. “Detecting Precotnact Anthropogenic Microtopographic Feaurs in a Forested Landscape with Lidar: A Case Study from the Upper Great Lakes Region, AD 1000–1600.” Plos One, https://doi.org/10.1371/journal.pone.0162062.
- Huggett, J. 2015. “A Manifesto for an Introspective Digital Archaeology.” Open Archaeology (1): 86–95.
- Ingold, T. 1983. “The Significance of Storage in Hunting Societies.” Man 18: 553–571.
- Ingold, T. 1993. “The Temporality of the Landscape.” World Archaeology 25 (2): 152–174. DOI: 10.1080/00438243.1993.9980235.
- Kinietz, W. V. 1947. Chippewa Village: The Story of Katikitegon. Bloomfield Hills, MI: Cranbrook Institute of Science.
- Kintigh, K. W., J. H. Altschul, M. C. Beaudry, R. D. Drennan, A. P. Kinzig, T. A. Kohler, W. F. Limp, et al. 2014. “Grand Challenges for Archaeology.” Proc Natl Acad Sci 111 (3): 879–880. https://doi.org/10.1073/pnas.1324000111.
- Kohut, L. E. 2018. “A Multidirectional Approach to Modeling Mobility Affordance in Past Landscapes.” Journal of Archaeological Science: Reports 19: 239–247.
- Lasaponara, R., R. Coluzzi, and N. Masini. 2012. “Flights into the Past: Full-Waveform Airborne Laser Scanning Data for Archaeological Investigation.” Journal of Archaeological Science 38 (9): 2061–2070.
- Law, R. G. 1999. “Pits Long, Large and Prestigious: Recognition of Varieties of Maori Kumara Storage Pits in Northern New Zealand.” New Zealand Journal of Archaeology 21: 29–45.
- Liebmann, M. J., J. Farella, C. I. Roos, A. Stack, S. Martini, and T. W. Swetnam. 2016. “Native American Depopulation, Reforestation, and Fire Regimes in the Southwest United States, 1492–1900 CE.” Proc Natl Acad Sci U S A 113 (6): E696–E704. pmid:26811459.
- Llobera, M. 2003. “Extending GIS-Based Visual Analysis: The Concept of Visualscapes.” Int. J. Geogr. Inf. Sci 17 (1): 25–48.
- Llobera, M. 2012. “Life on a Pixel: Challenges in the Development of Digital Methods within an “Interpretive” Landscape Archaeology Framework.” Journal Archaeological Method and Theory 19 (4): 495–509.
- Lock, G., M. Kormann, and J. Pouncett. 2014. “Visibility and Movement: Towards a GIS-Integrated Approach.” In Computational Approaches to the Study of Movement in Archaeology: Theory, Practice and Interpretation of Factors and Effects of Long Term Landscape Formation and Transformation, edited by S. Polla and P. Verhagen, 23–42. Berlin: Walter de Gruyter GmbH & Co KG.
- Lock, G., and J. Pouncett. 2017. “Spatial Thinking in Archaeology: Is GIS the Answer?” Journal of Archaeological Science—Special Issue: Archaeological GIS Today: Persistent Challenges, Pushing Old Boundaries, and Exploring New Horizons 84: 129–135.
- Lovis, W. A. 1976. “Quarter Sections and Forests: An Example of Probability Sampling in the Northeastern Woodlands.” American Antiquity 41: 364–372.
- Lovis, W. A. 1978a. “A Case Study of Construction Impacts on Archaeological Sites in Michigan's Inland Waterway.” Journal of Field Archaeology 5 (3): 357–360.
- Lovis, W. A. 1978b. “A Numerical Taxonomic Analysis of Changing Woodland Site Location Strategies on an Interior Lake Chain.” The Michigan Academician 11 (1): 39–48.
- Lovis, W. A., and R. Donahue. 2016. “Network Maintenance in Big Rough Spaces with Few People: The Labrador Innu-Naskapi or Montagnais.” In Marking the Land: Hunter-Gatherer Creation of Meaning in Their Environment, edited by W. A. Lovis, and R. Whallon, 116–130. New York/London: Routledge/Taylor and Francis.
- McCoy, M. D. 2017. “Geospatial Big Data and Archaeology: Prospects and Problems too Great to Ignore.” Journal of Archaeological Science—Special Issue: Archaeological GIS Today: Persistent Challenges, Pushing Old Boundaries, and Exploring New Horizons 84: 74–94.
- McCoy, M. D., G. P. Asner, and M. W. Graves. 2011. “Airborne Lidar Survey of Irrigated Agricultural Landscapes: an Application of the Slope Contrast Method.” Journal of Archaeological Science 38: 2141–2154.
- McLeester, M., J. Casana, M. R. Shurr, and A. C. Hill. 2018. “Detecting Prehistoric Landscape Features using Thermal, Multispectral, and Historical Imagery Analysis at Midewin National Tallgrass Prairie, Illinois.” Journal of Archaeological Science: Reports 21: 450–459.
- McMichael, C., M. W. Palace, M. B. Bush, B. Braswell, S. Hagen, E. G. Neves, M. R. Silman, E. K. Tamanaha, and C. Czarnecki. 2014a. “Predicting pre-Columbian Anthropogenic Soils in Amazonia.” Proceedings of the Royal Society B-Biological Sciences 281 (1777), http://doi.org/10.1098/rspb.2013.2475.
- McMichael, C., M. W. Palace, M. B. Bush, B. Braswell, S. Hagen, E. G. Neves, M. R. Silman, E. K. Tamanaha, and C. Czarnecki. 2014b. “Predicting pre-Columbian Soils in Amazonia.” Proceedings of the Royal Society B-Biological Sciences 281: 20132475. DOI:10.1098/rspb.2013.2475.
- McRae, B. H., B. G. Dickson, T. H. Keitt, and V. B. Shah. 2008. “Using Circuit Theory to Model Connectivity in Ecology, Evolution, and Conservation.” Ecology 89 (10): 2712–2724. DOI:10.1890/07-1861.1.
- Meggitt, M. J. 1962. Desert People: A Study of the Walbiri Aborigines of Central Australia. Sydney: Angus & Robertson.
- Morgan, C. 2012. “Modeling Modes of Hunter-Gatherer Food Storage.” American Antiquity 77 (4): 714–736.
- Moser, K., C. Ahn, and G. Noe. 2007. “Characterization of Micro Topography and its Influence on Vegetation Patterns in Created Wetlands.” Wetlands 27 (4): 1081–1097.
- O’Shea, J. 2003. “Inland Foragers and the Adoption of Maize Agriculture in the Upper Great Lakes of North America.” Before Farming: The Archaeology of Old-World Hunter-Gatherers 2 (3): 1–21.
- Palace, M. W., F. B. Sullivan, M. J. Ducey, R. N. Treuhaft, C. Herrick, J. Z. Shimbo, and J. Mota-E-Silva. 2015. “Estimating Forest Structure in a Tropical Forest using Field Measurements, a Synthetic Model and Discrete Return Lidar Data.” Remote Sensing of Environment 161: 1–11. DOI: 10.1016/j.rse.2015.01.020.
- Palace, M. W., C. McMichael, B. Braswell, S. C. Hagen, M. B. Bush, E. G. Neves, E. K. Tamanaha, C. Herrick, and S. Frolking. 2017. “Ancient Amazonian Populations Left Lasting Impacts on Forest Structure.” Ecosphere 8 (12): e02035. 10.1002/ecs2.2035.
- Palace, M. W., C. Herrick, J. DelGreco, D. Finnell, A. J. Garnello, C. McCalley, Kellen McArthur, F. Sullivan, and R. K. Varner. 2018. “Determining Subarctic Peatland Vegetation using an Unmanned Aerial System (UAS).” Remote Sensing 10 (9): 1498. DOI: 10.3390/rs10091498.
- Parcak, S., D. Gathings, Chase Childs, Greg Mumford, and Eric Cline. 2016. “Satellite Evidence of Archaeological Site Looting in Egypt: 2002–2013.” Antiquity 90 (349): 188–205. doi:10.15184/aqy.2016.1.
- Pelletier, D., M. Clark, M. G. Anderson, B. Rayfield, M. A. Wulder, and J. A. Cardille. 2014. “Applying Circuit Theory for Corridor Expansion and Management at Regional Scales: Tiling, Pinch Points, and Omnidirectional Connectivity.” PLoS ONE 9 (1): e84135. https://doi.org/10.1371/journal.pone.0084135002/ecs2.2035.
- Phillips, S. J., R. P. Anderson, and R. E. Schapire. 2006. “Maximum Entropy Modeling of Species Geographic Distributions.” Ecological Modelling 190 (2006): 231–259.
- Schneider, R. 1942. “Report of Cleaning Out a Cache Pit.” Totem Pole 10: 5.
- Schumacher, J. P. 1918. “Indian Remains in Door County.” Wisconsin Archeologist 16: 4.
- Schaetzl, R., and L. R. Follmer. 1990. “Longevity of Treethrow Microtopography: Implications for Mass Wasting.” Geomorphology 3: 113–123.
- Shirk, A. J., D. O. Wallin, S. A. Cushman, C. G. Rice, and K. I. Warheit. 2010. “Inferring Landscape Effects on Gene Flow: A new Model Selection Framework.” Molecular Ecology 19 (17): 3603–3619. DOI:10.1111/j.1365-294X.2010.04745.x.
- Spear, S. F., and A. Storfer. 2010. “Anthropogenic and Natural Disturbance Lead to Differing Patterns of Gene flow in the Rocky Mountain Tailed Frog, Ascaphus Montanus.” Biological Conservation 143 (3): 778–786. DOI: 10.1016/j.biocon.2009.12.021.
- Tanner, J. 1940 [1830]. An Indian Captivity (1789–1822), edited by Edwin James. Occasional Papers, Reprint Series No. 20. San Francisco: California State Library.
- Treat, C. C., M. E. Marushchak, C. Voigt, Y. Zhang, Z. Tan, Q. Zhuang, T. A. Virtanen, et al. 2018. “Tundra Landscape Heterogeneity, not Interannual Variability, Controls the Decadal Regional Carbon Balance in the Western Russian Arctic.” Global Change Biology 24 (11): 5188–5204. https://doi.org/10.1111/gcb.14421.