
ABSTRACT
Looting is a worldwide issue that occurs not only in conflict zones or areas with weak governmental control. Although national and international agencies are addressing the problem, we are far from solving it, due to its complexity and the insufficient allocation of resources. In this article, we examine the temporal and spatial patterns of looting at the single site level (Tūwāneh, southern Jordan) over the past decade. Our analysis utilized orthomosaics created in 2018 and 2019, a systematic surface survey conducted in November 2022, and publicly available satellite imagery (via Google Earth Pro) dating back to August 2013. We identified a total of 723 looting pits, of which 259 were excavated before August 2013 and 140 between August 2013 and November 2022; 324 were inconclusive due to methodological limitations. The findings suggest that looting is a persistent issue in the area, highlighting the importance of implementing effective measures to prevent the loss of archaeological heritage.
Introduction
Archaeologists all around the world are faced by the problems of looting (Atwood Citation2006; Mackenzie and Davis Citation2014; Desmarais and Desmarais Citation2015; Rodríguez Temiño and Roma Valdés Citation2015; Hardy Citation2016) and vandalism (Taruvinga and Ndoro Citation2003; Kersel Citation2012; Al-Houdalieh Citation2014; Chiovenda Citation2014; Cuneo et al. Citation2015). Although the reasons behind these phenomena may vary—times of unrest and warfare (Stone and Zimansky Citation1992; Chapman Citation1994; Casana Citation2015; Cuneo et al. Citation2015), bad economic situations (so-called subsistence digging: Staley Citation1993; Politis Citation2001, 259–261; Kersel Citation2007a; Parcak et al. Citation2016), or, on the contrary, an economic boom and related construction work (Politis Citation2001, 257–259; Kankpeyeng and DeCorse Citation2004; Dolinka Citation2007; Banks Citation2016; Rayne, Sheldrick, and Nikolaus Citation2017)—one thing is certain: the world’s archaeological heritage is often not a priority for central and local authorities, despite official assurances to the contrary. Furthermore, in many countries, the sheer abundance of archaeological sites exceeds the capacity of available financial resources to provide them with comprehensive protection. Consequently, the level of protection they receive remains inadequate.
Taking effective action to prevent the looting of sites and illegal trafficking of antiquities is hampered not only by limited resources and leniency toward robbers in many countries (cf. Shelbourn Citation2014, 190–195; Makowska, Oniszczuk, and Sabaciński Citation2016, 173–174; Yáñez Citation2016) but also because we usually have only residual data on the scale of the practice (Contreras Citation2010, 547; Contreras and Brodie Citation2010b, 101). In recent decades, archaeologists have begun to pay more attention to documenting cases of illegal excavations at the sites they study. In addition, satellite imagery has begun to be used on a large scale to identify looting activity (Contreras and Brodie Citation2010a, Citation2010b; Casana Citation2015; Parcak Citation2015; Parcak et al. Citation2016; Danti, Branting, and Penacho Citation2017; Tapete and Cigna Citation2019; Tapete et al. Citation2021). Attempts have even been made to develop methods for automatic (Bowen et al. Citation2017; Lasaponara and Masini Citation2018) or semi-automatic (Lauricella et al. Citation2017) identification of looting pits. While the great advantage of these methods is that they save time, they have been criticized for recording mainly pits of regular shapes while ignoring other types of damage easily seen during the much more time-consuming expert evaluation (Casana Citation2014, Citation2020). There is no doubt, however, that they are extremely helpful to both regional and supra-regional studies, as they allow the extent of damage to be assessed relatively quickly and without having to visit the sites.
Here, we present our experience of recording looting pits at the site level based only on expert evaluation of publicly available satellite imagery, kite- and pole-based orthomosaics of the site, and surface survey. We present the advantages and disadvantages of each approach. Above all, we demonstrate that the effectiveness of remote analysis methods largely depends on the character, degree of preservation of architectural remains, and the topography of the site.
With access to publicly available satellite imagery (Google Earth) of sufficient quality from the last ten years (2013–2022), we were able to assess not only the overall area of damage resulting from illegal excavations but also to identify individual pits. This allowed us to subsequently quantify the temporal extent of looting activity for the specified period. Quantification of the inflicted damage due to looting, along with estimations pertaining to the time periods within which these acts occurred, provides a method to gauge the ongoing detriment experienced by archaeological sites. It also allowed us to identify the zones of the site which, at any given time, were being particularly intensively excavated. In addition, this also made it possible to show a general trend in the number of looting pits excavated annually on the site.
The Local Context
Although excavating without the permission of the Department of AntiquitiesFootnote1 and trafficking in antiquities is prohibited in Jordan (Abu Abu Issa and Alwerikat Citation2023), looting activities are flourishing, supplying both the local and international markets with illegally excavated items (Kersel Citation2018; Kersel and Hill Citation2019; Kersel and Gerstenblith Citation2023, 4–5). Bronze Age artifacts—often associated with the biblical world (Kersel and Hill Citation2019, 305–306)—and Nabataean artifacts are of particular interest, but this does not mean that sites from other historical periods are safe. Individuals engaged in looting activities often claim that they are in search of gold. This assertion is based on both our personal observationsFootnote2 and the accounts provided by the staff of the Jordanian Department of Antiquities (cf. Al-Manaser and Atal Citation2020, 11–14). However, such an answer should be taken with a grain of salt, as cemeteries seem to be of particular interest, indicating that robbers are looking in the first place for intact artifacts of various kinds in a good state of preservation to be sold on the black market. Based on criminal statistics provided by Abu Issa and Alwerikat (Citation2023, 478), the instances of illegal excavations that were transferred to and dealt with by the judicial system in 2019 amounted to 257, followed by 241 in 2020 and 272 in 2021.
There is no doubt that robbery activities have a very long tradition dating back to pre- and proto-historical periods. It intensified, however, in the 20th century a.d., due to both population growth and technical possibilities (e.g. the use of metal detectors). Most of this type of activity in Jordan is—it seems—economically motivated (Politis Citation2001, 257–258; Rose and Burke Citation2004; Brodie and Contreras Citation2012; Kersel and Hill Citation2019, 317–323; Al-Manaser and Atal Citation2020). Official government figures indicate that the unemployment rate has been rising in recent years, reaching 25% in 2021Footnote3 (among young people under 30, it could be as high as 33%).Footnote4 Even if part of this phenomenon is mitigated by employment in the grey and black economies, it may further fuel the looting of archaeological sites. When considering the usually slim likelihood of being apprehended and seldom, lenient penalties, looters weigh the potential risks against the possibility of earning substantial and effortless income (easy money) to support their households and often find it to be a more attractive option (Kersel Citation2007b; Sheftel Citation2012; cf. Goldin Citation2004).
Many instances of looting activities are known from Jordan, making it impossible to discuss all of them in such a short text. Nevertheless, we present some examples to illustrate the problem at the local level. One of the most shocking examples is the plunder of the ancient city of Zoar. As soon as the inhabitants of Ghor as-Ṣāfī (Ar. غور الصافي , Karak-Al Agbwar Al Janobeyah) realized that the workers of the Italian company preparing irrigation systems for the surrounding fields as part of a major agrarian project were interested in the antiquities, they started digging up their own gardens in search of artifacts, irretrievably destroying a part of this important site (Politis Citation2001, 258). Far-reaching damage was then caused to the sites of Khirbet Sheīkh ‘Īsa (Ar. خربة الشيخ عيسى), where a heap of stones collected by a bulldozer in the 1970s was the only trace of Byzantine and medieval architecture there (Politis Citation2001, 259, fig. 14.1), and the cemetery of an-Naq’ (Ar. الــنــقــع ; Politis Citation2001, 259–261, figs. 14.2–5). At an Early Bronze Age cemetery at Fīfā (Ar. فيفا , Karak-Al Agbwar Al Janobeyah), 3723 looting pits were recorded (Kersel and Hill Citation2019, 309–310, figs. 2–3; Citation2020). At the same time, only a handful of graves have been excavated by professionals (Rast and Schaub Citation1990; Najjar Citation2001), as best illustrated by the plan published by Kersel and Hill (Kersel and Hill Citation2019, 310, fig. 3).Footnote5 A similar degree of destruction can be found at the cemetery at Bāb edh-Dhrā’ (Ar. باب الذراع , Karak-Ghor Mazra’ah), dated to the same period, from where the first reports of looting date back to the 1920s, from the accounts of Albright and Mallon (Albright Citation1924, 5–6; McCreery Citation1996; Contreras and Brodie Citation2010a, 107–109; Kersel and Chesson Citation2013). Adjacent to the site is the Nabataean, Roman, Byzantine, and early Islamic cemetery of Khirbet Qāzūne (Ar. خربة قازون ), which was identified in 1979 (Rast et al. Citation1980, 40). In 1994, graves were found during road widening. There was rapid looting: a survey from 1996–1997 recorded more than 3500 looted Nabataean graves (Politis Citation1998). In 1996, a team from The Wadi Faynan Project (Ar. وادي فينان , Ṭafīlah) estimated that more than 700 graves had been excavated at the Late Roman and Byzantine cemetery there, accounting for more than 40% of all graves at the site (Findlater et al. Citation1998, 70–71). Even in Petra (ʻAqaba-Wādī ‘Araba), there have been incidents of robbery and vandalism (Knodell and Alcock Citation2011; Sinibaldi and Tuttle Citation2011; Alcock and Knodell Citation2012; Urban, Alcock, and Tuttle Citation2012; Urban et al. Citation2014), which the Brown University Petra Project team members recorded accurately (Vella et al. Citation2015). While robbers appear to focus primarily on Bronze Age and Nabataean sites, it’s important to note that sites from other periods are also at risk. For instance, there have been illegal excavations at the Pre-Pottery Neolithic A site at Wādī Sharāra (Ar. وادي شراره , Karak-Al-Mazār al-Janūbī) (Sampson Citation2020) or the Early Islamic site at Wādī Shīreh (Ar. وادي شيره , ʻAqaba-Al-Qūaīrah) (Al-Bqain, Corbett, and Khamis Citation2015).
In addition to illegal excavations, instances of vandalism at archaeological sites are also known from Jordan. The flagship example from recent years is the destruction of the Rujm al-Faridiyyeh fort (Ṭafīlah-Al-Ḥasā) between August 2013 and January 2017 using heavy equipment (Fisher et al. Citation2021, 280–281, fig. 2).Footnote6 It is, however, worth noting that damage to the eastern wall of this site by a bulldozer was reported by MacDonald as early as 1984 (MacDonald Citation1984, 226).
The Object of Research
Tūwāneh (Ar. توانه )Footnote7 is a site located in the Ṭafīlah-Al-Ḥasā district in southern Jordan. The main settlement phase dates to the Nabataean, Roman, and Byzantine periods, with traces of human habitation in the Iron Age and the Mamluk period (Fiema Citation1993, 549; Citation1997, 315; MacDonald et al. Citation2004, 351–352; Bodzek et al. Citation2019, 70–71). The total area of the site is estimated at 55 ha, although architectural remains can be seen on the surface over about 35 ha. The site has not yet been the subject of large-scale archaeological research. It has primarily been the subject of two surface surveys conducted as part of the Via Nova Traiana Project (Fiema Citation1993, Citation1997) and the Tafila-Busayra Archaeological Survey (MacDonald et al. Citation2004, 348–354). The former was more intensive, as the site was one of the foci of the project. It was only in 2018 that a team of Polish archaeologists and surveyors began regular surveys and test excavations on the site (Bodzek et al. Citation2019). Although threats to the site had already been noted, most notably the construction of a road that runs through the center of the site just above the bottom of the wadi and the development of agriculture (Fiema Citation1997, 316; MacDonald et al. Citation2004, 348; Bodzek, Kopij, and Miszk Citation2019), it was only with the start of the Polish project that the process of documenting the looting pits began. The site is under the care of the Ṭafīlah Antiquities Office, which has appointed a warden to oversee the site. The absence of fencing around the site, coupled with the infrequent visits by the warden (due to his responsibility for numerous sites in the region), results in unrestricted access to the site.
An exceedingly crucial aspect of Tūwāneh, in the context of documenting illicit excavations, lies in its diverse characteristics, the level of architectural remains’ preservation, and its topography. The site predominantly resides on the opposing slopes of two hills with varying inclinations, divided by a wadi. Portions of the site are also situated on flatter terrain, both near the hilltops, in the southern region, and adjacent to the bottom of the wadi. Furthermore, substantial portions of the site feature architectural remnants displaying differing degrees of preservation.
Methodology
Data used for this study were collected during three seasons: 2018, 2019, and 2022. During the 2018 season, the pole photogrammetric system known as ULAPh (Ultra-Low Altitude Photogrammetry) was used to document part of the site adjacent to the so-called caravanserai (Bodzek et al. Citation2019, 77–78). Measurements were taken using a fairly simple system consisting of a GoPro HERO 6 Black camera on a 5 m Leveling pole. Prior to the survey, survey points were set up in the survey area, forming a square grid with 5 m sides. Oblique images were then taken at each point in eight different directions (Bodzek et al. Citation2019, fig. 7). In this way, photogrammetric data of an area of about 2.5 ha located in the central part of the site (the so-called caravanserai complex with its adjacencies) () were acquired, with a ground sampling distance (GSD) of 4 mm. During the fieldwork, more than 4800 images were taken at 600 survey points. Additionally, 51 ground control points (GCPs) and 49 check points (CPs) were established for the purpose of georeferencing and verification of the accuracy of the photogrammetric products, with their coordinates having been determined using the Real Time Kinematic (RTK) GNSS with 3D accuracy of 3 cm. The fieldwork and data collection took three days. The data obtained were processed with the use of the Structure from Motion (SfM) algorithm implemented in Agisoft Metashape Professional software. The final products—an orthomosaic with a spatial resolution of 4 cm (in this text designated as ORTHO18) and a digital elevation model (DEM) with a spatial resolution of 16 cm—were used for this study. In addition, pits located in the central part of the site outside the ULAPh area were mapped and photographed. In total, these activities covered approximately 10 ha (Supplemental Materials 1–2).7
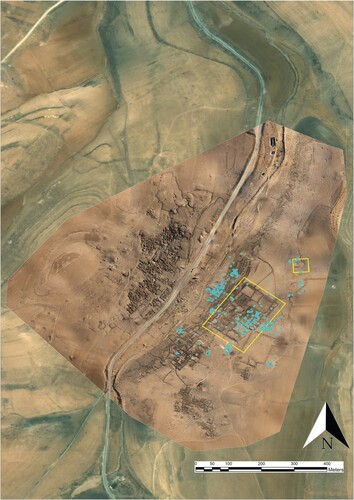
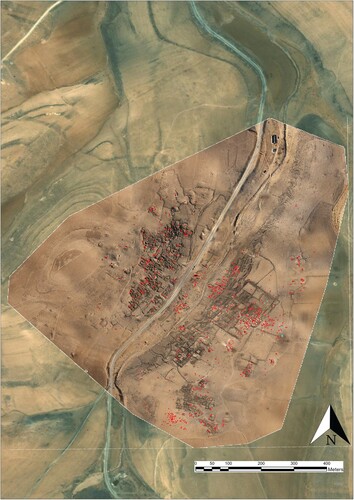
Figure 1. Orthomosaic (ORTHO19) of the site created in autumn 2019. Yellow boxes indicate sites where pole-based photogrammetry was carried out in 2018. Blue shapes indicate looting pits measured in 2018 with GPS.
Since obtaining a permit to use an unmanned aerial vehicle (UAV) in Jordan is time- and cost-consuming, in 2019, we decided to take measurements for the entire site using a kite. The survey system consisted of a GoPro Hero 6 camera mounted on a gimbal and attached to a kite. Approximately 6900 images with a 30 mm GSD were acquired over the three days. The 55 ha surveyed area covered the entire site. A total of 166 GCPs and CPs were also established during the survey. They were distributed evenly over the study area in a 70 m grid. Their coordinates were measured with the RTK GNSS method with 3D accuracy of 3 cm. Photogrammetric data was processed using Agisoft Metashape Professional. The final products used in this study, an orthomosaic (ORTHO19) and a DEM, had spatial resolutions of 3 cm and 12 cm, respectively. These became the basis for the inventory of aerially visible looting pits within the entire site (Bodzek et al. Citation2022, 25) (Supplemental Materials 3–4).
In the 2022 season, we implemented a systematic survey of the entire site, mapping all visible looting pits using the RTK GNSS (in this text designated as INV22) and taking photos of them. The manner in which the intensive survey was carried out was modeled on a similar study of Petra’s hinterland (except that the survey there covered a much larger area) (Knodell and Alcock Citation2011, 492–495; Vella et al. Citation2015, 40:225). The inventory thus created served as a reference point for the study, as it was the most complete inventory of looting pits at the site (Supplemental Material 5). The inventory of the roughly 55 ha site was completed in three days, which is equivalent to approximately 16–18 hours.
ArcGIS Pro 3.0.2 software was used for further processing of the survey data. The first step was to import the coordinates of the outer contours of the looting pits (for the 2018 data), or the central points of the pits (for the 2022 data), collected during the surface surveys. These were determined in the WGS84 system and thus had to be converted to the Jordanian system (EPSG:3066). Then, using photogrammetric products available from the inventory documentation where possible, all pits were vectored.
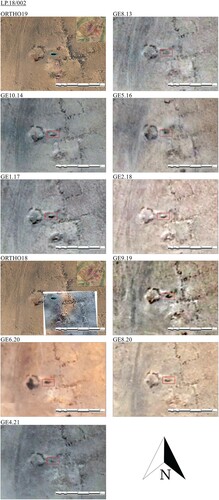
In 2018, measurements were taken for the area limited to the so-called caravanserai complex. In 2019, measurements were taken for the entire site. This allowed us to compare if new looting pits emerged near the so-called caravanserai over the year. The comparison was done systematically using imagery, including orthomosaics and DEMs. The next step was to compare the orthomosaic and DEM of the entire site with publicly available satellite imagery (via Google Earth Pro). To perform this operation, the images were downloaded at the best possible resolution (approximately 200 cm), and they were then transferred to the ArcGIS Pro environment, where they were assembled and georeferenced to make the comparison as simple as possible. The method of analyzing satellite imagery was primarily inspired by publications by Parcak (Parcak Citation2015; Parcak et al. Citation2016, 190–191). Nine images with resolutions sufficient to detect at least a portion of the looting pits covering the area of the entire site are available on the platform. They come from 10 August 2013, 12 October 2014, 22 May 2016, 3 January 2017, 4 February 2018, 10 September 2019, 15 June 2020, 6 August 2020, and 18 April 2021 (in this text, they are designated as GE8.13, GE10.14, GE5.16, GE1.17, GE2.18, GE9.19, GE6.20, GE8.20, and GE4.21, respectively). Regrettably, we did not document the precise time it took to analyze the images, which would have given us a better understanding of how time-consuming the process was. All we know is that the analysis took 19 days (though we are unable to determine the exact number of hours it consumed). By comparing the imagery, we were able, in some cases, to narrow down the time of the occurrence of the looting pits. shows pit LP.18/002, which is clearly visible in all the images. A similar temporal analysis, albeit on a smaller timescale, has already been applied to sites in war-torn Syria, e.g. at Apamea (Tapete, Cigna, and Donoghue Citation2016; Agapiou Citation2020). On a smaller time scale, in the context of Jordan, the process of looting the Fīfā cemetery was studied using surface survey and UAV orthomosaic analysis (Kersel and Hill Citation2019, Citation2020). In contrast, a similar time scale analysis was carried out by Parcak (Parcak Citation2015; Parcak et al. Citation2016) for 267 sites in Egypt, where looting activity increased after the 2011 Egyptian revolution. In this case, however, we are dealing with sites with different characteristics than Tūwāneh, as these were cemeteries.
Figure 2. Compilation of all available imagery for trench LP.18/002.
Results
The fact that the site is dotted with looting pits was made clear to us by our first reconnaissance visit to Tūwāneh in the fall of 2017, which lasted only a few hours. During our first research season in 2018, we also noticed that the plunder was progressing, as evidenced by the changes that had taken place within the ruins of the ancient baths. Based on 2018 data, we recorded a total of 191 looting pits based on direct measurements (119) (Bodzek et al. Citation2019, 81, figs. 3, 14) and later by the ORTHO18 analysis (72) (see ).
A comparison of ORTHO18 with ORTHO19 (and the corresponding DEMs) indicated that between the creation of these images, four new looting pits were excavated in the area covered by both of them. For three of these, we are certain (LP.19/007, LP.19/008, and LP.19/014) (Supplemental Material 6)Footnote8 that they were dug between early November 2018 and early November 2019, while for the other (LP.22/039), we cannot say with more precision when it was created, as it is a small and shallow pit that cannot be seen well on the imagery.
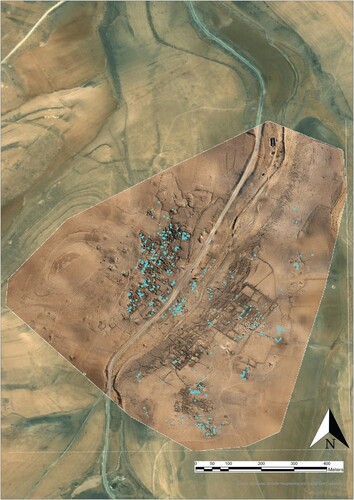
Analysis of the ORTHO19 revealed the presence of 175 further pits in addition to the 191 recorded the year before (). Recognizing the limitations of the method of identifying trenches on the imagery (discussed below), we conducted a systematic survey of the site in 2022. It revealed the presence of a further 356 looting pits ().
Figure 3. A plan of the pits recorded from the ORTHO19 analysis.
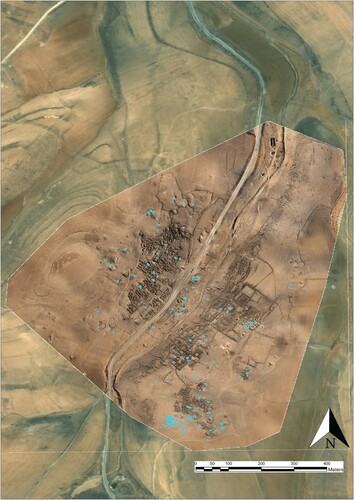
Figure 4. A plan of the pits recorded during the systematic ground survey (INV22).
We then analyzed satellite imagery from Google Earth Pro. The analysis of the initial imagery and its comparison with the INV22 shows that 259 of them were certainly excavated prior to GE8.13 (). In the case of 324, we cannot say whether they already existed at that time, for various reasons which we will discuss below. The analysis of the imagery suggests that 20 new looting pits were excavated between GE8.13 and GE10.14 (), 15 between GE10.14 and GE5.16 (), 27 between GE5.16 and GE1.17 (), 10 between GE1.17 and GE2.18 (), 14 between GE2.18 and GE9.19 (), 20 between ORTHO19 and GE6.20 (), three between GE6.20 and GE8.20 (), and six between GE8.20 and GE4.21 () (see Supplemental Material 6 for a full tabular summary of pits).
Figure 5. A plan of the pits excavated before August 2013 (marked in blue; red indicates all the pits documented). Based on analysis of satellite imagery available on Google Earth.
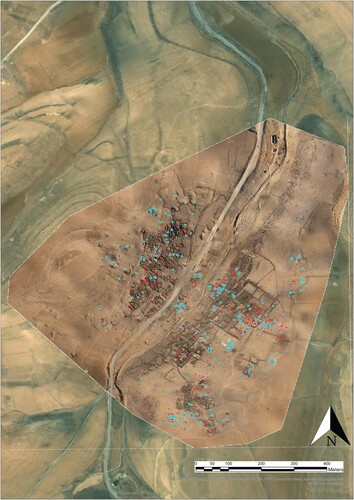
Figure 6. A plan of the pits excavated between August 2013 and October 2014 (marked in blue; red indicates all the pits documented). Based on analysis of satellite imagery available on Google Earth.

Figure 7. A plan of the pits excavated between October 2014 and May 2016 (marked in blue; red indicates all the pits documented). Based on analysis of satellite imagery available on Google Earth.

Figure 8. A plan of the pits excavated between May 2016 and January 2017 (marked in blue; red indicates all the pits documented). Based on analysis of satellite imagery available on Google Earth.

Figure 9. A plan of the pits excavated between January 2017 and February 2018 (marked in blue; red indicates all the pits documented). Based on analysis of satellite imagery available on Google Earth.
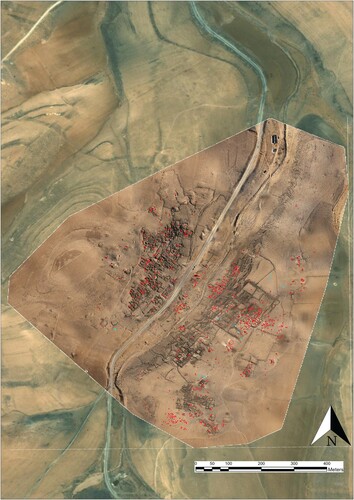
Figure 10. A plan of the pits excavated between February 2018 and September 2019 (marked in blue; red indicates all the pits documented). Based on analysis of satellite imagery available on Google Earth.

Figure 11. A plan of the pits excavated between November 2019 and June 2020 (marked in blue; red indicates all the pits documented). Based on analysis of satellite imagery available on Google Earth and ORTHO19.
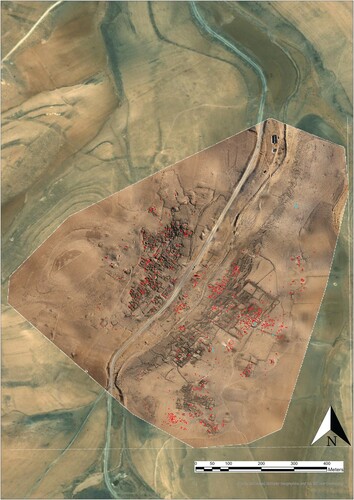
Figure 12. A plan of the pits excavated between June 2020 and August 2020 (marked in blue; red indicates all the pits documented). Based on analysis of satellite imagery available on Google Earth.
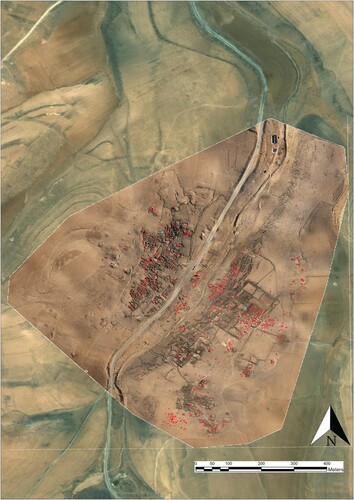
Figure 13. A plan of the pits excavated between August 2020 and April 2021 (marked in blue; red indicates all the pits documented). Based on analysis of satellite imagery available on Google Earth.
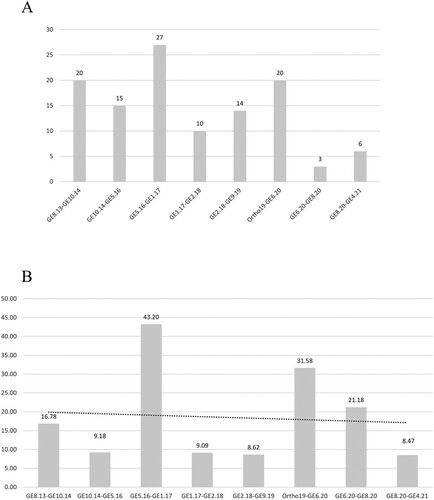
The average annual number of looting pits created after August 2013 is 15.6. However, as can be seen in , the number of looting pits created on an annual basis varied considerably from year to year. There was a particular spike of illegal excavations during the periods GE5.16–GE1.17 and ORTHO19–GE6.20. Both of these periods covered approximately 7.5 months, during which 27 new pits were excavated in the former and 20 in the latter. The overall data show a very slight downward trend, yet the extremely low R2 value (0.0058) indicates that, in practice, the average annual number of trenches has remained constant during the investigated period.
Figure 14. A) Number of looting pits excavated between consecutive images. The exclusion of the period between GE9.19 and ORTHO19 is due to the fact that the increase in the number of pits may have been due not only to the number of pits actually excavated but also to the much better resolution of ORTHO19, which allowed previously invisible pits to be seen. B) Number of looting pits excavated between consecutive images averaged over 12 months with a linear trend line (y = -0.3996x + 20.31; R2 = 0.0058).
Analysis of the imagery indicates that over the last decade (post-GE8.13), illegal excavation activity has been mainly concentrated in the eastern part of the site (i.e. east of the modern road). It is worth noting, however, that in the western part, we are faced with tightly packed ruins consisting of structures with small rooms, whose walls are preserved to a considerable height in places (usually to a height of 1–1.5 m from ground level, even higher in places). The shadows they cast make it difficult (and sometimes impossible) to identify the looting pits on the basis of imagery analysis. An additional complication is that the interiors are filled with debris, in which it is difficult to see the looting pits.
Illegal excavations of the cemetery in the southern part of the site, which commenced prior to GE8.13, persisted intensely until GE1.17. This intensity was particularly notable between GE5.16 and GE1.17, during which we documented as many as 12 new pits in this zone. Subsequently, the intensity of excavations gradually declined, with the final trenches we observed in this area appearing before GE6.20. The situation is similar in the cemetery located at the eastern boundary of the site, adjacent to the so-called caravanserai. The intensity of illegal excavations here is lower than in the southern cemetery: between GE1.13 and GE9.19, two or three pits were explored per period between consecutive images (except for the period between GE1.17 and GE2.18, when no pits were excavated in this zone). After GE2.19, only single pits were excavated in the boundary zone, where the remains of stone structures are located (at this point, we cannot say whether these structures have an ancient provenance or whether they were made in modern times in connection with nomadic and pastoral activities).
In the period after GE1.17, illegal excavation seems to have ceased in the area of the baths, i.e. in the area to the west of the so-called caravanserai complex, just off the eastern bank of the wadi valley (previously, two to four trenches were excavated here between consecutive images). The sole indications of looting activity that we documented within this area are not discernible in the imagery and were linked to the gradual excavations of the baths that took place between our visits in November 2017 and November 2018. Two instances of looting pits resurface here once more, occurring between GE4.21 and the INV22. In addition, during our visit to the site in autumn 2023, we observed that robbers had exposed our excavation trench dug the year before (TTIV), which we had backfilled with large stones and soil after exploration. This further confirms that the activity of professional archaeologists can inspire robbers to search in the same places.
The northeastern zone of the site is interesting, as there we do not record robber activity between GE8.13 and GE4.21. In contrast, four new pits were excavated here between GE4.21 and the INV22. Between GE8.13 and GE9.19, we also noted no illegal excavations in the area adjacent to the caravanserai complex to the south and southwest. However, robbers became active here between GE9.19 and GE.8.20, when three new pits were explored here. The vast majority of the pits in the zone between the wadi and the modern road were dug before GE8.13 (some, incidentally, may have been related to the construction of the road itself in the late 1980s). Only between GE4.21 and INV22 were five new pits excavated here. In addition to identifying periods when some of the pits are likely to have been excavated, our analysis also revealed other interesting changes to the site. One interesting case is LP.18/018, which is visible in GE10.14, invisible in GE8.13 and later in GE5.16, then clearly visible in GE1.17, GE2.18, GE9.19, and ORTHO19, and then again invisible and not measured at the time of the INV22. As it lies in the immediate vicinity of the wadi, approximately 8.8 m from the main bed, it is possible that it was covered by flows of water after heavy rainfalls. Another interesting case is pit LP.19/006. Based on the analysis of the satellite images, it is difficult to say when the pit was originally dug, but the analysis of the ORTHO18 and the ORTHO19 indicates that the pit was enlarged between these two measurements.
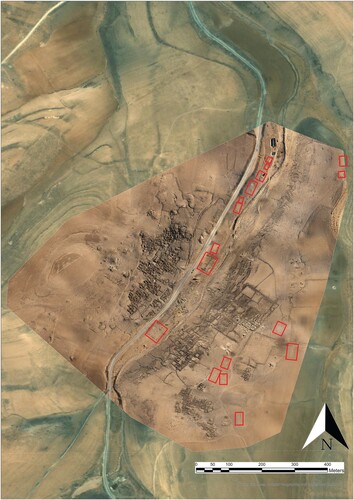
Yet another curious case, this time unrelated to the excavation of the looting pits but to the modification of the stone structures that we observed on the satellite imagery, is the formation of an animal pen between GE10.14 and GE5.16, followed by its enlargement between GE2.18 and GE9.19 (). Probably, this is the result of the activity of nomads who periodically camp in the immediate vicinity of or on the site. The presence of nomadic camps and their possible impact on the site’s preservation has been noted previously (Bodzek, Kopij, and Miszk Citation2019, 45–47, fig. 12). Based on the analysis of the traces that remain of the encampments visible in ORTHO19, we can pinpoint the places where the nomads camped (). The construction and use of the camps involved the creation of some of the pits, which were probably of a utilitarian nature, e.g. rubbish dumps or food preparation areas. An example of such an object is LP.22/157, which is not visible on any imagery. It is possible that it was excavated during the construction, operation, or rolling up of the camp that can be seen adjacent to the pit in GE4.21. With that said, we have no indication that the nomads themselves are involved in the process of illegal excavation in Tūwāneh, despite reports from other sites and studies focused on the illegal trade in antiquities (Kersel Citation2007b; Gebel et al. Citation2011). Rather, representatives of the Department of Antiquities pointed to the nearby town dwellers.
Figure 15. A compilation of images illustrating the creation and changes to the animal pen.
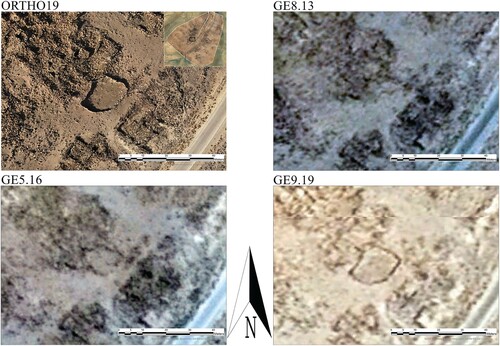
Figure 16. Plan of the remains of Bedouin camps on the site in the area covered by ORTHO19 (marked by red boxes).
Discussion and Limitations
Each of the methods we used—systematic surface survey, analysis of orthomosaics taken from the air, and analysis of satellite imagery—has its pros and cons. By far the most effective in identifying illegal excavation is the first method. Using it, we were able to record as many as 634 pits. However, it should be noted right away that not all the pits we had already recorded before were documented by us during the INV22. We omitted 65 pits for various reasons. In some cases, during the INV22, the previously recorded pits were considered to be part of a larger whole (e.g. LP.18/023, LP.18/026, LP.18/103, or LP.18/104). Others were already shallow and poorly visible at the time of recording and so may no longer have been visible in the field (e.g. LP.18/101). Moreover, some of the pits are on the periphery of the site, which we did not cover with the INV22 (e.g. LP.19/079, LP.19/143, or LP.19/144). The latter group represents the largest, together with the pits that we simply did not notice during the survey. This clearly shows that, although the systematic surface survey is the most effective method for recording looting pits, only a combination of several methods allows all disturbances to be recorded.
Needless to say, as already noted in the literature (Casana and Panahipour Citation2014; AAAS Citation2015; Casana Citation2015), not all sites are always available for such a survey, which may be due to complex political situations, including armed conflict. However, our study confirms that the analysis of aerial and publicly available satellite imagery is a good complement to the surface survey in countries at peace, as well, and, above all, it provides a glimpse of the history of looting activity on sites that have not been intensively studied by archaeologists. It makes it possible not only to determine the overall scale of robbery activity (cf. Contreras and Brodie Citation2010b) but also its progress over at least the previous 10 years.Footnote9 Thus, not only does it allow monitoring the situation to some extent on sites that are not the subject of active investigations by surveys and/or excavation, but it can also be one of the first research activities on sites where archaeological work is initiated and where traces of illegal excavations are visible. It is worth noting right away that the mere initiation of research, even more so when given publicity (Kersel, Chesson, and Hill Citation2021), can stimulate robber activity, even if, as with Tūwāneh, it is a well-known site with remains still visible on the surface today. We suspect that the excavation of the two new trenches between GE4.21 and INV22 in the area of the baths may have been related to the test excavation we started during the 2019 season. Indeed, it appears that previous robbing activity in this area ceased after GE1.17 was taken. Thus, it is not only the sharing of research results (including, above all, the coordinates of previously unknown sites) in open-access mode that can stimulate robbery activities, as has already been raised in the literature (Ur Citation2006, 37; Parcak Citation2009, 220–232, esp. 224, 230), but even the initiation of research on known sites that have already been the subject of large-scale illegal activities, as well as excavations. Indeed, at Tūwāneh, the publication of the research report for the 2019 season did not take place until the end of 2022 (Bodzek et al. Citation2022), so mere observation of our activities may have inspired the robbers to re-establish themselves in the area of the baths.
Our study shows that both the analysis of satellite imagery as well as the pole- and kite-based orthomosaics, where possible, should be accompanied by a surface survey. This is because not all parts of sites such as Tūwāneh give an equally clear image to locate looting pits. Our study clearly shows that it is relatively easy to identify pits on flat surfaces with no visible remains of buildings or where these buildings are very loosely spaced and the visible walls are at a distance from each other. The heaps surrounding the trenches, which have a distinctive bagel/donut shape and are often distinguished by their color, as Parcak has pointed out (Parcak Citation2015, 197), are a considerable help here. The analysis of the gradual excavations of the cemeteries gave particularly good results, thus confirming the spectacular results for this type of site obtained by Parcak for 267 sites in Egypt (Parcak Citation2015; Parcak et al. Citation2016) and Kersel and Hill for Fīfā (Kersel and Hill Citation2019). Looting pits within cemeteries are also more easily recognizable on lower-resolution imagery than trenches within the settlement areas of sites, especially those with relatively well-preserved architectural remains. At the same time, comparison of satellite imagery with higher-resolution orthomosaics makes it possible to distinguish pits from larger stones and clusters of stones, which may be mistaken for pits on lower-quality imagery.
The analysis of the imagery of the parts of the site where the remains of dense development are located yields much worse results. Here, both the walls themselves (casting shadows that make identification of the trench difficult) and the debris are in the way. In this case, the ORTHO19 analysis yielded only marginally better results than the analysis of satellite imagery. The majority of such pits were only recorded during the INV22. This is well illustrated by comparing the number of looting pits recorded during ORTHO19 and INV22 for different parts of the site. Only 16 pits were documented during the ORTHO19 analysis in the western part of the site (west of the wadi) in a zone with well-preserved architectural remains covering an area of approximately 4 ha. In contrast, during the INV22 surface survey in this zone of the site, we recorded as many as 140 pits that had not been previously documented. Even if we add the annual average number of pits resulting from our analysis that could have been excavated in the three years between consecutive measurements (47), this would still give us a total of 63 pits: that is, only 30% of the total number of pits recorded in this area. It is worth noting, however, that our observations of the state of the pits indicate that only a few of these may have been excavated in recent years.
In the much smaller area of architectural remains in the southern part of the site (immediately adjacent to the southern cemetery), covering an area of approximately 1 ha, the ORTHO19 analysis revealed the presence of 15 pits, while INV22 revealed 30 previously unrecorded pits. Although, in this case, it is theoretically possible that all these pits were excavated after ORTHO19, our observations indicate that the vast majority of them were pits that had been excavated earlier. In comparison, in the flat area of the southern cemetery, the ORTHO19 survey identified 68 pits, while the INV22 survey identified only eight previously unrecorded pits. This clearly highlights the variations in pit recording capabilities among different methods, depending on the preservation status of architectural remains and the site’s topography.
In the rubble, rather large pits are visible, as are those that have been made relatively recently. In the case of the latter, especially if they are relatively deep, the heaps may still show soil layers removed during exploration. In the case of older pits, such soil has been gradually washed away between the stones, making it difficult to see the pit. At the same time, gradual excavations mean that earlier pits are swamped with debris by robbers, making it virtually impossible to see them from the air. Only field reconnaissance shows a depression in the ground: evidence of a former pit. Undoubtedly, the surface survey is significantly more time- and cost-intensive compared to the imagery analysis. However, it’s important to highlight that our survey of the site of approximately 55 ha, characterized by the presence of stone architecture remnants protruding above ground level at various heights, presenting difficulties in navigating, required a total of approximately 16–18 hours. It yielded significantly superior results compared to remote analysis in areas of the site characterized by well-preserved architectural remains and instances where heaps of new pits obscured the old ones.
The varying effectiveness of remotely analyzing illegal excavations on sites with more intricate characteristics does not, of course, render such endeavors meaningless. Firstly, they offer at least a partial glimpse into the history of looting activities that have otherwise gone unrecorded. This, in turn, enables the assessment of trends and perhaps even the identification of periods during the year when looting is most rampant. Secondly, given the limited resources that authorities can allocate to monitoring archaeological sites and combating looting, recognizing the differing impact of remote analysis can lead to a more optimal distribution of resources.
Sites conducive to remote analysis, like cemeteries or settlement sites lacking visible surface architectural remains, or where such remnants are poorly preserved, can be primarily monitored using this approach. Consequently, more resources can be dedicated to monitoring sites where remote analysis of looting activity is especially challenging. Furthermore, for sites characterized by diverse characteristics and topography, such as Tūwāneh, it becomes feasible to segregate zones where remote analysis proves effective from those where it does not. This way, authorities can curtail the resources allocated to on-site monitoring of looting activities, focusing mainly on sections of sites where remote analysis would not yield satisfactory results, i.e. would not provide a comprehensive understanding of the phenomenon.
Conclusion
During our surveys at Tūwāneh, we recorded 723 looting pits by surface surveys and the analysis of orthomosaics created based on the pole- and kite-based photogrammetry. Comparing these results with the analysis of satellite imagery available for free via Google Earth has given us insight into the last 10 years of robbery activity at the site (2013–2022). At least 259 looting pits were certainly excavated before 10 August 2013. For 324, we cannot be sure whether they were created before or after this date, due to the limitations of the method used. The remaining 140 pits were created between 10 August 2013 and the beginning of November 2022, giving an average of 15.5 new pits per year (in reality, the rate varies between 8.6 and 43 pits per year). Thus far, we have been unable to pinpoint any specific time of the year when looting activity would significantly intensify. The three pits excavated within 1.7 months between GE6.20 and GE8.20 are closely aligned with the monthly average of 2.2, making it challenging to arrive at definitive conclusions. Nevertheless, we anticipate that as more data is collected in the future, we will be better poised to ascertain the occurrence of periods with heightened illegal excavation activity. Considering the restricted resources allocated to safeguarding cultural heritage, acquiring information regarding any specific period or periods of the year when looting activities commonly occur would aid the authorities in directing their resources effectively. For example, this could involve enhancing the frequency of site visits by the warden or law enforcement officers. The study of satellite imagery for a site as complex as Tūwāneh has shown the limitations of this method. It is clearly evident that an analysis of the imagery for some parts of the site (flat areas with little or no architectural remains visible on the surface, e.g. cemeteries) gave much better results than an analysis of other parts (mainly densely built-up with a lot of debris). This clearly shows that such an analysis must also be accompanied by a surface survey wherever possible.
Certain sites, such as cemeteries or settlements lacking visible architectural remnants, are well-suited for remote analysis. This enables a more focused approach on sites that present challenges for remote analysis. In the case of diverse sites like Tūwāneh, it becomes possible to differentiate areas where remote analysis is successful from those where it is not viable, facilitating precise resource allocation. This aids authorities in prioritizing on-site monitoring in areas where remote analysis does not sufficiently offer a comprehensive understanding of looting activities.
In the future, we hope that by obtaining more satellite and aerial imagery (including that commercially available) we will be able to extend the temporal dimension of our research and reach further into the past. All this will allow us to determine the pace of looting activity even more effectively and identify possible trends. This, in turn, will help us to develop, together with the Department of Antiquities of the Kingdom of Jordan, a more effective strategy to protect Tūwāneh from further destruction.
Geolocation Information
GPS coordinates of the site: 30.7494, 35.7242.
Supplemental Material
Download MS Excel (50.5 KB)Supplemental Material
Download MS Excel (46.4 KB)Supplemental Material
Download Zip (103.9 MB)Supplemental Material
Download Zip (26.5 MB)Supplemental Material
Download Zip (17.3 MB)Acknowledgements
The authors would like to thank all participants in the fieldwork during the 2018, 2019, and 2022 seasons and those who contributed to the data processing, especially Agnieszka Ochałek, Dawid Mrocheń, and Anna Lisowska.
Disclosure Statement
No potential conflict of interest was reported by the authors.
Additional information
Funding
Notes on contributors
Kamil Kopij
Kamil Kopij (Ph.D. 2015, Jagiellonian University in Kraków) is an assistant professor at the Jagiellonian University’s Institute of Archaeology (Department of Classical Archaeology). His research interests include the archaeology of the Nabataean, Roman, and Byzantine periods in the southern Levant, spatial and acoustic analyses of public spaces, and visual propaganda. ORCID https://orcid.org/0000-0001-9937-9791.
Paweł Ćwiąkała
Paweł Ćwiąkała (Ph.D. 2011, AGH University of Kraków) is an assistant professor at the Faculty of the Geo-Data Science, Geodesy, and Environmental Engineering AGH UST. His research interests are related to the use of modern surveying technologies such as unmanned aerial vehicles, laser scanning, short-range photogrammetry, and GNSS. ORCID https://orcid.org/0000-0001-5526-0908.
Edyta Puniach
Edyta Puniach (Ph.D. 2014, AGH University of Kraków) is an assistant professor at the Faculty of the Geo-Data Science, Geodesy, and Environmental Engineering AGH UST. Her research interests include modern measurement techniques related to the monitoring of the industrial built and natural environment. ORCID https://orcid.org/0000-0003-0607-0432.
Grzegorz Sochacki
Grzegorz Sochacki (MA 2023, Jagiellonian University in Kraków). His research interests include Roman numismatics and Roman and Byzantine ceramology.
Łukasz Miszk
Łukasz Miszk (Ph.D. 2021, Jagiellonian University in Kraków) is an assistant in the Jagiellonian University’s Institute of Archaeology (Department of Classical Archaeology). His research interests focus on the archaeology of Hellenistic and Roman Cyprus and the southern Levant (especially urban issues) and modern methods of field documentation. ORCID https://orcid.org/0000-0002-5774-4647.
Jarosław Bodzek
Jarosław Bodzek (Ph.D. 1998, Jagiellonian University in Kraków) is a professor at the Jagiellonian University’s Institute of Archaeology (Department of Classical Archaeology). His research focuses on Roman and Achaemenid numismatics and the archaeology of the Hellenistic and Roman periods in the southern Levant. ORCID https://orcid.org/0000-0002-4272-4117.
Notes
1 Article (26/a/1) of the Antiquities Law of the Hashemite Kingdom of Jordan reads: “whoever excavated for antiquities without obtaining a license under the provisions of this law, shall be punished by imprisonment for no less than one year and not exceeding three years, and a fine of no less than three thousand dinars, and in proportion to antiquities’ value” (cf. Abu Issa and Alwerikat Citation2023, 478).
2 For example, a passerby once stopped while driving through the site and mentioned that a mosaic had been discovered at the site but was destroyed due to the presence of gold underneath. While we maintain skepticism regarding the authenticity of this account, it does illustrate the mindset of the diggers.
3 https://dosweb.dos.gov.jo/category/unemployment-rate/. Accessed 8.12.2022.
4 https://www.unicef.org/jordan/youth. Accessed 8.12.2022.
5 Cf. https://followthepotsproject.org/fifa/. Accessed 12.12.2022.
6 See also https://youtu.be/HHGN8FJTv8Y.
7 Also at-Tuwāna, et/at-Twâne, eth-Thuwâneh, MEGA Number 9824; JADIS 2101004. GPS coordinates: 30.7494, 35.7242.
8 See also a compilation of images of all looting pits, available at https://doi.org/10.5281/zenodo.10158666.
9 The possibility of such a use for Google Earth has already been signaled by Myers (Myers Citation2010, 9). In practice, meanwhile, the method has already been used to analyze looting activity in Syrian Apamea but on a much smaller time scale (1–2 years) (Tapete, Cigna, and Donoghue Citation2016; Agapiou Citation2020) than in our study. The Parcak study (Parcak Citation2015; Parcak et al. Citation2016) is closer to ours, although it deals with sites with very different characteristics than Tūwāneh.
Bibliography
- AAAS. 2015. “Ancient History, Modern Destruction: Assessing the Current Status of Syria’s World Heritage Sites Using High-Resolution Satellite Imagery.” https://www.aaas.org/sites/default/files/content_files/AAAS-SyrianWHS-9182014.pdf.
- Abu Issa, H. and N. Alwerikat. 2023. “Illegal Archaeological Excavation Crime in Jordanian Law.” World Archaeology. https://doi.org/10.1080/00438243.2023.2196959.
- Agapiou, A. 2020. “Detecting Looting Activity Through Earth Observation Multi-Temporal Analysis Over the Archaeological Site of Apamea (Syria) During 2011–2012.” Journal of Computer Applications in Archaeology 3 (1): 219–37. https://doi.org/10.5334/jcaa.56.
- Al-Bqain, F., G. J. Corbett, and E. Khamis. 2015. “An Umayyad Era Mosque and Desert Waystation from Wadi Shīreh, Southern Jordan.” Journal of Islamic Archaeology, https://doi.org/10.1558/jia.v2i1.26940.
- Al-Houdalieh, S. H. 2014. “Vandalised and Looted, Rock-Cut Tombs of the Roman and Byzantine Periods: A Case Study from Saffa Village, Ramallah Province.” Palestine Exploration Quarterly 146 (3): 224–40. https://doi.org/10.1179/0031032814Z.000000000102.
- Al-Manaser, A., and Y. Atal. 2020. “Looting of Antiquities in Jordan: A General Overview.” Adumatu 42: 1–36.
- Albright, W. F. 1924. “The Archaeological Results of an Expedition to Moab and the Dead Sea.” Bulletin of the American Schools of Oriental Research 14 (1): 2–12. https://doi.org/10.2307/1355401.
- Alcock, S. E., and A. R. Knodell. 2012. “Landscapes North of Petra: The Petra Area and Wādī Silaysil Survey (Brown University Petra Archaeological Project, 2010-2011).” In Proceedings of the Seminar for Arabian Studies Vol. 42, Supplement: The Nabataeans in Focus: Current Archaeological Research at Petra. Papers from the Special Session of the Seminar for Arabian Studies Held on 29 July 2011, 42:5–15. Oxford: Archaeopress.
- Atwood, R. 2006. Stealing History: Tomb Raiders, Smugglers, and the Looting of the Ancient World. New York: MacMillan.
- Banks, R. 2016. “Endangered Archaeology as Captured with the Aerial Archaeology in Jordan Project: September 2016 Season.” https://eamena.org/article/endangered-archaeology-captured-aerial-archaeology-jordan-project-september-2016-season.
- Bodzek, J., K. Kopij, and Ł Miszk. 2019. “Threats to Cultural Heritage and Its Protection in Jordan - Three Case Studies.” Wiadomości Konserwatorskie - Journal of Heritage Conservation 57: 38–49. https://doi.org/10.17425/WK57JORDAN.
- Bodzek, J., K. Kopij, Ł Miszk, P. Ćwiąkała, E. Puniach, M. Kajzer, S. Jellonek, A. Ochałek, D. Mrocheń, A, Głowacka and M. Bernaś. 2022. “Preliminary Report on the Research of the JU Institute of Archeology and the AGH UST Faculty of Geo-Data Science, Geodesy, and Environmental Engineering at the Dajaniya and Tuwaneh Sites in Jordan – Seasons 2018-2019.” Acta Archaeologica Lodziensia 68: 17–37. https://doi.org/10.26485/AAL/2022/68/2.
- Bodzek, J., K. Kopij, Ł. Miszk, P. Ćwiąkała, E. Puniach, M. Kajzer, A. Ochałek, D. Mrocheń, A. Słodowska, K. Sawicka, K. Widuch, H. Dec, M. Bernaś and A. Wójscik. 2019. “Results of ‘Archaeological Study of Dajaniya & Tuwaneh’ (ArTu: Dtu) 2018 Survey in Tuwaneh (Tafila-Hesa), Southern Jordan.” In Discovering Edom: Polish Archaeological Activity in Southern Jordan, edited by P. Kołodziejczyk, 69–85. Kraków: Wydawnictwo Profil-Archeo Magdalena Dzięgielewska; Euclid Foundation for Science Popularization; Institute of Archaeology, Jagiellonian University. https://doi.org/10.33547/discedom2019.04.
- Bowen, E. F. W., B. B. Tofel, S. H. Parcak, and R. Granger. 2017. “Algorithmic Identification of Looted Archaeological Sites from Space.” Frontiers in ICT 4: 4. https://doi.org/10.3389/fict.2017.00004.
- Brodie, N., and D. A. Contreras. 2012. “The Economics of the Looted Archaeological Site of Bâb Edh-Dhrâ’: A View from Google Earth.” In All The Kings Horses: Looting, Antiquities Trafficking and the Integrity of the Archaeological Record, edited by P. K. Lazrus, and A. W. Barker, 9–24. Washington: Society for American Archaeology.
- Casana, J. 2014. “Regional-Scale Archaeological Remote Sensing in the Age of Big Data.” Advances in Archaeological Practice 2 (3): 222–33. https://doi.org/10.7183/2326-3768.2.3.222.
- Casana, J. 2015. “Satellite Imagery-Based Analysis of Archaeological Looting in Syria.” Near Eastern Archaeology 78 (3): 142–52. https://doi.org/10.5615/neareastarch.78.3.0142.
- Casana, J. 2020. “Global-Scale Archaeological Prospection Using CORONA Satellite Imagery: Automated, Crowd-Sourced, and Expert-Led Approaches.” Journal of Field Archaeology 45 (sup1): S89–100. https://doi.org/10.1080/00934690.2020.1713285.
- Casana, J., and M. Panahipour. 2014. “Satellite-Based Monitoring of Looting and Damage to Archaeological Sites in Syria.” Journal of Eastern Mediterranean Archaeology and Heritage Studies 2 (2): 128–51. https://doi.org/10.5325/jeasmedarcherstu.2.2.0128.
- Chapman, J. 1994. “Destruction of a Common Heritage: The Archaeology of War in Croatia, Bosnia and Hercegovina.” Antiquity 68 (258): 120–26. https://doi.org/10.1017/S0003598X00046251.
- Chiovenda, M. Kerr. 2014. “Sacred Blasphemy: Global and Local Views of the Destruction of the Bamyan Buddha Statues in Afghanistan.” Journal of Muslim Minority Affairs 34 (4): 410–24. https://doi.org/10.1080/13602004.2014.984904.
- Contreras, D. A. 2010. “Huaqueros and Remote Sensing Imagery: Assessing Looting Damage in the Virú Valley, Peru.” Antiquity 84 (324): 544–55. https://doi.org/10.1017/S0003598X0006676X.
- Contreras, D. A., and N. Brodie. 2010a. “Shining Light on Looting: Using Google Earth to Quantify Damage and Raise Public Awareness.” The SAA Archaeological Record, no. May: 30–33. http://eprints.gla.ac.uk/66746/.
- Contreras, D. A., and N. Brodie. 2010b. “The Utility of Publicly-Available Satellite Imagery for Investigating Looting of Archaeological Sites in Jordan.” Journal of Field Archaeology 35 (1): 101–14. https://doi.org/10.1179/009346910X12707320296838.
- Cuneo, A., S. Penacho, L. Barnes Gordon, K. Franklin, T. Paulette, D. Elitzer, and E. Van Gessel. 2015. “Update on the Situation in Palmyra.” ASOR Cultural Heritage Initiatives. 2015. http://www.asor-syrianheritage.org/wp-content/uploads/2015/09/Palmyra_UpdateReport_FINAL.pdf.
- Danti, M., S. Branting, and S. Penacho. 2017. “The American Schools of Oriental Research Cultural Heritage Initiatives: Monitoring Cultural Heritage in Syria and Northern Iraq by Geospatial Imagery.” Geosciences (Switzerland) 7 (4): 1–21. https://doi.org/10.3390/geosciences7040095.
- Desmarais, F. (ed.). 2015. Countering Illicit Traffic in Cultural Goods. The Global Challenge of Protecting the World’s Heritage. Edited by F. Desmarais. Paris: ICOM. https://www.obs-traffic.museum/sites/default/files/ressources/files/Book_observatory_illicit_traffic_versionissuu.pdf.
- Dolinka, B. J. 2007. “Rujm Taba Archaeological Project (RTAP).” 2007. https://home.gwu.edu/~amsii/wadiarabaproject/rujmtaba.htm.
- Fiema, Z. T. 1993. “Tuwaneh and the via Nova Traiana in Southern Jordan: A Short Notice on the 1992 Season.” Annual of the Department of Antiquities of Jordan 37: 549–50.
- Fiema, Z. T. 1997. “At-Tuwana - the Development and Decline of a Classical Town in Southern Jordan (with a Note on the Site Preservation).” Studies in the History and Archaeology of Jordan VI: 313–16.
- Findlater, G., M. El-Najjar, A.-H. Al-Shiyab, M. O’]Hea, and E. Easthaugh. 1998. “The Wadi Faynan Project: The South Cemetery Excavation, Jordan 1996: A Preliminary Report George.” Levant, 69–83.
- Fisher, M., M. Fradley, P. Flohr, B. Rouhani, and F. Simi. 2021. “Ethical Considerations for Remote Sensing and Open Data in Relation to the Endangered Archaeology in the Middle East and North Africa Project.” Archaeological Prospection 28 (3): 279–92. https://doi.org/10.1002/arp.1816.
- Gebel, H. G. K. Georg K., H. M. Mahasneh, P. Keilholz, and J. Baumgarten. 2011. “Life at the Edge: Sepulchral, Hydraulic and Pastoral Land Use in Wadis as-Sahab Al-Abyadand Al-Asmar, South-Eastern Jordan: Preliminary Report on the Fourth Season of the Eastern Jafr Joint Archaeological Project, 2010.” Annual of the Department of Antiquities of Jordan 55: 537–59. https://publication.doa.gov.jo/Publications/ViewChapterPublic/510.
- Goldin, M. 2004. “Grave Robbers Ransack Holy Land History.” NBC News. 2004. https://www.nbcnews.com/id/wbna6718151.
- Hardy, S. A. 2016. “‘Black Archaeology’ in Eastern Europe: Metal Detecting, Illicit Trafficking of Cultural Objects, and ‘Legal Nihilism’ in Belarus, Poland, Russia, and Ukraine.” Public Archaeology 15 (4): 214–37. https://doi.org/10.1080/14655187.2017.1410050.
- Kankpeyeng, B. W., and C. R. DeCorse. 2004. “Ghana’s Vanishing Past: Development, Antiquities, and the Destruction of the Archaeological Record.” African Archaeological Review 21 (2): 89–128. https://doi.org/10.1023/B:AARR.0000030786.24067.19.
- Kersel, M. M. 2007a. “The Trade in Palestinian Antiquities.” Jerusalem Quarterly 33: 21–38.
- Kersel, M. M. 2007b. “Transcending Borders: Objects on the Move.” Archaeologies 3 (2): 81–98. https://doi.org/10.1007/s11759-007-9013-0.
- Kersel, M. M. 2012. “Vandalism.” In The Oxford Companion To Archaeology (2 Ed.), edited by N. A. Silberman, 339–342. Oxford: Oxford University Press.
- Kersel, M. M. 2018. “Itinerant Objects: The Legal Lives of Levantine Artifacts.” In The Social Archaeology of the Levant: From Prehistory to the Present, edited by A. Yasur-Landau, E. H. Cline, and Y. Rowan, 594–612. Cambridge: Cambridge University Press. https://doi.org/10.1017/9781316661468.034.
- Kersel, M. M., and M. S. Chesson. 2013. “Looting Matters: Early Bronze Age Cemeteries of Jordan’s Southeast Dead Sea Plain in the Past and Present.” In The Oxford Handbook of the Archaeology of Death and Burial, edited by L. N. Stutz and S. Tarlow, 677–694. Oxford: Oxford University Press. https://doi.org/10.1093/oxfordhb/9780199569069.013.0038.
- Kersel, M. M., M. S. Chesson, and A. Hill. 2021. “When Biblically Inspired Pseudoscience and Clickbait Cause Looting.” Sapiens. 2021. https://www.sapiens.org/archaeology/tall-el-hammam/.
- Kersel, M. M., and P. Gerstenblith. 2023. “Disrupting the Trade: A Legal Approach to Countering Trafficking in Archaeological Artifacts in the MENA Region.” The Journal of Art Crime 29 (July): 3–13.
- Kersel, M. M., and A. Hill. 2019. “The (W)Hole Picture: Responses to a Looted Landscape.” International Journal of Cultural Property 26 (3): 305–29. https://doi.org/10.1017/S0940739119000195.
- Kersel, M. M., and A. Hill. 2020. “Databases, Drones, Diggers, and Diplomacy: The Jordanian Request for a US Cultural Property Bilateral Agreement.” Journal of Field Archaeology 45 (sup1): S101–10. https://doi.org/10.1080/00934690.2020.1713282.
- Knodell, A. R., and S. E. Alcock. 2011. “Brown University Petra Archaeological Project: The 2010 Petra Area and Wadi Sulaysil Survey.” Annual of the Department of Antiquities of Jordan 55: 489–508.
- Lasaponara, R., and N. Masini. 2018. “Space-Based Identification of Archaeological Illegal Excavations and a New Automatic Method for Looting Feature Extraction in Desert Areas.” Surveys in Geophysics 39 (6): 1323–46. https://doi.org/10.1007/s10712-018-9480-4.
- Lauricella, A., J. Cannon, S. Branting, and E. Hammer. 2017. “Semi-Automated Detection of Looting in Afghanistan Using Multispectral Imagery and Principal Component Analysis.” Antiquity 91 (359): 1344–55. https://doi.org/10.15184/aqy.2017.90.
- MacDonald, B. 1984. “A Nabataean and/or Roman Military Monitoring Zone Along the South Bank of the Wadi El Ḥasā in Southern Jordan.” Echos Du Monde Classique: Classical Views 28 (2): 219–34.
- MacDonald, B., L. G. Herr, M. P. Neeley, T. Gagos, K. Moumani, and M. Rockman. 2004. The Tafila-Busayra Archaeological Survey 1999-2001, West-Central Jordan. Boston: American Schools of Oriental Research.
- Mackenzie, S., and T. Davis. 2014. “Temple Looting in Cambodia: Anatomy of a Statue Trafficking Network.” British Journal of Criminology 54 (5): 722–40. https://doi.org/10.1093/bjc/azu038.
- Makowska, A., A. Oniszczuk, and M. Sabaciński. 2016. “Some Remarks on the Stormy Relationship Between the Detectorists and Archaeological Heritage in Poland.” Open Archaeology 2 (1): 171–81. https://doi.org/10.1515/opar-2016-0013.
- McCreery, D. W. 1996. “A Salvage Operation at Bab Adh-Dhra`.” Annual of the Department of Antiquities of Jordan 40: 51–62.
- Myers, A. 2010. “Fieldwork in the Age of Digital Reproduction: A Review of the Potentials and Limitations.” The SAA Archaeological Record, no. September: 7–11.
- Najjar, M. 2001. “As-Safi and Fifa – Al-Karak District.” Munjazāt Department of Antiquities 38.
- Parcak, S. H. 2009. Satellite Remote Sensing for Archaeology. Satellite Remote Sensing for Archaeology. London and New York: Routledge. https://doi.org/10.4324/9780203881460.
- Parcak, S. H. 2015. “Archaeological Looting in Egypt: A Geospatial View (Case Studies from Saqqara, Lisht, and El Hibeh).” Near Eastern Archaeology 78 (3): 132–223. https://doi.org/10.5615/neareastarch.78.3.0196.
- Parcak, S. H., D. Gathings, C. Childs, G. Mumford, and E. Cline. 2016. “Satellite Evidence of Archaeological Site Looting in Egypt: 2002–2013.” Antiquity 90 (349): 188–205. https://doi.org/10.15184/aqy.2016.1.
- Politis, K. D. 1998. “Rescue Excavations in the Nabatean Cemetery at Khirbat Qazone.” Annual of the Department of Antiquities of Jordan 42: 611–14.
- Politis, K. D. 2001. “Dealing with the Dealers and Tomb Robbers: The Realities of the Archaeology of the Ghor Es-Safi in Jordan.” In Illicit Antiquities: The Theft of Culture and the Extinction of Archaeology, edited by N. Brodie, and K. W. Tubb, 257–67. London and New York: Routledge.
- Rast, W. E., and R. T. Schaub. 1990. Final Report on the Excavations at Fifa. Washington: National Endowment for the Humanities.
- Rast, W. E., R. T. Schaub, J. Donahue, M. A. McConaughy, and D. W. McCreery. 1980. “Preliminary Report of the 1979 Expedition to the Dead Sea Plain, Jordan.” Bulletin of the American Schools of Oriental Research 240: 21–61. https://doi.org/10.2307/1356536.
- Rayne, L., N. Sheldrick, and J. Nikolaus. 2017. “Endangered Archaeology in Libya: Recording Damage and Destruction.” Libyan Studies 48 (August): 23–49. https://doi.org/10.1017/lis.2017.7.
- Rodríguez Temiño, I., and A. Roma Valdés. 2015. “Fighting Against the Archaeological Looting and the Illicit Trade of Antiquities in Spain.” International Journal of Cultural Property 22 (1): 111–30. https://doi.org/10.1017/s094073911500003x.
- Rose, J. S., and D. L. Burke. 2004. “Making Money from Buried Treasure.” Culture Without Context 14: 4–8.
- Sampson, A. 2020. “Wadi Sharara Excavations, 2011.” In Ancient Landscapes of Zoara I. Surveys and Excavations at the Ghor as-Safi in Jordan, 1997–2018, edited by K. D. Politis, 63–67. London: Routledge. https://doi.org/10.4324/9781003108696-9.
- Sheftel, A. 2012. “Looting History: An Analysis of the Illicit Antiquities Trade in Israel.” Journal of Art Crime 7: 28–37.
- Shelbourn, C. 2014. “Improving the Treatment of Proceedings: Towards a Better Heritage Offences.” In Heritage Crime: Progress, Prospects and Prevention, edited by L. Grove and S. Thomas, 188–205. London: Palgrave Macmillan. https://doi.org/10.1057/9781137357519_11.
- Sinibaldi, M., and C. A. Tuttle. 2011. “The Brown University Petra Archaeological Project: 2010 Excavations At Islamic Bayḍā.” Annual of the Department of Antiquities of Jordan 55: 431–50.
- Staley, D. P. 1993. “St. Lawrence Island’s Subsistence Diggers: A New Perspective on Human Effects on Archaeological Sites.” Journal of Field Archaeology 20 (3): 347–55. https://doi.org/10.1179/009346978791489817.
- Stone, E. C., and P. Zimansky. 1992. “Special Report: Mesopotamia in the Aftermath of the Gulf War.” Archaeology Magazine 45 (3): 24.
- Tapete, D., and F. Cigna. 2019. “Detection of Archaeological Looting from Space: Methods, Achievements and Challenges.” Remote Sensing 11 (20): 2389. https://doi.org/10.3390/rs11202389.
- Tapete, D., F. Cigna, and D. N. M. Donoghue. 2016. “‘Looting Marks’ in Space-Borne SAR Imagery: Measuring Rates of Archaeological Looting in Apamea (Syria) with TerraSAR-X Staring Spotlight.” Remote Sensing of Environment 178: 42–58. https://doi.org/10.1016/j.rse.2016.02.055.
- Tapete, D., A. Traviglia, E. Delpozzo, and F. Cigna. 2021. “Regional-Scale Systematic Mapping of Archaeological Mounds and Detection of Looting Using Cosmo-Skymed High Resolution DEM and Satellite Imagery.” Remote Sensing 13: 16. https://doi.org/10.3390/rs13163106.
- Taruvinga, P., and W. Ndoro. 2003. “The Vandalism of the Domboshava Rock Painting Site, Zimbabwe: Some Reflections on Approaches to Heritage Management.” Conservation and Management of Archaeological Sites 6 (1): 3–10. https://doi.org/10.1179/135050303793137983.
- Ur, J. 2006. “Google Earth and Archaeology.” SAA Archaeological Record 6: 35–38. https://scholar.harvard.edu/jasonur/publications/google-earth-and-archaeology.
- Urban, T. M., S. E. Alcock, and C. A. Tuttle. 2012. “Virtual Discoveries at a Wonder of the World: Geophysical Investigations and Ancient Plumbing at Petra, Jordan.” Antiquity 86 (331). http://www.antiquity.ac.uk/projgall/urban331/.
- Urban, T. M., C. Vella, E. Bocancea, C. A. Tuttle, and S. E. Alcock. 2014. “A Geophysical Investigation of a Newly Discovered Early Bronze Age Site Near Petra, Jordan.” Journal of Archaeological Science 42 (1): 260–72. https://doi.org/10.1016/j.jas.2013.11.017.
- Vella, C., E. Bocancea, T. M. Urban, A. R. Knodell, C. A. Tuttle, and S. E. Alcock. 2015. “Looting and Vandalism Around a World Heritage Site: Documenting Modern Damage to Archaeological Heritage in Petra’s Hinterland.” Journal of Field Archaeology 40), https://doi.org/10.1179/0093469015Z.000000000119.
- Yáñez, A. 2016. “Illegal Detectorism and Archaeological Heritage: Criminal and Administrative Punitive Systems in Spain.” Open Archaeology 2 (1): 417–25. https://doi.org/10.1515/opar-2016-0030.