
Abstract
In this article, mass transfer during leaching of starch and protein from potato using water as the solvent was investigated. Leaching experiments were carried out by immersion of slab-shaped potato samples in distilled water at 30°C, 45°C, and 55°C, and amounts of starch and protein loss, and moisture gain by the samples were evaluated at different process duration times. A two-parameter model was proposed for prediction of the kinetics of mass transfer and also estimation of the final equilibrium values of solutes loss and moisture gain by the samples. Effective diffusivities of solutes and moisture were estimated by fitting the experimental data of solute loss and moisture gain to the analytical solution of Fick's second law of diffusion. Moisture, starch, and protein distributions into the potatoes were predicted as a function of time and location into the samples. Mean relative errors (MREs) between the predicted concentrations by the proposed models and experimental data were in the ranges of 0.037–0.104 and 0.063–0.205 for the two-parameter model and the analytical solution, respectively. Estimated equilibrium solute losses were between 0.922 and 1.549 (g/100 g fresh fruit) for protein and between 10.893 and 11.848 (g/100 g fresh fruit) for starch. Also equilibrium water gain (WG) was in the range of 35.842–46.296 (g/100 g fresh fruit). Effective diffusivities were estimated in the range of 1.334–1.817 × 10⁻¹⁰ m2/s for moisture and 1.070–1.893 × 10⁻¹⁰ m2/s for solutes.
Introduction
Potato, one of the most important tuber crops grown in the world, can be consumed in different forms, either fresh as table stock or processed into various products. Potato contains 13%–37% dry matter, 13%–30% carbohydrates, 0.7%–4.6% proteins, 0.02%–0.96% lipids, and about 0.44% ash (Liu et al., Citation2009). Most of the dry matter of a potato tuber consists of starch granules. Up to 85%–87% of the dry matter of potato (about 19% ± 5.5% of potato) consists of this typical carbohydrate (Grommers and Van der Krogt, Citation2009; Vasanthan et al., Citation1999). Starch is a valuable ingredient in the production of food, and has been widely used as thickener, colloidal stabilizer, gelling agent, bulking agent, water retention agent, and adhesive in industry (Grommers and Van der Krogt, Citation2009; Han et al., Citation2009). The starch consists of two macromolecular components: amylose (21%–25%) and amylopectin (75%–79%). Physicochemical properties of potato and its starch are influenced by amylose and amylopectin content, molecular weight, chain length, and its distribution (Grommers and Van der Krogt, Citation2009; Liu et al., Citation2009).
Potato starch has unique properties compared to other cereal starches. Some of the unique physico-chemical properties of potato starch are: low gelatinization temperature, high paste consistency (Grommers and Van der Krogt, Citation2009), and its capacity to form clear gels during gelatinization (Adebowale et al., Citation2005; Alvani et al., Citation2011; Singh et al., Citation2009). Also large granule size, purity, relatively long amylose and amylopectin chain lengths, specific viscosity behavior, and ability to form thick visco-elastic gels are other properties of potato starch (Vasanthan et al., Citation1999).
Protein is the second most important product from potato, which is present in the extract of soaked potatoes. Potato fruit water (PFW) is a dilute by-product from the potato starch industry that contains about 5% dry matter. About one-third of the dry matter is protein, peptides, and amino acids/amides (Løkra et al., Citation2008). Potato is a proper source of protein for many people in the world who are allergic to other sources of protein such as foods with egg, gluten, soy, fish, and nuts (Løkra et al., Citation2008).
The leaching (solvent extraction) of a substance from a solid material with the aid of a liquid is a common process in chemical and food engineering, which can be applied to appropriate biological, inorganic, and organic substances. This process can also be used for recovering valuable compounds from waste residues (Chan et al., Citation2014). In conventional solvent extraction, the solid sample is immersed in a solvent and the extract is collected after attainment of the final equilibrium condition (Chan et al., Citation2014). Examples of leaching include the removal of copper and gold from their ores by sulfuric acid and sodium cyanide solutions, the removal of sugar from sugar beet using hot water, the extraction of oils from seeds using organic solvents such as hexane, acetone, or ether (Treybal, Citation1981), and extraction of solutes from foodstuffs by soaking in water (Mestdagh et al., Citation2008). In the present study, starch and protein are extracted by immersion of sliced potato samples in distilled water.
Numerous theoretical and experimental studies have been carried out on water uptake by foodstuffs (Cunningham et al., Citation2007, Citation2008; Yildirim et al., Citation2011) or solute extraction from natural sources (Hojnik et al., Citation2008; Radha krishnan et al., Citation2013; Pedreschi et al., Citation2009; Seikova et al., Citation2004). Most of the researches deal with developing differential equations based on Fick's second law of diffusion and solving them by analytical or numerical methods.
Azuara et al. (1992) proposed a simple two-parameter model, based on mass balance equations, for the modeling of mass transfer in osmotic dehydration (OD) of foodstuff and the estimation of the final equilibrium water loss and solute gain in this process. OD is a water-removal process, which is based on the immersion of pieces of fresh fruits or vegetables in a solution with a higher osmotic pressure, and hence lower water activity than the food. For fruits, sugar solutions, and for vegetables, solutions of salts are mainly used (Brennan, Citation1994). This process involves simultaneous counter-current water diffusion from the food to the solution and solute diffusion into the food, under the influence of osmotic pressure. The two-parameter model, proposed by Azuara et al. (Citation1992), is able to predict the kinetics of the osmotic process and the equilibrium point, using the data obtained during a relatively short period of dehydration time. Since the mechanism of mass transfer in OD and leaching is similar to each other, this model is expected to be applicable to the prediction of kinetics of mass transfer in the leaching process. Indeed in leaching and OD processes, water and solute diffuse within the solid, but in reverse directions. In the OD process water is extracted from the solid, while in the leaching process solute is extracted from the material and water is absorbed. These phenomena occur because of the differences between chemical potentials of the solute and water in the solid and solution. Both solute and moisture transfers in the soaking process are affected by operating parameters such as temperature and contacting time, and also matrix properties of the cellular material (Chan et al., Citation2014; İspir and Toğrul, Citation2009; Shi and Maguer, Citation2003).
The main objectives of the present study were to predict the mass transfer kinetics during leaching of starch and protein from potato, using water as the solvent, and propose a mathematical model for the prediction of concentration distributions into potato as a function of time. The two-parameter model, developed by Azuara et al. (Citation1992) for OD process, was extended to the leaching process to obtain the final equilibrium values of solute loss and moisture gain by the potato, and thus finding the possibility of applying it to this process.
Theory
Prediction of Kinetics of Mass Transfer and Final Equilibrium Solute Loss and Water Gain
Leaching process was carried out by the immersion of sliced potato samples in distilled water. This process involves simultaneous counter-current solute diffusion from, and moisture diffusion into, the potato samples. Applying a mass balance on solute transfer inside the potato sample gives the fraction of the solute lost by the material during the leaching process at time t, by knowing the final equilibrium solute loss of the sample:
Here SL and SL∞ are the fraction of solute loss (g/100 g) at time t and at final equilibrium condition (t → ∞), respectively, and SS is the fraction of solute that can diffuse out but remains in the material at time t. Since SL increases on decreasing the value of SS, it can be concluded that these two parameters are related to each other by a parameter, K, as follows (Azuara et al., Citation1992):
As mentioned earlier, the rate of solid loss (SL) depends on operating conditions such as time, temperature, and concentration of the leaching solvent. Since the leaching process is carried out at constant temperature and solution concentration, it could be assumed that K is a simple function of time as follows:
Equation (4) can be rearranged in the following linear form:
Two parameters SL∞ and S1 can be obtained by fitting the experimental data of t/SLt versus t to the linear Equation (5), and then finding the slope and intercept of the fitted line.
Similar equations can be derived for water gain (WG) by the foodstuff as follows:
Here, WG and WG∞ are WG (g/100 g) at time t and at equilibrium point (t → ∞), respectively. Parameters SL∞ and S2 can be obtained by fitting the experimental data of t/WGt versus t to the linear Equation (7).
The main advantage of Azuara's model is its capacity to predict the equilibrium values. The disadvantage of Azuara's model is its limited validity within the experimental range for which the parameters of the model were obtained. Also, this method doesn't provide any information about the moisture and solute effective diffusivities (Ochoa-Martinez et al., Citation2007).
Estimation of Solutes and Moisture Effective Diffusivities
We consider an infinite slab-shaped potato sample with finite thickness of 2 l, initially at a uniform concentration of C0. At t = 0 the solid material is immersed in a solvent with a constant concentration (high solution to solid mass ratio). It is assumed that the thermophysical properties of the material are constant. Also, constant equilibrium moisture and solute concentrations at the surface (negligible external resistance to mass transfer) of the material are considered. In these conditions, the unsteady-state one-dimensional mass transfer in the solid material can be described by Fick's second law of diffusion (Crank, Citation1975):
In which the dimensionless parameters are defined by
Analytical solution of Fick's second law Equation (12) can be obtained by using the separation of variables method (Crank, Citation1975):
Average dimensionless concentration as a function of time can be obtained by using the following definition:
Substitution of Equation (17) into Equation (18) gives the average dimensionless concentration as follows:
Average dimensionless concentration, , could be defined in terms of solute loss and WG as follows:
Comparing Equations (19)–(21) with Equations (4) and (6) gives
Solutes and moisture effective diffusivities could be obtained by fitting the experimental data of solute loss and WG to Equations (24) and (25) with at least the first ten terms of their series, using the nonlinear regression method.
Materials and Methods
Materials
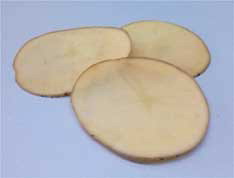
Potatoes were purchased from a specified market in Rasht, situated in the north of Iran. This market was chosen as the single place of supplying further potatoes, in order to maximize the reproducibility of results. After washing and drying with absorbent tissue paper, the potatoes were kept in a plastic bag in a refrigerator at 4°C for more than 24 h before experimentation to equilibrate the moisture content. The potatoes were removed from the refrigerator and left to equilibrate at room temperature. They were then cut into disks using a laboratory-scale slicer, without removing the skin, so that only the cut surfaces were available for mass transfer and thus to ensure the assumption of infinite slab geometry (Figure ). Both the thicknesses and diameters of the potato samples were measured at 10 points, using a micrometer of ±0.02 mm accuracy. To ensure the homogeneity of the samples, slices with the average thickness of 1.5 ± 0.2 mm and average diameter of 6 ± 0.1 cm were chosen for the experiments.
Fig. 1 Picture of potato samples.
Apparatus
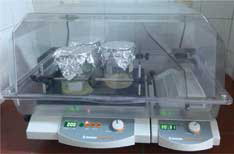
Leaching process was carried out in sealed glass containers inserted into a temperature- and agitation-controlled shaker incubator (model: Heidolph UNIMA × 1010, Germany). Picture of the experimental apparatus is shown in Figure . Experiments were conducted at the three temperatures of 30°C, 45°C, and 55°C. For all of the experiments, sample to solvent ratio of 1:20 (w/w) and agitation condition of 160 shakes per minute were used and maintained constant. In each experiment, after attainment of the steady temperature, a potato sample of known weight was immersed in the solvent. Leaching process was allowed to proceed for a process duration time between 0 and 4 h (i.e., 20, 40, 60, 90, 120, 180, and 240 min) under constant conditions. The sample was removed from the solution at the end of the extraction duration time, rinsed and blotted using blotting paper, to eliminate the surface moisture and starch, and then was weighed. After that, it was analyzed for its moisture and solute contents. Extraction experiments at different conditions were replicated and the average values were taken. The reported results are from average values of the three replications. Seven duration times were considered for obtaining a meaningful curve at each temperature. Also because experiments were carried out in triplicate, 21 samples were used for each dehydration curve. Therefore for whole of the figures at the three temperatures, 63 samples were used.
Fig. 2 Picture of the experimental apparatus.
Analysis
The moisture content of the potato samples after the leaching process was obtained by drying the samples using the oven method, according to AOAC (Citation1990). The initial weight of the dry matter in the potatoes was 23.52 ± 0.54 (g/100 g).
Total amount of extracted solid was determined by drying 10 ml of the extracting solvent in the electric oven. The amount of extracted protein from the potato samples was measured by analyzing 10 ml of the solution in a Cary 50 Bio UV-Visible spectrophotometer (model: Varian Australia, certified/evaluated to CSA 1010-1 UL 3101-1), and reading its absorbance value at 540 nm, according to the biuret and spectrophotometric method (Gornall et al., Citation1949; Jezek et al., Citation2000; Løkra et al., Citation2009).
Total amount of the extracted starch was determined by subtraction of the amount of extracted protein from the total extracted solid (total SL by the potato sample). It should be noted that the amount of extracted starch is much more than the other extracted solids. Total SL and WG by the potato samples were calculated by the following equations:
in which m0 and S0 are the initial weights of potato sample and its dry solid (g), respectively, and mt and St are the weights of the sample and its dry solid after leaching process duration time of t.
Results and Discussion
The Kinetics of Solute Loss and Moisture Gain
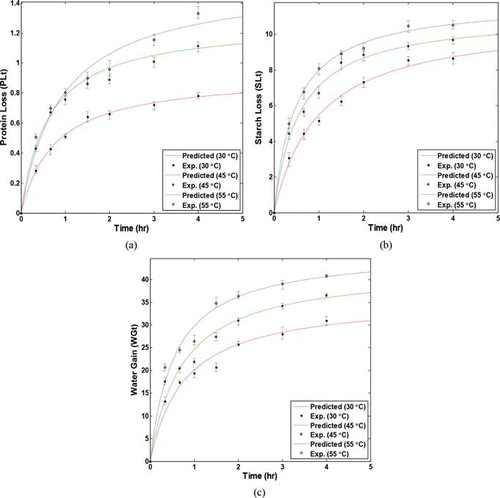
In order to check the applicability of the two-parameter model (Equations (4) and (6)) to the leaching process, the predictions of the proposed model are compared with the experimental data. Figures (a)–3(c) show variations of solutes loss and moisture gain during the leaching process at the three temperatures of 30°C, 45°C, and 55°C, respectively. The figures show a good agreement between the predictions of the two-parameter model and the experimental data. As can be seen in these figures, SL and WG increased rapidly at the early stages of the process and then increased slowly and reached their final equilibrium values at the final stages of leaching. The final equilibrium value for each component could be obtained by continuing and extrapolating its mass transfer kinetic curve. The figures show that most of mass transfer occurs at the first hour of the process. This phenomenon could be explained by the reduction in driving force of mass transfer, caused by water uptake and solute extraction with the progression of time. Also, removal or absorption of components can change the structure and compaction of the sample, which may increase the resistance to mass transfer (Singh et al., Citation2007). Results show that the solute transfer from the slices is less than their moisture diffusion. Also the figures show that the rate of mass transfer (slope of the SL and moisture gain curves) increased on increasing the temperature. This fact could be explained by decreasing the viscosity of the water, swelling and plasticizing, and destruction of the cell membrane structure with increasing temperature (Abbasi Souraki et al., Citation2012; Eren and Kaymak-Ertekin, Citation2007). Similar results have also been reported by other researchers on the effect of the different parameters on the OD of fruits and vegetables (Cheevitsopon and Noomhorm, Citation2011; Eren and Kaymak-Ertekin, Citation2007; Khazaei and Mohammadi, Citation2009; Lenart and Flink, Citation1984; Pedreschi et al., Citation2009; Rakotondramasy-Rabesiaka et al., Citation2010).
Fig. 3 Comparison between predicted (a) protein loss, (b) starch loss, (c) water gain, by the two-parameter model and experimental data at different temperatures.
Final equilibrium values of solutes loss and moisture gain were estimated from the slopes of plots of t/SL and t/WG versus time according to Equations (5) and (7), respectively. Figures (a)–4(c), respectively, show the typical plots for obtaining the final equilibrium protein loss, starch loss, and WG. The obtained equilibrium values, at different temperatures, and also S1 and S2 parameters for moisture gain, protein, and starch loss are given in Table . The table shows that the equilibrium values increase on increasing the temperature.
Fig. 4 Typical plots of the two-parameter model for estimation of equilibrium values of (a) protein loss, (b) starch loss, and (c) water gain.
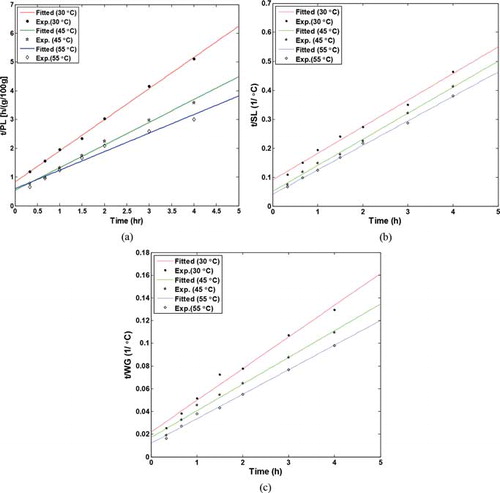
Table I. Equilibrium solute loss and water gain (g/100 g), S1, and S2 (h−1) at different temperatures
Effective Diffusivities of Solutes and Moisture in Potato
Moisture and solute effective diffusivities were estimated by fitting the experimental moisture loss and solute gain data, to the first 10 terms of the Fourier series Equations (24) and (25) by using nonlinear regression analysis. The nonlinear regression analysis was performed using the curve fitting toolbox (cftool) of the MATLAB (Version 7.6.0.324; R2008a) software. The goodness of fit was determined by various statistical parameters such as coefficient of correlation, R2, and root mean square error (RMSE) values. The predicted values of moisture and solute diffusivities are given in Table . The effective diffusivity values ranged from 1.070 × 10⁻¹⁰ to 1.893 × 10⁻¹⁰ (m2/s). These values are in agreement with the literature values for diffusivities of solutes and moisture in foodstuff (Califano and Calvelo, Citation1983; Doulia et al., Citation2000; Mujumdar, Citation1995; Varzakas et al., Citation2005; Zhao and Kjeld Porsdal, Citation1988; Zogzas et al., Citation1996).
Table II. Effective diffusivities of moisture and solute in the leaching process at different temperatures
Comparison of the Models
Figures (a)–5(c) show the comparison between predicted dimensionless concentrations of starch, water, and protein, respectively, by the analytical model, the two-parameter model, and the experimental data. As shown in these figures, model predictions in different temperatures are very close to each other, because, as shown in Table , the values of diffusivities are very close to each other at different temperatures. The figures show a good agreement between the models’ predictions and experimental data. As can be seen in the figures, although both the two-parameter and analytical methods’ predictions followed the general trend of the experimental data, the two-parameter model has been fitted to the experimental data better than the analytical method.
Fig. 5 Comparison between dimensionless (a) starch, (b) moisture, and (c) protein concentration predicted by the two-parameter model, analytical model, and experimental data.
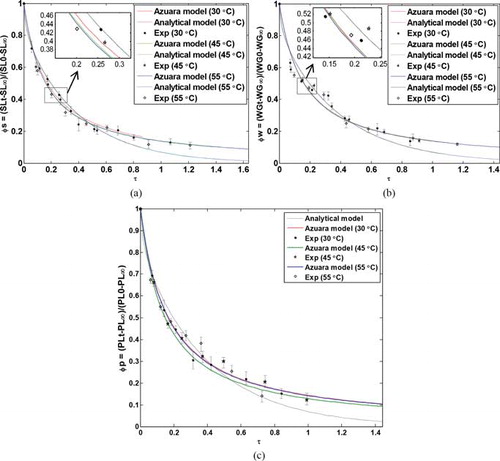
To find the precision of the models, the regression coefficient R2 and mean relative error (MRE) with respect to the experimental data were evaluated for all of the curves plotted for different components. Low values of the MRE and high values of the R2 (higher than 0.96) confirm the validity of the proposed models. Table shows that the two-parameter model is more precise than the analytical model.
Table III. Relative errors between the models and experimental data
It should be noted that the two-parameter model is an empirical model, based on mass balance on the dehydrating material, and thus based on the simpler assumptions than those for Fick's law, which is a fundamental theoretical-based model. The two-parameter model is useful for the prediction of equilibrium solute loss and moisture gain.
Solute and Moisture Distributions
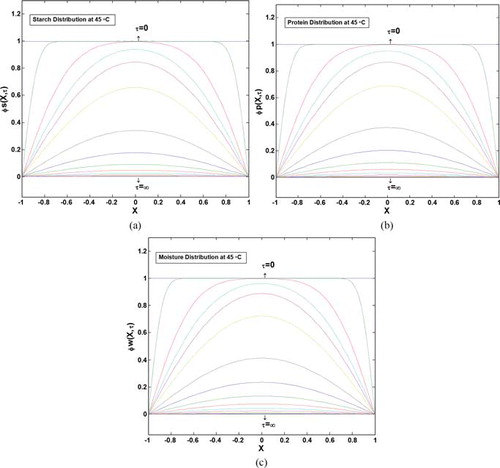
Once the predicted values of average SL and WG were found to fit approximately well to the experimental data, the simulation was extended to predict the moisture and starch distributions into the potato samples. Figures and show dimensionless starch, protein, and moisture concentrations as a function of time, and location into the samples at 45°C. Figures (a)–6(c) are the ϕ versus τ plots, with dimensionless position, x, inserted into the figures. Thus, each color in the figures is related to the variation of dimensionless concentration with dimensionless time, for a specified position into the material. Also Figures (a)–7(c) are the ϕ versus x plots, with dimensionless time, τ, inserted into the figures. Thus, each color in these figures is related to the variation of dimensionless concentration with dimensionless length from the center of the material, x, for a specified time. As shown in these figures, moisture and solute concentrations at the surface of the potato have reached the equilibrium values from the beginning of the leaching process (value of ϕ = 0 at x = 1, at all t values represent this fact), and also the center of the slab (x = 0) has the maximum value of dimensionless concentration (maximum amount of ϕ indicates the maximum distance from equilibrium). At the end of the leaching process, equilibrium condition will be established at any location into the sample (ϕ = 0 at t → ∞). It should be noted that despite the surface (x = 1) that its dimensionless concentration reaches zero, immediately at the beginning of the process, variations of the concentration at the center of the material (x = 0) are smoother that at other points; this is because the center of the potato is the farthest point from the solution, and solutes and moisture need more time to diffuse through the body structure.
Fig. 6 Dimensionless starch (a), protein (b), and moisture (c) concentration distribution inside the potato at 45°C (ϕ versus τ plots).
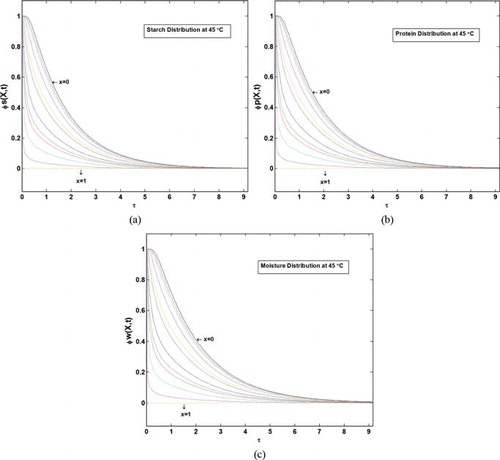
Fig. 7 Dimensionless starch (a), protein (b), and moisture (c) concentration distribution inside the potato at 45°C (ϕ versus x plots).
Conclusion
The two-parameter model proposed by Azuara et al. (Citation1992) for OD was extended to predict the mass transfer kinetics during the leaching of starch and protein from potato. SL and WG at equilibrium point were predicted at three temperatures of 30°C, 45°C, and 55°C. The two-parameter model is not capable of predicting diffusivities and concentration distributions into the potato slices by itself. Analytical solution of Fick's second law of diffusion was used for this purpose. Effective diffusivities of moisture and solutes were estimated by a combination of the proposed two-parameter model and analytical solution of Fick's second law. Distributions of dimensionless solutes and water concentrations were also plotted as functions of time and position into the potato slices. Results showed good agreement between the models’ predictions and the experimental data. High values of regression coefficient R2 and low values of mean relative errors between the models’ predictions and experimental data confirmed the applicability of the models.
Nomenclature
| C | = | Concentration (g/100 g of fresh fruit) |
| De | = | Effective diffusivity (m2/s) |
| Des | = | Effective diffusivity of solute (m2/s) |
| Dew | = | Effective moisture diffusivity (m2/s) |
| K | = | A constant related to Equation (2) |
| l | = | Half thickness of samples (m) |
| m | = | Mass (g) |
| PL | = | Protein loss (g/100 g of fresh fruit) |
| S | = | Weight of solids in the fruit (g) |
| S1 | = | A constant related to solute loss (h−1) |
| S2 | = | A constant related to moisture gain (h−1) |
| SL | = | Solute loss (g/100 g fresh fruit) |
| SS | = | Solute content (g/100 g fresh fruit) |
| t | = | Time (s) |
| WG | = | Water gain (g/100 g fresh fruit) |
| x | = | Distance from the center of the sample (m) |
| X | = | Dimensionless coordinate |
| Subscript | = | |
| 0 | = | Initial |
| E | = | Equilibrium |
| S | = | Solute |
| T | = | At the time t |
| W | = | Water |
| Greek Letters | = | |
| φ | = | Dimensionless concentration |
| τ | = | Dimensionless time (= Det/R2) |
| ∞ | = | At time ∞ (equilibrium) |
Published with license by Taylor & Francis Group, LLC © R. Hasanzadeh and B. Abbasi Souraki.
This is an Open Access article. Non-commercial re-use, distribution, and reproduction in any medium, provided the original work is properly attributed, cited, and is not altered, transformed, or built upon in any way, is permitted. The moral rights of the named author(s) have been asserted.
References
- Abbasi Souraki, B., Ghaffari, A., and Bayat, Y. (2012). Mathematical modeling of moisture and solute diffusion in the cylindrical green bean during osmotic dehydration in salt solution, Food Bioprod. Process., 90, 64–71.
- Adebowale, K. O., Olu-Owolabi, B. I., Olayinka, O. O., and Lawal, O. S. (2005). Effect of heat moisture treatment and annealing on physicochemical properties of red sorghum starch, Afr. J. Biotechnol., 4, 928–933.
- Alvani, K., Qi, X., Tester, R. F., and Snape, C. E. (2011). Physico-chemical properties of potato starches, Food Chem., 125, 958–965.
- AOAC. (1990). Official Methods of Analysis, Association of Official Analytical Chemists. 15th ed., Arlington: Association of Official Analytical Chemists, Inc., Virginia, USA.
- Azuara, E., Cortes, R., Garcia, H. S., and Beristain, C. I. (1992). Kinetic model for osmotic dehydration and its relationship with Fick's second law, Int. J. Food Sci. Technol., 27, 409–418.
- Brennan, J. G. (1994). Food Dehydration: A Dictionary and Guide, Butterworth-Heinemann Series in Food Control, Oxford, UK.
- Califano, A. N., and Calvelo, A. (1983). Heat and mass transfer during the warm water blanching of potatoes, J. Food Sci., 48(1), 220–225.
- Chan, C. H., Yusoff, R., and Ngoh, G. C. (2014). Modeling and kinetics study of conventional and assisted batch solvent extraction, Chem. Eng. Res. Des., 96, 1169–1186.
- Cheevitsopon, E., and Noomhorm, A. (2011). Kinetics of hydration and dimensional changes of brown rice, J. Food Process. Pres., 35(6), 840–849.
- Crank, J. (1975). The Mathematics of Diffusion, 2nd ed., Oxford University Press, London.
- Cunningham, S. E., McMinn, W. A. M., Magee, T. R. A., and Richardson, P. S. (2007). Modelling water absorption of pasta during soaking, J. Food Eng., 82, 600–607.
- Cunningham, S. E., Mcminn, W. A. M., Magee, T. R. A., and Richardson, P. S. (2008). Effect of processing conditions on the water absorption and texture kinetics of potato, J. Food Eng., 84, 214–223.
- Doulia, D., Tzia, K., and Gekas, V. (2000). A knowledge base for the apparent mass diffusion coefficient (Deff) of foods, Int. J. Food Prop., 3(1), 1–14.
- Eren, İ., and Kaymak-Ertekin, F. (2007). Optimization of osmotic dehydration of potato using response surface methodology, J. Food Eng., 79(1), 344–352.
- Gornall, A. G., Bardawill, C. J., and David, M. M. (1949). Determination of serum proteins by means of the biuret reaction, J. Biol. Chem., 177, 751–766.
- Grommers, H. E., and van der Krogt, D. A. (2009). Chapter 11 - potato starch: Production, modifications and uses, in: BeMiller, J. Whistler, R. (Eds.), Starch: Chemistry and Technology, 3rd ed., Academic Press, San Diego, pp. 511–539.
- Han, Z., Zeng, X. A., Yu, S. J., Zhang, B. S., and Chen, X. D. (2009). Effects of pulsed electric fields (PEF) treatment on physicochemical properties of potato starch, Innov. Food Sci. Emerg. Tech., 10, 481–485.
- Hojnik, M., Škerget, M., and Knez, Ž. (2008). Extraction of lutein from Marigold flower petals - Experimental kinetics and modelling, LWT - Food Sci. Technol., 41, 2008–2016.
- İspir, A., and Toğrul, İ. T. (2009). Osmotic dehydration of apricot: Kinetics and the effect of process parameters, Chem. Eng. Res. Des., 87, 166–180.
- Jezek, P., Costa, A. D. T., and Vercesi, A. E. (2000). Important amino acid residues of potato plant uncoupling protein (StUCP), Braz. J. Med. Biol. Res., 33, 1413–1420.
- Khazaei, J., and Mohammadi, N. (2009). Effect of temperature on hydration kinetics of sesame seeds (Sesamum indicum L.), J. Food Eng., 91(4), 542–552.
- Lenart, A., and Flink, J. M. (1984). Osmotic concentration of potato. I. Criteria for the end-point of the osmosis process, Int. J. Food Sci. Technol., 19(1), 45–63.
- Liu, Q., Donner, E., Tarn, R., Singh, J., and Chung, H.-J. (2009). Chapter 8 - advanced analytical techniques to evaluate the quality of potato and potato starch, in: Singh, J. Kaur, L. (Eds.), Advances in Potato Chemistry and Technology, Academic Press, San Diego, pp. 221–248.
- Løkra, S., Helland, M. H., Claussen, I. C., Strætkvern, K. O., and Egelandsdal, B. (2008). Chemical characterization and functional properties of a potato protein concentrate prepared by large-scale expanded bed adsorption chromatography, LWT- Food Sci. Technol., 41, 1089–1099.
- Løkra, S., Schüller, R. B., Egelandsdal, B., Engebretsen, B., and Strætkvern, K. O. (2009). Comparison of composition, enzyme activity and selected functional properties of potato proteins isolated from potato juice with two different expanded bed resins, LWT - Food Sci. Technol., 42, 906–913.
- Mestdagh, F., Wilde, T. D., Fraselle, S., Govaert, Y., Ooghe, W., Degroodt, J.-M., Verhe, R., Peteghem, C. V., and Meulenaer, B. D. (2008). Optimization of the blanching process to reduce acrylamide in fried potatoes, LWT - Food Sci. Technol., 41, 1648–1654.
- Mujumdar, A. S. (1995). Handbook of industrial drying, 2nd ed., Marcel Dekker Inc., USA.
- Ochoa-Martinez, C. I., Ramaswamy, H. S., and Ayala-Aponteet, A. A. (2007). A comparison of some mathematical models used for the prediction of mass transfer kinetics in osmotic dehydration of fruits, Dry. Technol., 25(10), 1613–1620.
- Pedreschi, F., Travisany, X., Reyes, C., Troncoso, E., and Pedreschi, R. (2009). Kinetics of extraction of reducing sugar during blanching of potato slices, J. Food Eng., 91, 443–447.
- Radha krishnan, K., Sivarajan, M., Babuskin, S., Archana, G., Azhagu Saravana Babu, P., and Sukumar, M. (2013). Kinetic modeling of spice extraction from S. aromaticum and C. cassia, J. Food Eng., 117, 326–332.
- Rakotondramasy-Rabesiaka, L., Havet, J.-L., Porte, C., and Fauduet, H. (2010). Estimation of effective diffusion and transfer rate during the protopine extraction process from Fumaria officinalis L, Sep. Purif. Technol., 76(2), 126–131.
- Seikova, I., Simeonov, E., and Ivanova, E. (2004). Protein leaching from tomato seed––experimental kinetics and prediction of effective diffusivity, J. Food Eng., 61, 165–171.
- Shi, J., and Maguer, M. L. (2003). Mass transfer in cellular material at solid–liquid contacting interface, LWT - Food Sci. Technol., 36, 3–11.
- Singh, B., Kumar, A., and Gupta, A. K. (2007). Study of mass transfer kinetics and effective diffusivity during osmotic dehydration of carrot cubes, J. Food Eng., 79, 471–480.
- Singh, J., Kaur, L., and McCarthy, O. J. (2009). Chapter 10 - potato starch and its modification, in: Singh, J. Kaur, L. (Eds.), Advances in Potato Chemistry and Technology, Academic Press, San Diego, pp. 273–318.
- Treybal, R. E. (1981). Mass Transfer Operations, 3rd ed., McGraw-Hill, Singapore.
- Varzakas, T. H., Leach, G. C., Israilides, C. J., and Arapoglou, D. (2005). Theoretical and experimental approaches towards the determination of solute effective diffusivities in foods, Enzyme Microb. Technol., 37(1), 29–41.
- Vasanthan, T., Bergthaller, W., Driedger, D., Yeung, J., and Sporns, P. (1999). Starch from Alberta potatoes: wet-isolation and some physicochemical properties. Food Res. Int., 32, 355–365.
- Yildirim, A., Öner, M. D., and Bayram, M. (2011). Fitting Fick's model to analyze water diffusion into chickpeas during soaking with ultrasound treatment, J. Food Eng., 104, 134–142.
- Zhao, Y., and Kjeld Porsdal, P. (1988). Diffusion in potato drying, J. Food Eng., 7(4), 249–262.
- Zogzas, N. P., Maroulis, Z. B., and Marinos-Kouris, D. (1996). Moisture diffusivity data compilation in foodstuffs, Dry. Technol., 14(10), 2225–2253.