
 ?Mathematical formulae have been encoded as MathML and are displayed in this HTML version using MathJax in order to improve their display. Uncheck the box to turn MathJax off. This feature requires Javascript. Click on a formula to zoom.
Abstract
Aqueous biphasic systems (ABS) based on ethyl lactate are novel green solvent systems that are biorenewable and biodegradable with the potential to replace currently used hazardous organic solvents. Models to correlate and predict binodal curves of these systems are crucial for the design of separation processes but are currently nonexistent. Here, we report the development of two empirical models based on Merchuk’s equation and the Effective Excluded Volume model for ABS composed of ethyl lactate, water and a salt (K3PO4, K2HPO4, K2CO3, Na3C6H5O7, Na2C4H4O6, Na2C4H4O4, K2S2O3, Na2S2O3 and (NH4)2S2O3). Additionally, the use of Artificial Neural Networks (ANN) as a tool to predict binodal curves was explored. An ANN composed of tansig transfer function and five neurons was built using three inputs: mole fraction of salt, molar Gibbs energy of hydration of the salt cation and anion. Furthermore, Fourier-transform infrared-attenuated total reflection spectroscopy was used to reveal the molecular interactions which were used to explain binodal data.
Introduction
In the last decade, biopharmaceuticals such as therapeutic proteins, drugs and antibodies have been increasingly used to improve the treatment of many diseases thanks to remarkable advances in their production technologies (upstream processes). Although the global biopharmaceutical market was valued at approximately USD 325 billion in 2020 and is expected to rise to USD 497 billion in 2026 (Biopharmaceuticals market Citation2021), their production costs remain much higher than those of traditional pharmaceuticals because of the high costs of purification methods (downstream processes). Due to their very low concentrations in aqueous solutions, biopharmaceuticals are predominately purified by packed-bed chromatography, but their utilization at a large scale is limited due to the high cost of resins, buffers and other consumables. In addition, the method suffers from long cycle times, hysteresis, resin compression and edge effects, which results in unpredictable flow distribution, low separation efficiency and pressure drops (Rosa et al. Citation2010). Several alternatives have been suggested in the literature, including flocculation, precipitation, membrane filtration and solvent extraction. As a form of solvent extraction, aqueous biphasic systems have attracted particular attention due to their easy scalability, capacity for continuous operation, and high extraction yields (Iqbal et al. Citation2016).
Most reported aqueous biphasic systems (ABS) are formed by adding a phase-forming solvent to an aqueous solution of organic or inorganic salt. A phase-forming solvent can be a polymer [e.g., polyethylene glycol (PEG)], various ionic liquids, short-chain alcohol (e.g., ethanol, propanol, butanol), etc. ABSs can also be formed with two polymers, such as PEG and dextran. In addition, the presence of surfactants was reported to enhance the formation of two phases (Batista et al. Citation2021). Compared to traditional organic solvent/water extractions, both phases in ABS are rich in water, providing a suitable environment for biologically active substances (Banik et al. Citation2003; Sun et al. Citation2012) and extraction of different compounds such as metals (Khayati and Mohamadian Citation2016; Ferreira et al. Citation2021), alkaloids (Pereira et al. Citation2013], dyes and pesticides (Oke and Ijardar Citation2021), phenolic compounds (Xu et al. Citation2021], etc.
Recently, new ABS based on ethyl lactate and salts emerged as an efficient tool to recover biomolecules such as antibiotics (Zakrzewska et al. Citation2021], amino acids (Kamalanathan et al. Citation2018a), antioxidants and flavonoids (Velho et al. Citation2020) from their aqueous solutions. Ethyl lactate is an environmentally friendly solvent produced from biorenewable chemicals, ethanol and lactic acid. Thus, it is identified as a green solvent in the GlaxoSmithKline (GSK) solvent selection guide (Henderson et al. Citation2011) with many attractive properties. It possesses low volatility and viscosity, is biodegradable and is not corrosive or carcinogenic. Due to its very low toxicity, ethyl lactate has been approved by the U.S. Food and Drug Administration (FDA) as generally recognized as safe for direct addition to food for human consumption (FDA, Title 21, 2020).
The ability to correlate and predict the phase equilibria behavior is important for the design of ABS based on ethyl lactate. Previously, various empirical equations have been proposed to mathematically describe experimental binodal data of aqueous biphasic systems based on polymers and ionic liquids.
The most widely used correlation for aqueous two-phase systems based on polymers and ionic liquids is Merchuk’s equation (Merchuk et al. Citation1998):
(1)
(1)
where wsol and wsalt are the mass fractions of phase-forming solvent (such as polymer, ionic liquid, alcohol, ethyl lactate) and salt, respectively, while A, B and C are adjustable parameters and D and E are exponents. For biphasic systems based on polymers and ionic liquids, exponents D and E widely used in the literature are 0.50 and 3, respectively (Alvarez-Guerra et al. Citation2016). Recently, Velho et al. Citation2021 have used Merchuk’s equation with these exponents to fit experimental binodal data for the ternary mixtures composed of ethyl lactate, water and three inorganic salts (NH4)2SO4, K2HPO4 and NaH2PO4. The authors concluded that these exponents were unsuitable for describing the experimental data for any of the studied systems. Therefore, optimizing exponents D and E for aqueous biphasic systems based on ethyl lactate is important.
Various other versions of Merchuk’s equation have been proposed in the literature (Li et al. Citation2014; Alvarez-Guerra et al. Citation2016). As an example, one of them uses only two adjustable parameters (A and B):
(2)
(2)
Guan et al. Citation1993 proposed a binodal curve model based on statistical geometry using the concept of the effective excluded volume (EEV) for aqueous biphasic systems based on two polymers:
(3)
(3)
where
Msalt and Msol, are the scaled EEV of the salt, the volume fraction of unfilled available volume after tight packing of the salt molecules into the network of an aqueous solution and the molar masses of phase forming solvent (polymer, ionic liquid, alcohol, ethyl lactate, etc.) and salt, respectively. This is the only binodal equation that has theoretical support but, to the best of our knowledge, has never been used to describe ABS based on ethyl lactate.
The use of the aforementioned models is important in the design of extraction processes to accurately interpolate compositions of phases when such data are not available. However, these models are not predictive and cannot be extrapolated to ABS systems containing other salts for which experimental data are not available. Furthermore, the development of predictive models is challenging because the formation of aqueous biphasic systems is governed by various intermolecular interactions, including the hydration ability of salts in the aqueous solutions as well as complex hydrogen-bonding competition between different compounds (Kamalanathan et al. Citation2018b).
One solution is the use of artificial neural networks (ANN) that have emerged as a simple modeling tool capable of predicting complex phenomena. Recently, Panerati et al. Citation2019 have reviewed the use of ANNs in various chemical engineering fields such as polymerization, oil production, battery heating, modeling, process control and catalysis. The physical and chemical properties of complex mixtures such as biodiesel were efficiently predicted using ANN (Arce et al. Citation2019). They have also been used for aqueous biphasic systems based on polymers–polyethylene glycols (Kan and Lee Citation1996) and ethylene oxide propylene oxide copolymer (Leong et al. Citation2018) with potassium phosphate. Similarly, Shahriari and Shahriari (Citation2014) employed an artificial neural network with the batch backpropagation (BBP) learning algorithm for a three-layer feed-forward network to model the formation of the ABS based on 1-butyl-3-methylimidazolium trifluoromethanesulfonate ionic liquid with a broad range of salts. A good agreement between the experimental and predicted values was achieved, with the squared correlation coefficient (r2) ranging from 0.9624 to 0.9978 for the testing data set. A much wider study involving 17449 experimental binodal data points of 171 ABS systems based on different ionic liquids and salts at different temperatures was carried out by Chen et al. (Citation2022). The authors developed the nonlinear ANN model based on group contributions, resulting in r2 of 0.9316 for the training data points.
This paper presents the development of two empirical models (EquationEquation 1(1)
(1) and Equation2
(2)
(2) ), the effective excluded volume model (EquationEquation 3
(3)
(3) ) as well as an artificial neural network to describe the formation of ABS composed of ethyl lactate, water and salt (either K3PO4, K2HPO4, K2CO3, Na3C6H5O7, Na2C4H4O6, Na2C4H4O4, K2S2O3, Na2S2O3 and (NH4)2S2O3). These salts were selected due to their ability to form aqueous biphasic systems. Furthermore, Fourier-transform infrared-attenuated total reflection (FTIR-ATR) spectroscopy was used to elucidate the molecular interactions.
Materials and methods
Materials
Chemicals used in this study, their molecular formulas, purity, CAS numbers and source are listed in . They are all used without further purification. Millipore’s Milli-Q water filtration system distilled and deionized the water used to make solutions.
Table 1. Chemicals used in this study.
An analytical balance (Mettler AT201) with stated repeatability of ± 4 × 10⁻² mg was used to prepare liquid mixtures. All compositions are given in terms of anhydrous salts.
Fourier-transform infrared—attenuated total reflection spectroscopy (FTIR-ATR)
FTIR-ATR was used to study molecular interactions in the mixtures containing ethyl lactate, water and either potassium phosphate (K3PO4), dipotassium phosphate (K2HPO4), potassium carbonate (K2CO3), trisodium citrate (Na3C6H5O7), disodium tartrate (Na2C4H4O6), disodium succinate (Na2C4H4O4), potassium thiosulfate (K2S2O3), sodium thiosulfate (Na2S2O3) or ammonium thiosulfate ((NH4)2S2O3), at 298.2 K. For each salt system, approximately 10 g of the following solutions were made gravimetrically (in mass fractions): Equation(1)(1)
(1) ternary solutions containing 0.004 salt, 0.681 ethyl lactate and 0.315 water (ethyl lactate-rich solutions); Equation(2)
(2)
(2) ternary solutions containing 0.216 salt, 0.033 ethyl lactate and 0.751 water (salt-rich solutions); Equation(3)
(3)
(3) ternary solutions containing 0.045 salt, 0.247 ethyl lactate and 0.708 water (“middle” solutions); Equation(4)
(4)
(4) binary solutions containing 0.061 salt and 0.939 water; and, Equation(5)
(5)
(5) binary solution containing 0.257 ethyl lactate and 0.743 water.
The solution masses (total 10 g) were large enough to give reproducible mass fractions of less than ± 0.0002. All the solutions were homogeneous (one-phase) systems at 298.2 K, freshly prepared and kept tightly sealed. The FTIR-ATR spectra of all solutions were recorded in the range 700–4000 cm−1 on a Perkin Elmer FTIR Frontier equipped with an ATR diamond stage. Each solution was pipetted in turn onto the ATR diamond stage for analysis, with methanol used to clean the stage between each sample. All spectra were recorded at room temperature by co-addition of 16 interferograms at a resolution of 2 cm−1 with a data point spacing of 0.964 cm−1. The spectra were corrected for the wavelength dependence of the penetration depth of the evanescent wave in ATR by using the instrument Spectrum software. The spectra were then baseline corrected at zero level and converted from transmission to absorbance using the same software. Using Origin software, all spectra were normalized to unity at the peak wavenumber of the water O–H stretching band. The peak position and full-width half maxima (FWHM) of the water O–H stretching band were determined using the Peak Analyzer feature in Origin software.
Analytical models
Binodal data of nine ternary systems containing ethyl lactate, water and salt were compiled from the literature (Kamalanathan et al. Citation2018a, Citation2018b; Zakrzewska et al. Citation2021) at 298.2 K and at atmospheric pressure, where salt is either potassium phosphate (K3PO4), dipotassium phosphate (K2HPO4), potassium carbonate (K2CO3), trisodium citrate (Na3C6H5O7), disodium tartrate (Na2C4H4O6), disodium succinate (Na2C4H4O4), potassium thiosulfate (K2S2O3), sodium thiosulfate (Na2S2O3) or ammonium thiosulfate ((NH4)2S2O3). The corresponding binodal datasets are included in Table S1 in Supplementary Material.
Binodal data for each ternary mixture were fitted with three analytical models, Merchuk’s equation (EquationEquation 1(1)
(1) ), the two-parameter equation (EquationEquation 2
(2)
(2) ) and the effective excluded volume model (EquationEquation 3
(3)
(3) ). Different values of the exponents D and E in Merchuck’s equations (EquationEquation 1
(1)
(1) ), ranging from 0.01 to 0.90 for D and 1 to 4 for E, were tested. Adjustable parameters (A, B and C) were obtained by regression of the experimental data. To compare the experimental data and data predicted by models, root mean square deviation (RMSD) and coefficient of determination (r2) were used according to EquationEquations (4)
(4)
(4) and Equation(5)
(5)
(5) .
(4)
(4)
(5)
(5)
where
and
are the experimental, calculated and mean values of the mass fraction of ethyl lactate, respectively, while N is the number of data points.
Artificial neural networks (ANN)
An artificial neural network is a modeling tool that analyses datasets, trains itself to recognize patterns in the datasets, and then establishes nonlinear relationships between the inputs and outputs. As shown in , the structure of ANN consists of three layers: input, hidden and output. The hidden layer containing several neurons is connected to inputs and outputs by adjustable weights (w), while bias (b) is used as a constant used to achieve the best fit for the given data. The nonlinearity is introduced by the transfer function in the hidden layer.
Figure 1. The architecture of an artificial neural network with three layers: input, hidden and output. Letters w and b stand for adjustable weights and bias, respectively.
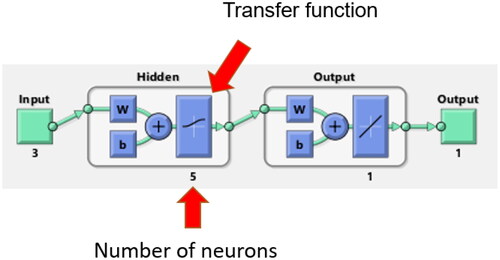
In this study, MATLAB R2020b was used to develop the ANN model to determine the input and output relationship. Its structure was optimized regarding the number of neurons and the transfer function in the hidden layer. The experimental data were split into two groups: the training and validation datasets. The training dataset included the experimental data from seven salts (K3PO4, K2HPO4, K2CO3, Na3C6H5O7, Na2C4H4O6, Na2S2O3 and (NH4)2S2O3) and 95 data points, while the validation dataset included the experimental data from two salts (K2S2O3 and Na2C4H4O4) and 23 data points. The data was split up in the way that all cations and anions were included in the training dataset. Levenberg-Marquardt Backpropagation was used as the training algorithm and a random division of 70:15:15 was used for the respective training:testing:validation. The inputs in the ANN model were the mole fraction of the salt and the molar Gibbs free energy of hydration of the salt cation and anion (), which were calculated by the model developed by Marcus Citation1991. The detailed calculations of
can be found in the Supplementary material. The mole fraction of ethyl lactate was considered as the output in the ANN model. The inputs were normalized into a range between −1 to 1 before the network training to avoid numerical overflow due to excessively large or small weights (EquationEquation 6
(6)
(6) ):
(6)
(6)
where
is the normalized parameter,
is the actual parameter,
is the minimum value of the actual parameter and
is the maximum value of the actual parameter. The outputs were not normalized.
Similar to the analytical models in Section 2.3, RMSD (EquationEquation 4(4)
(4) ) and r2 (EquationEquation 5
(5)
(5) ) were used to evaluate the quality of agreement between the experimental data and model using ANN.
Results and discussions
Modeling binodal data using analytical models
Marchuk’s equation with exponents D = 0.5 and E = 3.0 is widely applied to fit the binodal data of many different polymer-salt and ionic liquid-salt systems. This work aimed to determine more suitable exponents capable of fitting various aqueous biphasic systems based on ethyl lactate by testing a wider range of exponents and their combinations.
Tables S2 to S10 in the Supplementary materials present obtained root mean square deviation (RMSD) and coefficient of determination (r2) from fitting Merchuk’s equation (EquationEquation 1(1)
(1) ) for each set of exponents D (0.01 to 0.90) and E (1 to 4). The exponents that gave the best fittings for each system are summarized in . It can be noted that for the ternary system containing Na3citrate, the quality of the fitting is the same for the whole range of exponent D. The same trend can be observed when D values are from 0.01 to 0.02 and 0.05 to 0.20 for systems containing Na2succinate and (NH4)2S2O3, respectively.
Table 2. Exponents D and E that gave the best fitting and corresponding root mean square deviations, RMSD (EquationEquation 4(4)
(4) ) and r2 (EquationEquation 5
(5)
(5) ), obtained by fitting EquationEquation (1)
(1)
(1) to binodal data of systems containing ethyl lactate, water and salt.
The results in reveal that the best-performing exponents for the ethyl lactate-salt systems are different from those used for polymer-salt and ionic liquid-salt systems.
To find a set of exponents that are more suitable for different ethyl lactate-salt systems, the obtained average values of r2 as a function of D and E are also considered ().
Figure 2. Average coefficient of determination (r2) obtained using different exponents of Merchuk’s equation (EquationEquation 1(1)
(1) ), fitted to binodal data given in Table S1 for the systems containing ethyl lactate, water and various salts at 298 K.
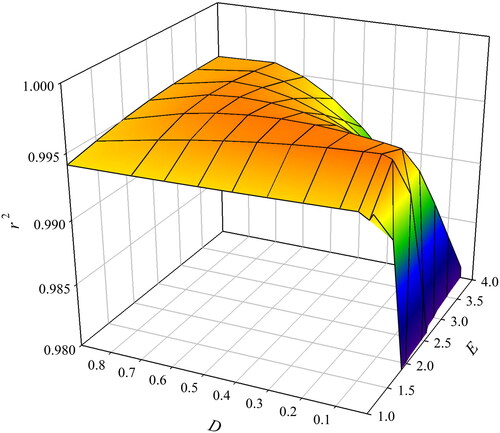
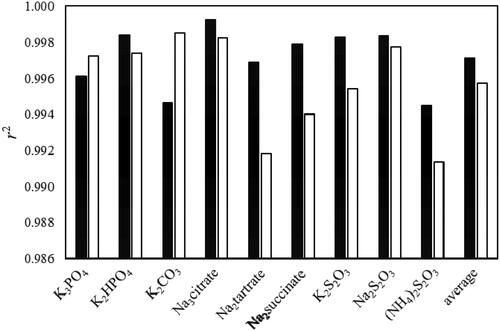
It can be concluded that the maximum value of average r2 was obtained for D = 0.05 and E = 1.5 for the nine ABS systems tested. These values are quite different from the usually used exponents of D = 0.5 and E = 3 that are widely reported in the literature for aqueous biphasic systems (ABS) based on polymers and ionic liquids. compares obtained r2 using each of these exponent sets. The average value for r2 improved from 0.9958 to 0.9971 when using the optimized exponents. However, the value for r2 was worst for ABS containing K3PO4 and a more-pronounced decrease was observed for K2CO3 when optimized exponents were used. For the other seven ABS, optimized exponents increased the r2 with the most noticeable positive effects for ABS containing Na2 tartrate, Na2 succinate and K2S2O3.
Figure 3. Comparison of coefficient of determination (r2) obtained by fitting Merchuk’s equation (EquationEquation 1(1)
(1) ) for the systems containing ethyl lactate, water and various salts system at 298 K, using two different sets of exponents: D = 0.05 and E = 1.5 (black bars) and D = 0.5 and E = 3 (white bars).
The two-parameter model given in EquationEquation (2)(2)
(2) was used to fit experimental binodal lines. The obtained parameters A and B for each system are presented in , showing an average r2 of 0.9934 and RMSD of 0.0182. Comparing these results with the ones achieved with Merchuk’s equation, it is clear that reducing the number of parameters to 2 slightly decreases the accuracy of the fitting but maintains it at an acceptable level.
Table 3. Summary of root mean square deviations (RMSD from EquationEquation 4(4)
(4) ) and coefficient of determination (r2 from EquationEquation 5
(5)
(5) ) obtained using EquationEquation (2)
(2)
(2) .
shows values for the effective excluded volumes (EEV) of the salt and volume fractions of unfilled available volume after tight packing of the salt molecules into the network of an aqueous solution obtained from the correlation of binodal data using EquationEq. (3)(3)
(3) , along with the corresponding r2 and RMSD. Based on average r2 (0.9869) and RMSD (0.0264), we can conclude that the EEV model satisfactorily correlates with the experimental binodal data, although slightly lesser than the previous two models. These results are comparable with the reported r2 of 0.9686 and RMSD of 0.0165 for ATS based on ionic liquids (Alvarez-Guerra et al. Citation2016) and r2 = 0.9829 and RMSD = 0.022 for PEG600 (Silverio et al. Citation2013).
Table 4. Summary of root mean square deviations (RMSD from EquationEquation 4(4)
(4) ) and coefficient of determination (r2 from EquationEquation (5)
(5)
(5) ) obtained using EquationEquation (3)
(3)
(3) .
It can be noted from that the volume fraction of available unfilled effective volume (f213) is very small, suggesting a very tight packing of the salt molecules into the ethyl lactate aqueous solutions. Therefore, EquationEquation (3)(3)
(3) can be fitted using only one parameter,
This possibility was tested in this work, as demonstrated in . The obtained average r2 and RMSD were 0.9415 and 0.0503, respectively. The quality of these fittings is slightly better than reported by Taghi Zafarani-Moattar and Hamzehzadeh Citation2005 for PEG6000-salt (average r2 = 0.94 and RMSD = 0.068) and for PEG2000-salt reported by Huddleston et al. Citation2003 (average r2 = 0.94) but worst than the average r2 of 0.985 observed for various polymer-polymer (PEG-Dextran) ABS (Guan et al. Citation1993).
Table 5. Summary of root mean square deviations (RMSD from EquationEquation 4(4)
(4) ) and coefficient of determination (r2 from EquationEquation 5
(5)
(5) ) obtained using EquationEquation (3)
(3)
(3) , assuming that f213 = 0.
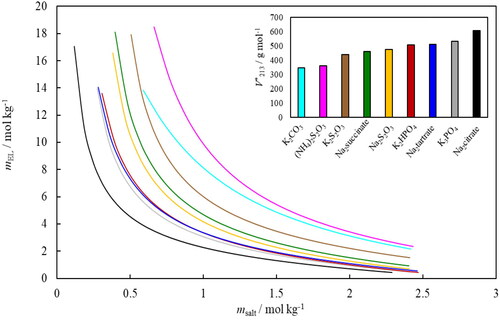
links the effectiveness of the salt in forming aqueous biphasic systems (salting-out strength of the salts) with the obtained values of from . As it can be observed, the salting-out strength of the salts follows the order: Na3citrate > K3PO4 > Na2tartrate > K2HPO4 > Na2S2O3 > Na2succinate > K2S2O3 > K2CO3 > (NH4)2S2O3. Except for the system containing (NH4)2S2O3, the same order is observed for
where a higher
value is associated with the higher salting-out ability of the salt to provoke phase splitting. This trend is also observed in the literature for ATS based on polymers (Taghi Zafarani-Moattar and Hamzehzadeh Citation2005; Huddleston et al. Citation2003; Heaton Citation2008) and ionic liquids (Alvarez-Guerra et al. Citation2016).
Figure 4. Binodal lines for the nine ABS containing ethyl lactate, water and salt (Na3citrate—black, K3PO4—grey, Na2tartrate—bark blue, K2HPO4—red, Na2S2O3—yellow, Na2succinate—green, K2S2O3—brown, (NH4)2S2O3—pink and K2CO3—light blue) obtained by fitting EquationEquation (3)(3)
(3) using constants given in , expressed in molalities (m). The insert shows the obtained values for
for each system (the same color code applies).
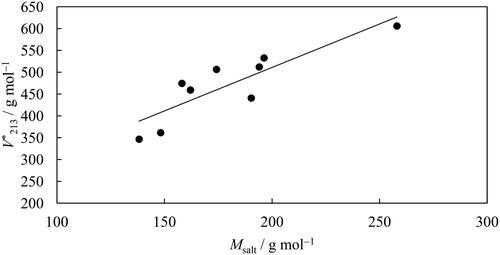
shows the values from as a function of the molecular mass of the salts examined, showing a close relationship. Other authors observed the same trend for PEG2000-salt (Huddleston et al. Citation2003) and polymer-polymer ABS (Alvarez-Guerra et al. Citation2016) but not for PEG600-salt ABS (Silverio et al. Citation2013).
Figure 5. Effective excluded volume, (), as a function of molecular masse of salt.
Modeling binodal data using artificial neural networks
Optimization of ANN architecture
The optimum ANN model was determined by varying the number of neurons and the transfer function in the hidden layer. Fifteen transfer functions provided in MATLAB were tested in this work, namely: competitive (compet), Elliot sigmoid (elliotsig), positive hard limit (hardlim), symmetric hard limit (hardlims), logarithmic sigmoid (logsig), inverse (netinv), positive linear (poslin), linear (purelin), radial basis (radbas), radial basis normalized (radbasn), positive saturating linear (satlin), symmetric saturating linear (satlins), soft max (softmax), symmetric sigmoid (tansig), and triangular basis (tribas). These fifteen transfer functions with the number of neurons between 1 and 12 were evaluated for r2 and RMSD values. shows the average RMSD for different transfer functions in the hidden layer.
Figure 6. Relationship of average RMSD and transfer functions in the hidden layer.
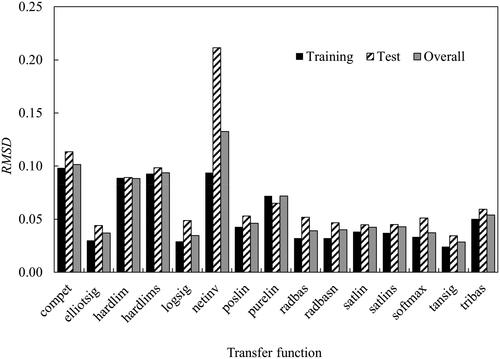
Comparing the training-test-overall performance, the ANN model with tansig as the transfer function provided the lowest RMSD values of 0.024, 0.035 and 0.028 for training, test and overall, respectively.
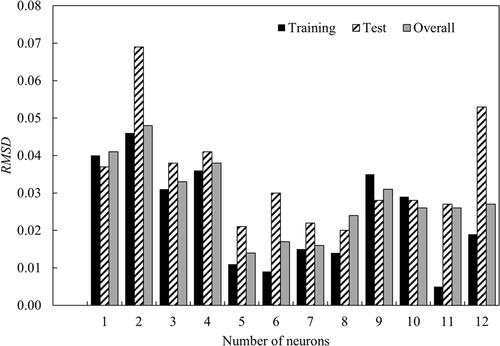
With tansig confirmed as the transfer function, the performance of the number of neurons in the hidden layer was evaluated. The relationship between RMSD and the number of neurons in the hidden layer is shown in . Five neurons in the hidden layer were chosen in the optimum architecture as it gave the lowest RMSD values of 0.011, 0.021 and 0.014 for training, test and overall, respectively. This selection also met the rule of thumb (Heaton Citation2008)—the number of hidden layer neurons (five) should be less than twice the number of neurons in the input layer (three, as presented in ).
Figure 7. Relationship of average RMSD and the number of neurons in the hidden layer.
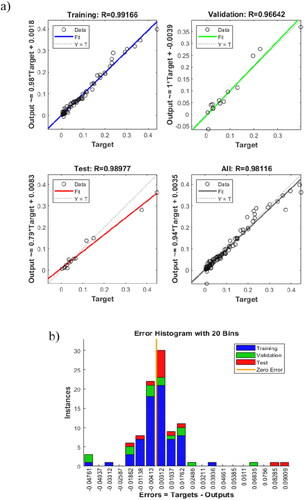
The r2 values of the ANN model with five neurons in the hidden layer and tansig as the transfer function are 0.990, 0.953 and 0.982 for training, test and overall, respectively. High r2 values indicated a good agreement between experimental and simulated values for the optimum ANN architecture.
Training of ANN model
Experimental binodal data of seven ABS containing ethyl lactate, water and either K3PO4, K2HPO4, K2CO3, Na3C6H5O7, Na2C4H4O6, Na2S2O3 or (NH4)2S2O3 were used to train the ANN model with the optimum architecture (five neurons in the hidden layer and tansig as the transfer function). The MATLAB code of the trained ANN model is provided in the Supplementary Material. From the regression figures in , it is clear that the trained ANN model had high regression values for training, validation, test and overall. It indicated a good correlation between the simulated and the experimental values. The error histogram diagram in shows a close to normal distribution, with most of the errors between 0.09 and −0.05.
Figure 8. (a) Regression of training, validation and test steps for the optimum artificial neural network architecture. (b) Error histogram diagram.
The key statistics of the ANN model are summarized in .
Table 6. Summary of the statistics of the ANN model.
Validation of ANN model
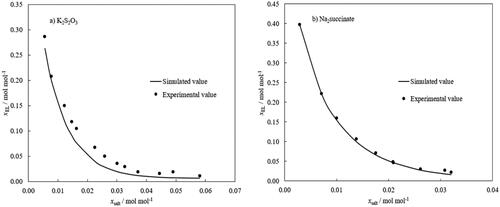
As described in the previous session, seven ABSs were used to train the model, which was subsequently used to predict the binodal lines for water-ethyl lactate-K2S2O3 and water-ethyl lactate-Na2C4H6O4 systems. For the water-ethyl lactate-K2S2O3 () system, the model underestimated the molality of ethyl lactate with a RMSD of 0.020 and r2 value of 0.975. While for the water-ethyl lactate-Na2C4H6O4 () system, the model gave a better prediction with a RMSD of 0.005 and r2 of 0.998. The close agreement of the simulated and experimental values highlights the accuracy of the ANN model for the estimation of the binodal lines with only the inputs of the Gibbs free energy of hydration of ions and the molar fraction of the salt.
Figure 9. Predicted binodal lines using the ANN model for (a) water-ethyl lactate-K2S2O3 system; (b) water-ethyl lactate-Na2 succinate system. The training dataset included 95 experimental data points for seven ternary systems containing different salts, K3PO4, K2HPO4, K2CO3, Na3-citrate—Na3C6H5O7, Na3-tartrate—Na2C4H4O6, Na2S2O3 and (NH4)2S2O3).
FTIR–ATR analysis of binary and ternary solutions
presents the FTIR-ATR spectra of the salt-rich ternary solutions, whilst in the Supplementary information present those for the ethyl lactate-rich ternary, middle ternary and binary solutions, respectively. In each, only the data between 2400−3800 cm−1 are displayed for clarity.
Figure 10. FTIR–ATR spectra of the salt-rich ternary solutions (Na3 citrate—black, Na2 tartrate—dark blue, Na2 succinate—green, K3PO4—grey, K2HPO4—red, K2CO3—light blue, K2S2O3—brown, Na2S2O3—yellow and (NH4)2S2O3—pink) between 2400–3800 cm−1.
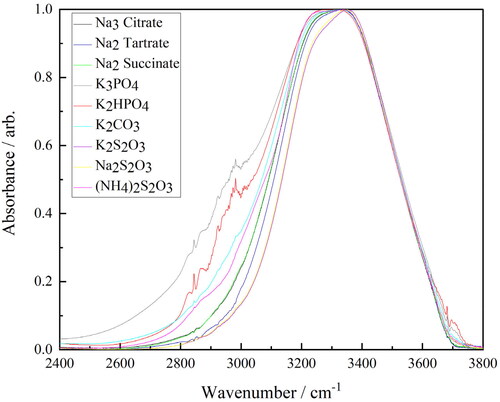
Referring to , it can be seen that there is no appreciable impact upon the O–H stretch as a result of the addition of the different salts in either the ethyl lactate-rich ternary, middle ternary or binary solutions. In Figure S1 (Supporting Material), a change is observed when comparing the ethyl lactate-rich solutions with pure ethyl lactate, but this is simply due to the higher level of water present in these solutions. Conversely, the O–H stretch is clearly significantly affected by the addition of the different salts in the salt-rich ternary solutions as can be seen in . The fact that these changes are only observed in the salt-rich ternary solutions is to be expected, as it has been shown previously that in order to interfere with the hydrogen bonding network within water sufficiently to be detected by FTIR-ATR, most salts need to be present in molar ratios of 1:25 or higher (Nickolov and Miller Citation2002). This is only the case in this study for the salt-rich ternary solutions, and therefore, the subsequent analysis focuses on this set of data specifically.
FTIR-ATR spectroscopy is used to study aqueous systems like these as it is highly sensitive to the hydrogen bonding network, which impacts the structure and order within the liquid (Nickolov et al. Citation2003; Dubouis et al. Citation2019). In pure water and on the order of the lifetime of a hydrogen bond, this structure is “ice-like”, with each water molecule connected via four hydrogen bonds to other water molecules in a tetrahedral geometry, giving rise to an O–H band centered around 3250 cm−1. The presence of any impurities within the water gives rise to a second band at a higher wavenumber, around 3400 cm−1, which corresponds to water molecules that are in a distorted geometry where the hydrogen bonding is weakened (Nickolov et al. Citation2003). The weakening of the hydrogen bonding strengthens the O–H bond hence the second band appearing at a higher wavenumber. As a result of the breadth and proximity of these two bands, the result is a single overall band, the position and breadth of which are determined by the relative amounts of “order” and “disorder” water in the solution.
As stated above, salts can interfere with the hydrogen bonding network within aqueous solutions and can do so in a “structure making” manner, where the hydrogen bonding network is enhanced, or a “structure breaking” manner, where the hydrogen bonding network is disrupted (Nickolov et al. Citation2003). In effect, this means that “structure making” salts increase the intensity of the band centered around 3200 cm−1 whilst “structure breaking” salts decrease it. The observed result is that the more “structure-making” salt is, the more the O–H band is shifted to a lower wavenumber and the greater the full-width half maxima (FWHM) of the peak.
presents the FWHM maxima of the O–H band for each salt-rich ternary solution plotted against its peak position. As expected, the general correlation of a higher FWHM and a lower peak position is observed and some clear groups amongst the salts emerge. Considering the anions, the O–H band for the thiosulfate (S2O32-) anion salts generally appear at the highest wavenumber and have the lowest FWHM suggesting that they are the least “structure making”. The carbon-containing anions citrate, tartrate, succinate and carbonate (CO32-) give rise to O–H bands at intermediate wavenumber and FWHM, suggesting that they are moderately “structure making”. Finally, the phosphorus-containing anions phosphate and hydrogen phosphate (PO43- and HPO42) result in O–H bands at the lowest wavenumbers and with the highest FWHM suggesting that they are the most structure making.
Figure 11. Full-width half maxima (FWHM) of the peak versus peak position for the O–H band in the FTIR–ATR spectra of the salt-rich ternary solutions (Na3 citrate—black, Na2 tartrate—dark blue, Na2 succinate—green, K3PO4—grey, K2HPO4—red, K2CO3—light blue, K2S2O3—brown, Na2S2O3—yellow and (NH4)2S2O3—pink).
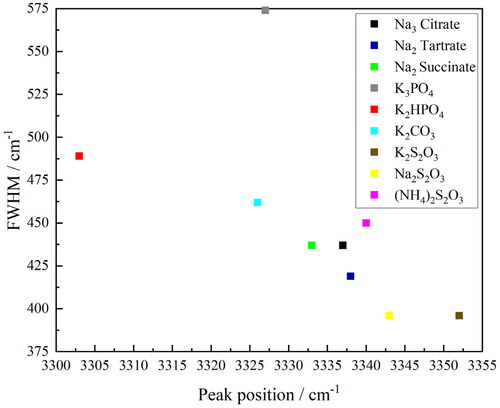
It is harder to draw any conclusions about the effect of the cation. Initially, it would appear that of potassium and sodium, it is the former that is the most “structure making” as the three most “structure making” salts all have potassium cations; however, so does the least “structure making.” The only direct comparison that can be made is between potassium thiosulfate (K2S2O3) and sodium thiosulfate (Na2S2O3), which would suggest that, in fact, sodium is the more “structure making” of the two cations, but further analysis of other comparable sodium and potassium salt pairs is needed to verify this. In addition, the ammonium thiosulfate ((NH4)2S2O3) should be considered with caution as the presence of the N–H stretch within the O–H band envelope could be impacting the results.
Using the peak position as the figure of merit for ranking these salts as “structure making” gives the following order: K2HPO4 > K2CO3 > K3PO4 > Na2 succinate > Na2 citrate > Na2 tartrate > (NH4)2S2O3 > Na2S2O3 > K2S2O3. Conversely using the FWHM as the figure of merit for the ranking gives the following order: K3PO4 > K2HPO4 > K2CO3 > (NH4)2S2O3 > Na2 succinate = Na2 citrate > Na2 tartrate > Na2S2O3 = K2S2O3. The “structure-making” nature of salts should correlate with their salting-out strength, as the more ordered the water molecules in the aqueous phase are, the more readily the organic component will separate into a separate phase. For these salts, the salting-out strength was determined in the above section and is repeated here for comparison: Na2 citrate > K3PO4 > Na2 tartrate > K2HPO4 > Na2S2O3 > Na2 succinate > K2S2O3 > K2CO3 > (NH4)2S2O3. Comparing the trends, some of the same patterns emerge, with the phosphorous-containing salts (K3PO4 and K2HPO4) being both more “structure making” and more effecting at salting-out than the thiosulfate salts ((NH4)2S2O3, Na2S2O3 and K2S2O3). However, differences also emerge as whilst the carbon-containing salts are broadly intermediary in terms of their “structure-making” ability, they show a much wider range of salting-out strengths.
Overall, this suggests that whilst the use of O–H bandwidth and position as a proxy for the “structure making” nature of salt is a useful guide in suggesting groups of salts that would be of interest for further research, there are clearly more complex factors at play that cannot be captured by as simple a technique as FTIR–ATR spectroscopy.
Conclusions
This work investigated three analytical models to describe the binodal curves of nine aqueous biphasic systems based on ethyl lactate. Exponents of Merchuk’s equation were optimized to provide better agreements with experimental data of ABS based on ethyl lactate. The results confirm that all three analytical models are suitable to be used, with the average root mean square deviation and coefficient of determination of 0.0119 and 0.9971, 0.0182 and 0.9932, 0.0264 and 0.9869, for Merchuk’s equation with optimized exponents, two-parameter exponential equation and effective excluded volume model, respectively. These models can be used for similar systems in the future to interpolate compositions of phases when such data are unavailable.
Furthermore, we have developed an artificial neuron network (ANN) capable of predicting binodal curves using the mole fraction of salt and characteristics of ions—their charges and molar Gibbs of hydrations. The optimum network structure contained five neurons and tansig as the transfer function in the hidden layer. A good agreement between experimental data and the predicted values was achieved—the average root mean square deviation was 0.2050 while the coefficient of determination was 0.9627.
FTIR–ATR spectroscopy broadly supported the model predictions in terms of the observed structure making/structure breaking nature of the different salts as determined from the position and FWHM of the O–H band; however it failed to capture all of the variations, suggesting that more complex intermolecular interactions than captured here are also at play.
Supplemental Material
Download MS Word (495.1 KB)Disclosure statement
The authors report that there are no competing interests to declare.
Additional information
Funding
References
- Alvarez-Guerra E, Ventura SPM, Alvarez-Guerra M, Coutinho JAP, Irabien A. 2016. Modeling of the binodal curve of ionic liquid/salt aqueous systems. Fluid Ph. Equilibria. 426:10–16.
- Arce PF, Guimarães DHP, de Aguirre LR. 2019. Experimental data and prediction of the physical and chemical properties of biodiesel. Chem. Eng. Commun. 206(10):1273–1285.
- Banik RM, Santhiagu A, Kanari B, Sabarinath C, Upadhyay SN. 2003. Technological aspects of extractive fermentation using aqueous two-phase systems. World J. Microbiol. Biotechnol. 19(4):337–348.
- Batista ID, do Nascimento DJS, Gandolfi ORR, dos Santos KA, Fontan RDI, Veloso CM, Bonomo P, Bonomo RCF. 2021. Influence of the presence of dioctyl sulfosuccinate sodium as adjuvant on the equilibrium data of aqueous two-phase systems formed by polyethylene glycol + potassium phosphate + water at 298.15 K. Chem. Eng. Commun. 208(11):1630–1639.
- Biopharmaceuticals market. 2021. Mordor Intelligence, Biopharmaceuticals market—Growth, trends, COVID-19 impact, and forecasts (2022–-2027). https://www.mordorintelligence.com/industry-reports/global-biopharmaceuticals-market-industry#:∼:text=The%20biopharmaceuticals%20market%20was%20valued,forecast%20period%2C%202021%2D2026., (accessed 01 March 2022)
- Chen Y, Liang X, Woodley JM, Kontogeorgis GM. 2022. Modelling study on phase equilibria behavior of ionic liquid-based aqueous biphasic systems. Chem. Eng. Sci. 247:116904.
- Dubouis N, Park C, Deschamps M, Abdelghani-Idrissi S, Kanduč M, Colin A, Salanne M, Dzubiella J, Grimaud A, Rotenberg B. 2019. Chasing aqueous biphasic systems from simple salts by exploring the LiTFSI/LiCl/H2O phase diagram. ACS Cent Sci. 5(4):640–643.
- Ferreira GMD, Hespanhol MC, da Silva LHM, Patrício PR, da Cunha RC. 2021. Elucidating mechanism for the extraction of cobalt, nickel, and iron in polymer-electrolyte aqueous biphasic systems with both phases rich in electrolyte. J. Mol. Liq. 327:114803.
- Guan Y, Lilley TH, Treffry TE. 1993. A new excluded volume theory and its application to the coexistence curves of aqueous polymer two-phase systems. Macromolecules. 26(15):3971–3979.
- Heaton J. 2008. Introduction to Neural Networks for Java, 2nd Ed, St Louis, Heaton Research, Inc.
- Henderson RK, Jiménez-González C, Constable DJC, Alston SR, Inglis GGA, Fisher G, Sherwood J, Binks SP, Curzons AD. 2011. Expanding GS’'s solvent selection guide—embedding sustainability into solvent selection starting at medicinal chemistry. Green Chem. 13(4):854–862.
- Huddleston JG, Willauer HD, Rogers RD. 2003. Phase diagram data for several PEG + salt aqueous biphasic systems at 25 °C. J Chem Eng Data. 48(5):1230–1236.
- Iqbal M, Tao Y, Xie S, Zhu Y, Chen D, Wang X, Huang L, Peng D, Sattar A, Shabbir MAB, et al. 2016. Aqueous two-phase system (ATPS): an overview and advances in its applications. Biol Proced Online. 18(18):18.
- Kamalanathan I, Canal L, Hegarty J, Najdanovic-Visak V. 2018. Partitioning of amino acids in the novel biphasic systems based on environmentally friendly ethyl lactate. Fluid Ph. Equilibria. 462:6–13.
- Kamalanathan I, Petrovski Z, Branco LC, Najdanovic-Visak V. 2018. Novel aqueous biphasic system based on ethyl lactate for sustainable separations: Phase splitting mechanism. J. Mol. Liq. 262:37–45.
- Kan P, Lee CJ. 1996. A neural network model for prediction of phase equilibria in aqueous two-phase extraction. Ind Eng Chem Res. 35(6):2015–2023.
- Khayati G, Mohamadian O. 2016. Effective extraction of Zn(II) ions using aqueous two-phase partitioning. Chem. Eng. Commun. 203(2):236–241.
- Leong YK, Chang C-K, Arumugasamy SK, Lan JC-W, Loh H-S, Muhammad D, Show PL. 2018. Statistical design of experimental and bootstrap neural network modelling approach for thermoseparating aqueous two-phase extraction of polyhydroxyalkanoates. Polymers. 10(2):132.
- Li Y, Zhang M, Wu J, Shi J, Shen C. 2014. Liquid–liquid equilibria of ionic liquid N-butylpyridinium tetrafluoroborate and disodium hydrogen phosphate/sodium chloride/sodium sulfate/ammonium sulfate aqueous two-phase systems at T = 298.15K: Experiment and correlation. Fluid Phase Equilib. 378:44–50.
- Marcus Y. 1991. Thermodynamics of solvation of ions. Part 5.—Gibbs free energy of hydration at 298.15 K. J. Chem. Soc. Faraday Trans. 87(18):2995–2999.
- Merchuk JC, Andrews BA, Asenjo JA. 1998. Aqueous two-phase systems for protein separation studies on phase inversion. J. Chromatogr. B. 711(1-2):285–293.
- Nickolov Z, Miller JD. 2002. FTIR studies of water structure in soluble salt flotation systems. paper presented at the 76th ACS Colloid and Surface Science Symposium, University of Michigan, Ann Arbor, Michigan, June 23–26, 2002.
- Nickolov Z, Ozcan O, Miller JD. 2003. FTIR analysis of water structure and its significance in the flotation of sodium carbonate and sodium bicarbonate salts. Colloids Surf. A Physicochem. Eng. Asp. 224(1–3):231–239.
- Oke EA, Ijardar SP. 2021. Insights into the separation of metals, dyes and pesticides using ionic liquid based aqueous biphasic systems. J. Mol. Liq. 334:116027.
- Panerati J, Schnellmann MA, Patience C, Beltrame G, Patience GS. 2019. Experimental methods in chemical engineering: Artificial neural networks–ANNs. Can J Chem Eng. 97(9):2372–2382.
- Pereira JF, Ventura SP, e Silva FA, Shahriari S, Freire MG, Coutinho JA. 2013. Aqueous biphasic systems composed of ionic liquids and polymers: A platform for the purification of biomolecules. Sep. Purif. Technol. 113:83–89.
- Rosa PAJ, Ferreira IF, Azevedo AM, Aires-Barros MR. 2010. Aqueous two-phase systems: A viable platform in the manufacturing of biopharmaceuticals. J Chromatogr A. 1217(16):2296–2305.
- Shahriari S, Shahriari S. 2014. Predicting ionic liquid based aqueous biphasic systems with artificial neural networks. J. Mol. Liq. 197:65–72.
- Silverio SC, Rodríguez O, Teixeira JA, Macedo EA. 2013. The effect of salts on the liquid − liquid phase equilibria of PEG600 + salt aqueous two-phase systems. J Chem Eng Data. 58(12):3528–3535.
- Sun J, Rao B, Zhang L, Shen Y, Wei D. 2012. Extraction of acetoin from fermentation broth using an acetone/phosphate aqueous two-phase system. Chem. Eng. Commun. 199(11):1492–1503.
- Taghi Zafarani-Moattar M, Hamzehzadeh S. 2005. Liquid–liquid equilibria of aqueous two-phase systems containing polyethylene glycol and sodium succinate or sodium formate. CALPHAD. 29(1):1–6.
- U.S. Food and Drug Administration, Code of Federal Regulations Title 21 https://www.accessdata.fda.gov/scripts/cdrh/cfdocs/cfCFR/CFRSearch.cfm?fr=172.515., 2020 (accessed 21 March 2022)
- Velho P, Requejo PF, Gómez E, Macedo AE. 2020. Novel ethyl lactate based ATPS for the purification of rutin and quercetin. Sep. Purif. Technol. 252:117447.
- Velho P, Requejo PF, Gómez E, Macedo EA. 2021. Thermodynamic study of ATPS involving ethyl lactate and different inorganic salts. Sep. Purif. Technol. 275:119155.
- Xu S, Zhu Q, Xu S, Yuan M, Lin X, Lin W, Qin Y, Li Y. 2021. The phase behavior of n-ethylpyridinium tetrafluoroborate and sodium-based salts ATPS and its application in 2-chlorophenol extraction. Chin. J. Chem. Eng. 33:76–82.
- Zakrzewska ME, Nunes AVM, Barot AR, Fernández-Castané A, Visak ZP, Kiatkittipong W, Najdanovic-Visak V. 2021. Extraction of antibiotics using aqueous two-phase systems based on ethyl lactate and thiosulphate salts. Fluid Phase Equilib. 539:113022.