
Abstract
A field experiment was conducted over 2 years in a semiarid region of Australia to determine the root water uptake–soil water regime relationship and water use of drip-irrigated olive (Olea europaea L.) (cv. Corregiolo). A soil water balance approach was used to estimate the olive trees' water use. Olive evapotranspiration during the first (‘on’) year was 620, 685 and 723 mm for rainfed (during pit-hardening period), deficit (during pit-hardening period) and irrigated treatments, respectively. These values were 555, 610 and 673 mm during the second (‘off’) year. Soil water monitoring in three dimensions was used to infer vertical and lateral root distribution and root activity. The soil water depletion pattern indicated that most of the roots were in the top 60 cm soil depth and aligned along the tree rows. This information is important for fertilizer application and for the placement of drip laterals and soil water measurement equipment used for irrigation scheduling. It also underscores the importance of using three-dimensional models to understand root zone hydrology of drip-irrigated trees.
Introduction
Crop evapotranspiration is an important parameter in irrigation scheduling and design. Evapotranspiration of a given crop depends on atmospheric evaporative demand and soil water availability. Since evapotranspiration of a given crop varies from region to region (Palomo et al. Citation2002), it is essential to determine its quantity under different climatic and water availability conditions. Although olive (Olea europaea L.) is traditionally grown under rainfed conditions, its intensive modern production system requires irrigation. Its water requirement has been determined in regions where olive is traditionally grown (Fernandez & Moreno Citation1999; Palomo et al. Citation2002; Moriana & Orgaz Citation2003; Tognetti et al. Citation2006). However, this information is of limited use in regions such as Australia where olive production is an emerging industry. The most common approach to calculate evapotranspiration (ET) of a given crop is the Food and Agriculture Organization's crop coefficient method (Allen et al. Citation1998). However, the variability of the crop coefficient measured at different locations makes it difficult to apply this method to locations where no experimental information exists. For fruit trees such as olive, the in-field root zone water balance of individual trees can be used (e.g. Mickelakis et al. Citation1993). Using water balance, actual crop evapotranspiration is estimated from the measurement of other components of the root zone water balance: rainfall, irrigation, deep drainage, runoff and change in soil water storage. However, it is not possible to directly measure some of these parameters. Deep drainage and runoff can be estimated using the Darcy equation and curve number method, respectively. Change in soil water storage can be measured using a neutron probe and time domain reflectometer (TDR). The use of the water balance approach in localized irrigation systems requires monitoring of soil water content in three dimensions; along and across the tree lines and at different depths (Michelakis et al. Citation1993; Palomo et al. Citation2002). This is important in order to understand how a reduced wetted soil volume under drip-irrigation system influences root distribution and water extraction.
For efficient use of fertilizer and higher crop yield, it is important to know the rate and pattern of water absorption by olive trees. Most of the studies about the response of olive trees to water availability focused only on the above-ground part of the plant (Melgar et al. Citation2008; Rousseaux et al. Citation2009). The limited studies of the below-ground part of olive trees were mainly on root distribution and root density. However, root distribution tells only a little about root activity; root activity might not always be higher in zones of higher root density. In fact, the opposite might be true as a result of a compensation mechanism (Fernandez et al. Citation1991). Dichio et al. (Citation2002) observed that olive root growth responds positively to irrigation with irrigated olives having 34% more soil volume explored by roots and 22% more root length than non-irrigated trees. In Argentina, Searles et al. (Citation2009) observed a high correlation between root distribution and soil water content in a drip-irrigated olive grove. They found that 70% of the root length density was within 0.5 m of the drip line and more than 90% was within 1 m; more than 70% of the roots were located in the top 0.5 m soil depth. Michelakis (Citation1986) and Michelakis & Vougioucalou (Citation1988) showed cv. Kalamon olive trees had three to seven times more roots at the 0–120 cm horizontal distance from the drippers compared to a distance of 120–300 cm.
Understanding root distribution and root activity is important: (1) to differentiate soil zones from which water extraction occurs; (2) to establish an appropriate model (one-, two- or three-dimensional) that enables the estimation of water and solute transport in the root zone; and (3) to select representative sites for the location of soil water sensors. This study was performed to determine olive evapotranspiration using the soil water balance method, and to assess root water extraction at different depths and distances from the tree trunk under three irrigation regimes: (1) rainfed, where the trees were not irrigated during the pit-hardening period; (2) deficit, where the trees were irrigated at 50% of the full irrigation requirement; and (3) irrigated, where the trees were irrigated to fulfil their full water requirement.
Materials and methods
Experimental site and design
The experiment was conducted during the 2010–11 and 2011–12 seasons on nine-year-old cv. Corregiolo olive trees planted at 5 × 7 m spacing at the Wagga Wagga campus of Charles Sturt University (35°03′S; 147°21′E; 235 m asl), New South Wales, Australia. A strip of about 2 m on either side of a tree row was sprayed with herbicide, while a central strip of about 1.5 m between the rows was regularly mowed short. The first year (2010–11) was an ‘on’ year with high orchard yield, whereas the second year (2011–12) was an ‘off’ year with very low yield. The soil physical characteristics are given in . The historical average annual rainfall in the area is 560 mm, fairly evenly distributed throughout the year, while the minimum and maximum evapotranspiration occurs in the months of July and January, respectively (). The mean minimum and mean maximum temperatures are in July and January, respectively. The long-term average minimum and maximum daily temperatures during the olive production period (flowering to harvest) are 11 and 25 °C, respectively.
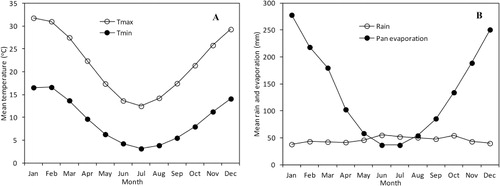
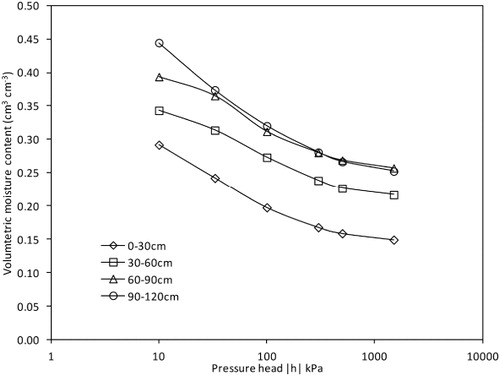
Table 1 Physical characteristics of the soil at the experimental site.
Each tree row was irrigated using two drip laterals, laid 50 cm from each side of the rows. The drippers were fitted with 60 cm spaced pressure compensating drippers discharging 2.3 L/h. The olive fruit pit-hardening period is a relatively less sensitive stage to water stress (Lavee & Wonder Citation1991; Goldhamer Citation1999; Moriana et al. 2003). Therefore, three irrigation treatments were selected based on the amount of water supplied during the pit-hardening period: rainfed, deficit and irrigated. The rainfed treatment was not irrigated during the pit-hardening period as water stress at this stage is considered to not affect olive yield significantly. Irrigated trees were irrigated to fully meet crop water demand. Deficit treatment trees were irrigated with about 50% of the amount of water applied to irrigated trees. Soil water content was monitored under a total of nine trees (i.e. three trees per treatment) to a depth of 120 cm using a neutron probe soil moisture meter calibrated at the site (Gardner & Kirkham Citation1952). A separate calibration equation was used for the top 30 cm soil layer. Under each replicated tree, there were four neutron probe access tubes. One probe was located at a distance of 75 cm from the tree row (referred to as X75) and one at a distance of 200 cm from the row (referred to as X200). The other two tubes were located across the tree rows at 75 cm (referred to as Y75) and 200 cm (referred to as Y200) from the tree trunks.
The depth of irrigation water applied during the experimental seasons is presented in . For the 2010–11 experiment, as a result of exceptionally high rainfall during the spring and early summer months, irrigation started only at the beginning of January 2011. The total amount of irrigation applied for the fully irrigated and deficit irrigated treatments was 267 and 130 mm, respectively; rainfed treatment trees were not irrigated. In the 2011–12 hydrological year, fully irrigated, deficit irrigated and rainfed treatments received 299, 211 and 123 mm, respectively.
Table 2 Amount of irrigation water applied to the three water treatments during the two experimental seasons (2010–11 and 2011–12).
Soil water balance
Water balance has been one of the most widely used methods to determine evapotranspiration of tree crops (Petillo & Castel Citation2007). Although the method has a low temporal resolution, is time consuming and laborious, it is widely used for research purposes. The value of crop evapotranspiration, ETc, (between two soil water measurements) is estimated using the following equation:
The potential maximum initial abstraction, S, was calculated from the curve number as:
The curve number, CN, is a dimensionless parameter indicating the runoff response characteristic of a surface. It is related to land use, land treatment, hydrological condition, hydrological soil group and antecedent soil water condition. In this study, hydrological soil group B (loam), average antecedent moisture condition and poor hydrologic condition (no runoff protection) were considered in selecting the curve number.
The change in soil water storage, ΔS, over a time interval, t2–t1, (days) was calculated as:
The Darcy equation was used to estimate the amount of deep percolation, DP, below the 90 cm depth as:
The water retention curve of the soil in the study site was used to determine K(θ) using the van Genuchten closed form equation (van Genuchten Citation1980):
For each θ at a given depth, the matric head, h, at that location was estimated as:
Relative extractable water
Relative extractable water (REW) is a depth equivalent of water defined as a fraction of maximum extractable water content (Granier Citation1987) expressed as:
Data analysis
Analysis of variance of the data set was performed for two representative dates during which olive water use was considered to be high (18 January 2011 and 27 January 2012). Error bars were also determined and indicated on the figures in such a way that the clarity of the figures is not compromised.
Results
Evapotranspiration
Cumulative values of the water balance components of the three irrigation treatments are presented in and . The water balance components were calculated at 2–4 week intervals and summarized seasonwise. It can be observed that there was soil water depletion during the first hydrological year (2010–11) and soil water addition during the second hydrological year (2011–12). This is also evident from the soil water profiles in . The soil water contents, both at the end of the first year (20 September 2011) and at the end of the second year (20 September 2012), were lower than the values at the beginning of the experimental period (20 September 2010). However, the soil water content at the end of the second year was higher than that at the end of the first year, indicating refilling of the root zone during the second year. The difference in evapotranspiration between the treatments was mainly during the regulated deficit irrigation period of the summer months. During this period, lower ETc was observed in the rainfed treatment than in the deficit and fully irrigated treatments. The results in indicate that annual evapotranspiration of fully irrigated olives was 723 and 673 mm for the 2010–11 and 2011–12 seasons, respectively. For the rainfed treatments, these values were 620 and 529 mm, respectively.
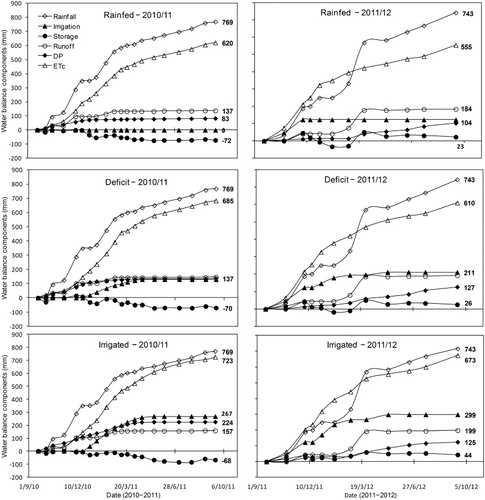
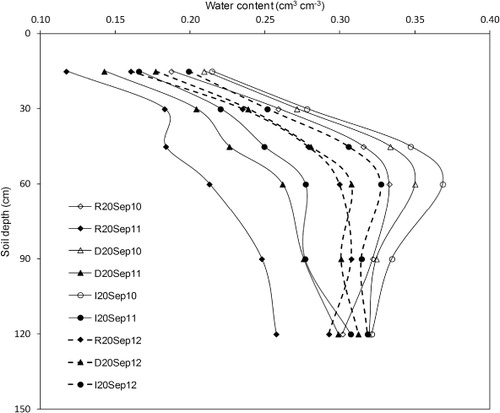
Table 3 Seasonal and annual water balance components of rainfed, deficit irrigated and fully irrigated olives during the two experimental years (2010–11 and 2011–12).
The total amount of water applied (rainfall + irrigation) during the first year was 769, 899 and 1036 mm for rainfed, deficit and irrigated treatments, respectively. In the second year, similar amounts of water (866, 954 and 1042 mm) were applied to the respective treatments. Evapotranspiration values of rainfed, deficit and irrigated treatments in the second (‘off’) year were 11%, 11% and 7% lower than the corresponding values in the first (‘on’) year. In the first year, evapotranspiration from rainfed treatments was 9% and 14% lower compared with deficit and irrigated treatments, respectively. These values were 9% and 17% in the second year. During the irrigation months, evapotranspiration in irrigated trees was higher than that in the rainfed treatment trees. These results show that in rainfed trees, ETc was limited by the low soil water content during the summer period. Lower evapotranspiration during the second (‘off’) season was not due to low water availability as more water was applied in the second year. The amount of water that was not evapotranspired was stored in the root zone at the end of the second year (). This is also evident from , where the soil water profile at the end of the first year (September 2011) was low compared with the ones at the end of the second year (September 2012). In the first year, about 28%, 32% and 37% of the water supplied (rainfall + irrigation) was lost as runoff and deep percolation in rainfed, deficit and irrigated treatments, respectively. However, in the second year there was almost no difference between the treatments in terms of the amount of water lost as runoff and deep drainage (average 33%).
Root water extraction variation with depth
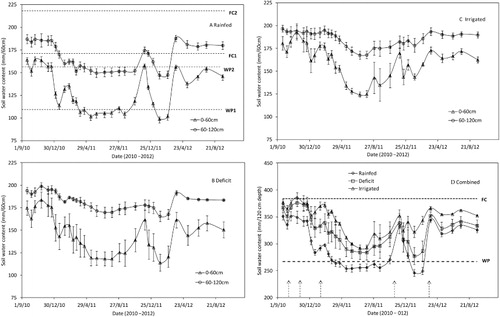
The evolution of soil water content over the two seasons in the 0–60 cm and 60–120 cm soil layers presented in . The soil water content at field capacity and permanent wilting points is also indicated on the figure. The rainfed treatment has the lowest soil water content throughout the 2 years and it was the only treatment in which the water content fell below the permanent wilting point. After high rainfall events, the difference between the soil water contents of the three treatments decreased. The soil water content trend reflected the rainfall amount during the respective seasons. For example, the below-average rainfall of autumn and winter seasons resulted in low soil water content in the autumn and winter seasons of 2011 and autumn season of 2012. The highest soil water content values for all three treatments were in the spring of 2010 and winter/spring of 2012. Although the winter rainfall of 2012 was below average, the high rainfall in the autumn resulted in high soil water content at the end of the second year. Comparison of mean water content was carried out for the period during which the crop water use was maximum. For this analysis, soil water content data of 18 January 2011 and 27 January 2012 were used. There is a significant (P < 0.05) difference between the soil water contents of the upper layer and lower layer for all three water treatments. There was no interaction effect of the soil water content and the treatments. There was also significant (P < 0.05) difference between soil water contents of the three treatments on these dates (). From , and it can be seen that the soil water content for the upper 60 cm layer was above field capacity (FC1) during the spring of 2010–11. However, the soil water content of layer 2 (60–120 cm) was lower than the field capacity (FC2). As the season progresses, the soil water content dropped below field capacity.
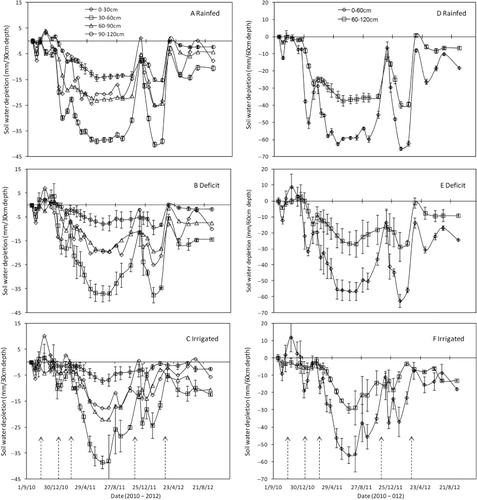
Soil water depletion relative to the water content at the beginning of the experimental period (20 September 2010) for each 30 cm soil depth is shown in . On the representative dates for the periods during which the olive tree water use was highest (18 January 2011 and 27 January 2012), there was significant difference (P < 0.05) between the water depletion when considering both 30 cm thick and 60 cm thick layers Irrespective of the water treatment, soil water depletion decreases with depth indicating no interaction effect. The highest soil water depletion was in the 30–60 cm layer (, , ) and 0–60 cm layer (, , ). The soil water depletion in the first year (2010–11) was significantly higher (P < 0.05) than in the second year (2011–12). This was in agreement with previous discussion (–; ). There seemed to be no root activity below the 90 cm depth, with most root activity being in the top 60 cm depth. Below the 60 cm depth, the soil water content remained high and almost constant. Even in 2010–11, when there was high soil water depletion, there was almost no variation in soil water content in the 90–120 cm layer.
Root water extraction variation in horizontal space
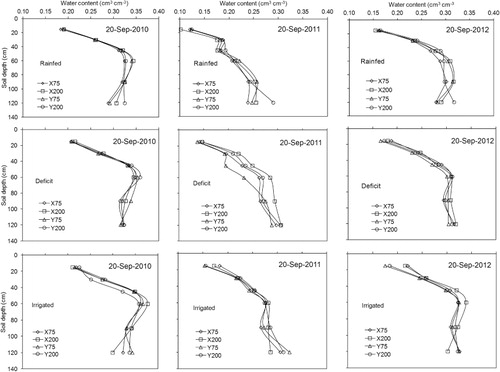
The soil zone affected and non-affected by drippers and the presence of roots was established according to differences in the soil water content profiles at different distances from the tree trunk. The soil water content at different depths and different positions from the tree trunk is shown in for the beginning, middle and end of the experimental period. The change in soil water content was relatively higher in the top 60 cm compared with the deeper layers indicating higher root activity in this layer. The soil water content at the farthest monitoring access tube in the direction of the tree row (X200) was higher than that of the other access tubes. This shows that this zone received more water compared with the positions in the y-direction (Y75 and Y200) and had fewer roots compared with the monitoring position in the same direction but closest to the tree (X75).
shows the average soil water content in the four access tubes under rainfed, deficit and irrigated treatments. The rainfed treatment shows that soil water content at Y200 was higher than that of the other monitoring positions. This was especially so in the first season during which the rainfed treatment was not irrigated. Since the drip lines are only 50 cm on either side of the tree rows, the effect of irrigation at Y200 is low. In the deficit and irrigated treatments, higher soil water content was observed at X200. This might be due to the fewer roots at X200 that received irrigation water equal to that at X75.
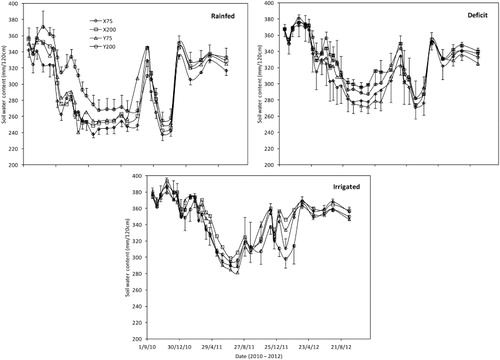
In the 120 cm soil depth monitored in this study, the highest water content reached during the experimental period was 370, 380 and 395 mm for the rainfed, deficit and irrigated treatments, respectively. In all the cases, this maximum soil water content occurred for the access tube located 200 cm from the tree trunk in the direction perpendicular to the tree rows. The lowest water content was 237 mm in all the treatments. In the rainfed treatment this occurred at X75, whereas in the deficit and irrigated treatments it occurred at Y75. The former may be due to more roots in the X direction following drip irrigation line, whereas the latter may be due to less irrigation in the Y direction. A very high amount of rainfall in early autumn 2012 refilled the soil water content in a short period. Since the evapotranspiration requirement is low in the subsequent months, the soil water content remained high. The soil water content at Y200 of the rainfed treatment was almost always the highest. This can be due to low root density at this location.
Relative extractable water
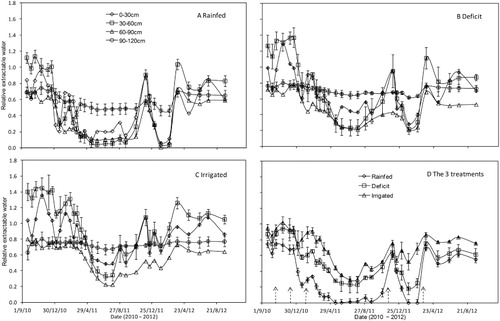
The evolution of REW during the two seasons is presented in . The REW determined on 18 January 2011 (first year experiment) indicated significant differences (P < 0.05) between the water treatments and no significant difference for soil depth. However, for the second year experiment (27 January 2012), there was significant difference (P < 0.05) for both soil depth and water treatments. REW was higher than 0.6 at the beginning of the experimental period in all the treatments although REW in the rainfed treatment was close to zero during some of the periods. For the rainfed treatment, REW was <0.3 for most of the summer of 2011 and autumn, winter and spring of 2011–12 for the top 90 cm depth. REW was below 0.3 during the early autumn of 2012. However, it was <0.5 during the winter and spring of 2012. For the deficit treatment it dropped below 0.3 only during the winter of 2010–11 and early period of 2011–12. The irrigated treatment had REW > 0.3 throughout most of the 2 years except in the autumn of 2010–11.
REW of the deepest layer (90–120 cm) is more or less constant throughout the 2 years (0.5 in rainfed, 0.6 in deficit and 0.7 in irrigated treatments). The high REW during the autumn, winter and early spring of 2012 reflects the low evapotranspiration of the olives during the ‘off’ season. The average REW over the whole root zone profile () shows that the rainfed treatment had REW < 0.3 for an extended period, whereas REW of the irrigated treatment did not drop below 0.3 at any time.
Discussion and conclusion
The water balance analysis indicates that deep drainage in the rainfed treatment was lower than that of the deficit and irrigated treatments. In addition to the fact that irrigated trees received more water, Palomo et al. (Citation2002) attributed such a phenomenon to the possibility that the rainfed trees were able to explore greater soil depths than the deficit and irrigated trees. The ETc of fully irrigated olives was 723 and 673 mm in the first (‘on’) and second (‘off’) years of the study, respectively. For the treatments not irrigated during the pit-hardening period, these values were 620 and 529 mm, respectively. The evapotranspiration values estimated in this study indicate that olive water use varies with evaporative demand and water availability. For an environment in California with reference evapotranspiration, ETo, of 1330 mm and rainfall of 533 mm, Grattan et al. (Citation2006) determined olive evapotranspiration during the irrigation season to be about 600 mm for cv. Arbequina orchards. Michelakis (Citation1990) found no significant difference in table and oil olive yield when 260–570 mm of irrigation water was applied. From a 3-year experiment in Spain, Moriana & Orgaz (Citation2003) found average ETc values of 830 and 566 mm in fully irrigated and regulated deficit irrigated olives, respectively. They attributed the big difference between the ETc values to the difference between the amounts of water applied to the treatments: 565 vs. 131 mm. Different studies conducted under different environmental conditions have reported the following evapotranspiration values: Fereres (Citation1995) (ETc = 750 mm for ETo = 1400 mm); Palomo et al. (Citation2002) (ETc = 653 mm for ETo = 1400 mm); and Tognetti et al. (Citation2006) (ETc = 552 mm for ETo = 1180 mm). A lower olive water use during the ‘off’ year can be a useful irrigation management strategy. Moriana & Orgaz (Citation2003) withheld irrigation from ‘off’ olive trees and observed that it affected the following year's (‘on’ year) performance especially if there were drought and trees experienced water stress during autumn and spring. They observed that the evapotranspiration of ‘off’ year trees was lower than that of ‘on’ year trees. However, they noted the need for more study before concluding that not-irrigating in ‘off’ year can be used as a deficit irrigation strategy.
The soil water content at deeper depths (>60 cm) was more or less constant while there was more fluctuation at shallow depths indicating that deeper layers respond to the rain/irrigation input only slowly. The observations in this study show that olive roots are not uniformly distributed throughout the soil profile. The higher depletion in the upper layers can be due to evaporation, root extraction and drainage through light textured soil. On 20-year-old cv. Manzanilla, Fernandez et al. (Citation1991) found higher values of root density in the direction of the irrigation emitters than in the direction perpendicular to the tree rows. They found maximum root activity at 0.5–0.6 m from the trunk and between 0.5 m and 1 m depth. This indicates that roots do not grow into the zone not influenced by drip irrigation. Palomo et al. (Citation2002) also recorded soil water at 0.5, 1.5, 2.5 and 3.5 m from the tree trunk for an irrigated treatment. Values of soil water close to field capacity were recorded up to 0.5 m from the trunk. At 2 m from the trunk, soil water content in the deeper layers was quite high. This difference in soil water content might be due to differences in root densities as has also been observed by Fernandez et al. (Citation1991). They measured root density at 0.5, 1.0 and 1.5 m distances from the tree trunk along the tree rows (X-direction) as 5.69 × 10⁻², 3.80 × 10⁻² and 0.78 × 10⁻² mm mm−3. Corresponding values across the tree rows (Y-direction) were 0.34 × 10⁻², 0.01 × 10⁻² and 0.01 × 10⁻² mm mm−3, respectively. The influence of localized irrigation on root distribution was also reported by Michelakis & Vougioucalou (Citation1988) for olive trees, Black & Mitchell (Citation1974) for pear trees, Willoughby & Cockroft (Citation1974) for peach trees and Huguet (Citation1976) for apple trees.
Stevens & Douglas (Citation1994) have found that grapevine roots irrigated with drip irrigation were concentrated in the direction of vine row with 50% of the vine's roots less than 45 cm out in the row compared with 35% under microjet irrigation. Levin et al. (Citation1979) found that most roots in an apple orchard in heavy clay soil were within 0.6 m of the drip line. Franco & Abrisqueta (Citation1997) found that 80% of almond roots in a silt-loam soil were within 1 m of the drip line and in the top 60 cm. Michelakis et al. (Citation1993) found that the percentage of roots of drip-irrigated avocado trees was higher in the upper 0.5 m soil layers and within 2 m from the drip line, where about 70% of the roots were located. They attributed higher root percentage in the areas close to the drip line to higher soil water content. Studies on the root distribution of olives have found that the main development of the olive root system occurs in the most superficial soil layers (Fernandez & Moreno Citation1999). Levin et al. (Citation1979) indicated that the main feature that characterizes drip irrigation of fruit trees is the limited horizontal distribution of water in the area between tree rows.
REW of 0.3–0.4 is considered a threshold of water stress for many tree species (Breda et al. Citation1995; Fernandez et al. Citation1997). If the lower threshold (0.3) is considered for olive, it can be seen that the irrigated treatment was not stressed at any time (–). Although the REW value of rainfed trees indicated significant water stress, its evapotranspiration was not equally affected (). This shows that although the soil water content in the rainfed treatment was lower than that in the irrigated treatment, the root system of rainfed trees explored a greater volume of soil than the irrigated trees, as also reported by Fernandez et al. (Citation1991).
Although it is a laborious and time-consuming exercise, the water balance method was successfully applied to determine olive evapotranspiration under three irrigation regimes. Evapotranspiration of fully irrigated mature olives in the semiarid region of Australia was 723 and 673 mm in ‘on’ and ‘off’ years, respectively. For olives not irrigated during the pit-hardening period, evapotranspiration was 620 and 555 mm in ‘on’ and ‘off’ years, respectively. The soil water extraction pattern indicated that olive roots were concentrated along the drip line and at shallow (<0.6 m) depths. These observations show the importance of having different irrigation managements in ‘on’ and ‘off’ years for perennial crops exhibiting alternative bearing.
Root distribution and root water extraction is affected by the layout of drip laterals. Placement of soil water monitoring instruments and fertilizer application in drip-irrigated horticultural trees need to take this into account. The difference in soil moisture distribution along the tree line and across the tree line indicates the importance of using three-dimensional models to understand the hydrology of drip-irrigated trees in arid and semiarid areas.
References
- Allen R, Pereira LS, Raes D, Smith M 1998. Crop evapotranspiration: guidelines for computing crop water requirements. FAO Irrigation and Drainage Paper No 56. FAO, Rome. 300 p.
- Black JD, Mitchell PD 1974. Changes in root distribution of mature pear trees in response to trickle irrigation. Proceedings of II International Drip Irrigation Congress, San Diego, CA. Pp. 437–438.
- Breda N, Granier A, Aussenac G 1995. Effects of thinning on soil and tree water relations, transpiration and growths in an oak forest (Quercus petrea (Matt.) Liebl.). Tree Physiology 15: 295–306. 10.1093/treephys/15.5.295
- Dichio B, Romano M, Nuzzo V, Xiloyannis C 2002. Soil water availability and relationship between canopy and roots in young olive trees (cv. Coratina). Acta Horticulturae 586: 255–258.
- Fereres E 1995. El riego del olivar. Proceedings of the VII Simposio Científico-Técnico Expoliva 95. Brasil, Ponencias. Pp. 18.
- Fernandez JE, Moreno F 1999. Water use by the olive tree. Journal of Crop Production 2: 101–162. 10.1300/J144v02n02_05
- Fernandez JE, Moreno F, Cabrera F, Arrue JL, Martin-Aranda J 1991. Drip irrigation, soil characteristics and the root distribution and root activity of olive trees. Plant Soil 133: 239–251. 10.1007/BF00009196
- Fernandez JE, Moreno F, Giron IF, Blazquez OM 1997. Stomatal control of water use in olive tree leaves. Plant Soil 190: 179–192. 10.1023/A:1004293026973
- Franco JA, Abrisqueta JM 1997. A comparison between minirhizotron and soil coring methods of estimating root distribution in young almond trees under trickle irrigation. Journal of Horticultural Science 72: 797–805.
- Gardner W, Kirkham D 1952. Determination of soil moisture by neutron scattering. Soil Science 73: 391–401. 10.1097/00010694-195205000-00007
- Goldhamer DA 1999. Regulated deficit irrigation for California canning olives. Acta Horticulturae 474: 373–375.
- Granier A 1987. Evaluation of transpiration in a Douglas-fir stand by means of sap flow measurements. Tree Physiology 3: 309–320. 10.1093/treephys/3.4.309
- Grattan SR, Berenguer MJ, Connell JH, Polito VS, Vossen PM 2006. Olive oil production as influenced by different quantities of applied water. Agricultural Water Management 85: 133–140. 10.1016/j.agwat.2006.04.001
- Huguet IG 1976. Influence of a localized irrigation on the rooting of young apple trees. Annals Agronomy 27: 343–361.
- Lavee S, Wodner M 1991. Factors affecting the nature of oil accumulation in fruit of olive (Olea europaea L.) cultivars. Journal of Horticultural Science 66: 583–591.
- Levin I, Assaf R, Bravdo B 1979. Soil moisture and root distribution in an apple orchard irrigated by tricklers. Plant Soil 52: 31–40. 10.1007/BF02197729
- Melgar JC, Mohamed Y, Navarro C, Parra MA, Benlloch M, Fernandez-Escobar R 2008. Long-term growth and yield responses of olive trees to different irrigation regimes. Agricultural Water Management 95: 968–972. 10.1016/j.agwat.2008.03.001
- Michelakis N 1986. Olive behaviour under various irrigation conditions. Olea 17: 207–209.
- Michelakis N 1990. Yield response of table and oil olive varieties to different water use levels under drip irrigation. Acta Horticulturae 286: 271–274.
- Michelakis N, Vougiouscalou E 1988. Water used, root and top growth of olive trees for different methods of irrigation and levels of soil water potential. Olea 19: 17–31.
- Michelakis N, Vougioucalou E, Clapaki G 1993. Water use, wetted soil volume, root distribution and yield of avocado under drip irrigation. Agricultural Water Management 24: 119–131. 10.1016/0378-3774(93)90003-S
- Moriana A, Orgaz F, Fereres E, Pastor M 2003. Yield responses of a mature olive orchard to water deficits. Journal of American Society of Horticultural Science 128: 425–431.
- Palomo MJ, Moreno F, Fernandez JE, Diaz-Espejo A, Giron IF 2002. Determining water consumption in olive orchards using the water balance approach. Agricultural Water Management 55: 15–35. 10.1016/S0378-3774(01)00182-2
- Petillo MG, Castel JR 2007. Water balance and crop coefficient estimation of a citrus orchard in Uruguay. Spanish Journal of Agricultural Research 5: 232–243. 10.5424/sjar/2007052-243
- Rousseaux MC, Figuerola PI, Correa-Tedesco G, Searles PS 2009. Seasonal variations in sap flow and soil evaporation in an olive (Olea europaea L.) grove under two irrigation regimes in an arid region of Argentina. Agricultural Water Management 96: 1037–1044. 10.1016/j.agwat.2009.02.003
- Searles PS, Saravia DA, Rousseaux MC 2009. Root length density and soil water distribution in drip-irrigated olive orchards in Argentina under arid condition. Crop & Pasture Science 60: 280–288. 10.1071/CP08135
- Soil Conservation Service 1985. Estimation of direct runoff from storm rainfall. In: National Engineering Handbook. Section 4: Hydrology. Washington, DC USDA-SCS. Chapter 10.
- Stevens BM, Douglas T 1994. Distribution of grapevine roots and salt under drip and full-ground cover microjet irrigation systems. Irrigation Science 15: 47–152. 10.1007/BF00193681
- Tognetti R, d'Andria R, Lavini A, Morell G 2006. The effect of deficit irrigation on crop yield and vegetative development of Olea europaea L. (cvs. Frantoio and Leccino). European Journal of Agronomy 25: 356–364. 10.1016/j.eja.2006.07.003
- van Genuchten MTh 1980. A closed form equation for predicting the hydraulic conductivity of unsaturated soils. Soil Science Society of America Journal 44: 892–898. 10.2136/sssaj1980.03615995004400050002x
- van Genuchten MTh, Leij FJ, Yates SR 1991. The RETC code for quantifying the hydraulic functions of unsaturated soils. Riverside, CA, U.S. Salinity Laboratory, Department of Agriculture, Agricultural Research Service. 85 p.
- Willoughby P, Cockroft B 1974. Changes in root patterns of peach trees under trickle irrigation. Proceedings II International Drip Irrigation Congress, San Diego, CA. Pp. 437–438.