
Abstract
Pseudomonas syringae pv. actinidiae (Psa) is an emerging disease of kiwifruit (Actinidia sp.). It has the potential to cause considerable production losses; therefore the ability to monitor and map the disease is important for industry-wide disease management. Using industry-collected infection data and an archived time-series of high-resolution satellite imagery, Psa disease monitoring in kiwifruit orchards was attempted for the 2010–11 growing season in the Bay of Plenty, New Zealand. Multiple vegetation indices were generated from imagery and a binomial logistic regression used to relate these vegetation indices to the Psa disease response. Results showed that the early season (2 October) photosynthetic vigour ratio was the most effective for differentiating infected and non-infected orchards. Omission and commission errors were observed, but were in part due to issues with data quality. The results were encouraging for the potential timely use of satellite imagery for monitoring and mapping Psa infections in kiwifruit.
Introduction
Pseudomonas syringae pv. actinidiae (Psa) is considered the most devastating disease of ‘green’ kiwifruit cv. Hayward (Actinidia deliciosa) (Koh et al. Citation2003). It has also been reported as a disease agent in ‘yellow’ kiwifruit (A. chinensis) (Ferrante & Scortichini Citation2009; Koh et al. Citation2010) with even more devastating effects. Recently, Psa has been isolated for the first time from New Zealand vines (Everett et al. Citation2011; Vanneste et al. Citation2011) and is starting to cause significant production losses in New Zealand.
Psa infection in Actinidia sp. proceeds in several ways (Ferrante & Scortichini Citation2009; Koh et al. Citation2010). Infection may occur on the foliage, typically in spring, leading to brown or dark irregular angular necrotic spots on the leaves. Infection within the vascular tissue may also occur leading to a characteristic oozing of rusty-red fluid from the trunk and canes that starts in late winter. The oozing may extend to buds, branch joints and scar tissue. The two different modes of infection mean that the disease may proceed in different forms and at different rates over a season.
Given that Psa is potentially so destructive to kiwifruit production and that the kiwifruit industry in New Zealand is predominantly contained within well-bounded discrete geographical regions, it is of interest to the industry to develop effective, regional-scale methods to monitor and map the disease. This information could then be used to help mitigate and manage the cost of infection.
Remote-sensing at a regional scale has previously been shown to be effective in managing economically important plant pests and diseases in other crops. For example, the Phylloxera and Grape Industry Board of South Australia has used, and continues to use, multi-spectral imagery to detect, map and manage the threat of the pest Phylloxera (Daktulosphaira vitifoliae) to South Australian viticulture production on an industry-wide scale (Phylloxera and Grape Industry Board of South Australia Citation2012). Other more local applications of the use of multi-spectral imagery for the characterisation of plant pathogens have also been reported in several different crops and ecosystems (see the reviews of West et al. Citation2003; Jones & Schofield Citation2008; Sankaran et al. Citation2010).
Remotely sensed imagery with band information in the visible to near-infrared (NIR) part of the electromagnetic spectrum (EMS) can be used for disease detection. The reflectance from leaf tissue in this part of the EMS is sensitive to changes in plant health. Information from multi-spectral imaging systems is widely available from various platforms (terrestrial, aerial and space) and, in the case of space platforms, the imagery is routinely collected and archived. There are some limitations to the use of multi-spectral imagery. The visible-NIR spectral signature of the canopy may also be affected by environmental, crop physiological and management factors (Sankaran et al. Citation2010). The intrinsic variability in kiwifruit vine growth and production at scales ranging from the sub-block (Taylor et al. Citation2007) to the regional level (Woodward & Clearwater Citation2011, Citation2012) may also pose some problems in the direct identification of Psa (or any disease) infection.
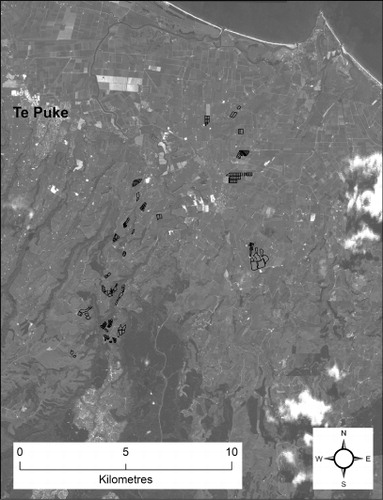
Since approaches for Psa disease mapping are poorly understood, an opportunistic study of the potential to use satellite imagery for Psa mapping and monitoring was undertaken. Existing archived satellite imagery collected in the 2010–11 growing season over Pukehina, Bay of Plenty, New Zealand, and industry-collected infection survey data from the same period were used to retrospectively assess the feasibility of multi-spectral remote sensing to detect Psa infected vines. The principal objective was to determine: (a) if a Psa disease response could be discriminated from multi-spectral imagery; (b) a preferred timing for image acquisition; and (c) the best vegetative index (or indices) for discriminating the Psa disease response.
Materials and methods
Data
Imagery
Archived multi-spectral (five-band visible-NIR) () imagery from the Rapideye satellite constellation was acquired from AAM Group (Macquarie Park, New South Wales, Australia) for 2 October 2010, 21 October 2010, 26 December 2010, 15 January 2011 and 1 February 2011. These were ortho-rectified images at a 5 m pixel resolution centred on Pukehina, New Zealand (). This pixel size approximated the general bay × row dimensions in most orchards, thus each pixel is typically a representation of a basic trellis unit. The application of remote-sensing in viticulture has shown that pixels that approximate row widths are preferred for detecting spatial patterns in vineyard-scale (or larger) studies (Lamb et al. Citation2001). Pixels in each image associated with cloud cover (based on a highly reflective response) were identified.
Table 1 Details of the band information associated with imagery acquired by the multi-spectral sensor systems mounted on the Rapideye satellites (adapted from www.rapideye.com, accessed 14 October 2013).
Vector data
Two vector layers (shapefiles) on the production system were utilised. A point file with information pertaining to the presence (or absence) of the virulent strain of Psa in orchards was made available by Kiwifruit Vine Health (KVH) Inc, Mt Manganui, New Zealand. The Psa information was recorded as the date of confirmation, i.e. date of a positive laboratory test result, not the date of collection or observation. A polygon shapefile of orchard block boundaries was also utilised from AgFirst NZ Ltd, Katikati, New Zealand. Polygons were identified by their kiwifruit property identification number (KPIN) and a block ID. Individual polygons were assigned a unique KPIN block ID (KBI).
Data processing
Reclassing the Psa response
As the Psa data were provided with a date of confirmation there is some uncertainty regarding the actual date of infection. For this study, the data were reclassified and simplified () and the analysis confined to KBIs with either an ‘early’ (infected) or ‘control’ (non-infected) response.
Table 2 Detection period of Psa infection in Pukehina showing the original classification from Kiwifruit Vine Health (KVH) Inc. and the reclassification performed for this analysis. The total number of KPINs and KBIs associated with the data are also displayed.
Derivation of vegetative indices
A 5 m grid was generated over the entire survey area and trimmed to points within orchard polygons. A 12 m buffer was then applied to remove points that were located close to an orchard boundary (within 2.5 pixels) to avoid potential errors in geo-rectification, polygon alignment or orchard effects, such as roads or windbreaks. Some small blocks had few data (<9 pixels) after this process and were omitted.
The band information from each image was extracted to the buffered 5 m point file and 12 commonly used vegetative indices (VIs) were derived (). These were the simple ratio (SR), normalised difference vegetative index (NDVI), green NDVI (GNDVI), red-edge NDVI (NDRE), modified NDRE (ModNDRE), enhanced vegetative index (EVI), enhanced vegetative index 2 (EVI2), photosynthetic vigour ratio (PVR), green chlorophyll index (GCI), red-edge chlorophyll index (RECI), triangular vegetative index (TVI) and the MERIS terrestrial chlorophyll index (MTCI) (see for formulae and references). Some of these VIs were originally developed for narrow-band (hyper-spectral) imagery as chlorophyll-based indices. They have been applied here to the broader bands of the Rapideye imagery to test if they are relevant for Psa detection. Recent work (Nguy-Robertson et al. Citation2012) has shown that these narrow-band indices can be used effectively with broad-band multi-spectral imagery in broadacre field crops.
Table 3 Formula and reference for the vegetative indices (VIs) derived from the extracted image band information. The VIs were calculated at a pixel scale (5 m pixel) using the bands indicated in .
The mean VI responses and mean cloud cover for each date and for each KBI were calculated. KBIs with >5% cloud cover were omitted at this stage to avoid cloud artefacts affecting the results. The Psa infection () associated with each KPIN was then assigned to the mean KBI responses. This formed the final data set for analysis.
Data analysis
Binomial logistic regression (BLR) was used to model the mean VI response within the KBIs against the categorical infected (early) and non-infected (control) Psa groups. BLR was preferred to discriminant analysis as it is more flexible in its assumptions, predominantly that the predictors in the model (VIs) do not need to be normally distributed, linearly related or of equal variance (Tabachnick & Fidell Citation1996). The BLR was performed in R (R Development Core Team Citation2011) using a jack-knifing approach for prediction and validation.
The ratio of infected to non-infected KBIs was uneven (c. 2:1). The infected data were subset to the same size as the ‘non-infected’ data for modelling. Under these conditions a random allocation of predictions should generate on average 50% of predictions to be correct. A new subset was generated for each jack-knife iteration with the data randomly split into a training and test subset (80:20 split). A stepwise approach was then used to determine the best model for a one-, two-, three-, four-, five- and six-parameter BLR model on the training subset before the selected model was applied to the test subset. A maximum of six parameters was chosen to avoid over-fitting and to constrain the analysis to a method that would be sensible for industry application.
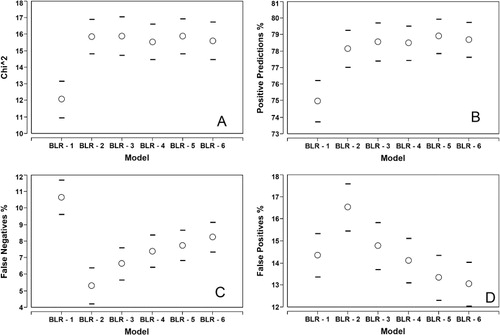
Stepwise model selection was done without replacement by minimisation of the corrected Akaike information criteria (AICc) (Hurvich & Tsai Citation1989). The χ 2 value, percentage of positive predictions (PP%) (i.e. infected predicted as infected, and non-infected as non-infected), commission errors or percentage of false positives (FP%) (i.e. non-infected predicted as infected) and omission errors or percentage of false negatives (FN%) (i.e. infected predicted as non-infected) were recorded for each iteration. The mean responses with the 95% CI ranges from the iterations were then plotted for each statistic. The percentage of times each VI from a certain date was selected in the jack-knifed models was also recorded.
In evaluating the success of the imagery for monitoring Psa infection, the interest is not only in the number of correct decisions but also in the omission errors (FN%). These indicate KBIs that were infected but were modelled as not-infected, i.e. escaped detection and are a potential threat if untreated. The commission errors are the inverse, where the canopy response is indicative of plant stress, but apparently not from Psa infection.
Results
The results from the jack-knife modelling showed that the BLR gave a correct prediction 75%–79% of the time (). The incorporation of the imagery VIs therefore improved the prediction of infected and non-infected orchards over chance. Increasing the number of parameters in the BLR from one to two increased the quality of prediction (χ 2); however further increases did not significantly improve the model () nor the number of correct positive predictions (). The two-parameter model also had the lowest level of omission error ().
Selected predictors in the BLR jack-knifing
The two-parameter BLR was the preferred model from the jack-knifing metrics (). shows the VIs that were most commonly selected across the jack-knifed one- to four-parameter BLR models and the percentage of times they were selected in each step. The variables within the BLR-2 model were dominated by VIs derived from the early season (2 October) image. The first selection was nearly always the 2 October PVR layer. Even when the 2 October PVR was chosen as the first variable in the stepwise process, the second variable was usually another VI from 2 October. EquationEquation (1) shows the most popular two-parameter BLR model from the jack-knifed results.
Table 4 The vegetative indices with associated date that were selected from the jack-knifed binomial logistic regression. Only the results for the one- to four-parameter models are presented, as the five- and six-parameter models were not superior ().
Discussion
For industry-wide management, the most important parameter is perhaps the omission error rate (). The commission error () is less important if the precautionary principle is applied. Other factors, such as other disease and pest pressures, environmental pressure or management effects, could affect canopy health (vigour) (Sankaran et al. Citation2010), which will mirror the response of Psa on the canopy. There was also a potential error from the recording of Psa infection at an enterprise (KPIN) and not a block (KBI) level. It is possible that not all blocks in an orchard with a positive response were infected. Therefore, commission errors were expected and the modelling results showed that these were higher than the omission errors as hypothesised. Sampling in these orchards will verify if the altered canopy response was caused by Psa or an alternative effect. With the precautionary principle applied it is better to verify that these orchards are not Psa orchards. The two-parameter BLR model produced the lowest omission errors but at a cost in the commission errors.
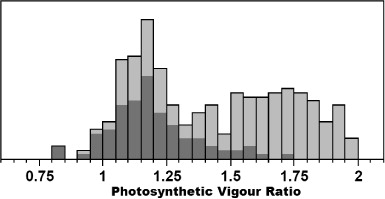
The results using the 2 October image indicated that Psa infection may be identified with a reasonable accuracy from the early season response, which is a very promising finding. In early October, the vine canopy is growing rapidly and is approaching, but not yet at, full closure. The results from this analysis, albeit confined to a single season, indicated that this could be a critical period in identifying Psa infections, especially over-winter infections. The histogram of the PVR response for 2 October () showed a bimodal distribution and the non-infected vines (shaded distribution) exhibited a lower PVR response (lower vigour) at this stage. Infected vines (non-shaded distribution) tended to have a more vigorous canopy response early in the season, which may indicate an early season vine physiological reaction to infection. However, further investigation is needed beyond this preliminary investigation to verify this. Some infected vines presented the same distribution as non-infected vines (e.g. in the range of 0.9–1.4 PVR). This may be indicative of vines that were infected during the season, rather than carrying an infection over-winter, that is, these vines are either not infected (or affected) at this stage of the season or may be exhibiting only a slight foliar infection rather than a systemic infection. From these results it was hypothesised that vines with an elevated early season PVR (>1.5) were indicative of vines infected in the previous season and over-wintered with a systemic infection. However, the industry information provided for this study was not detailed enough to verify this hypothesis.
The imagery acquired soon after canopy closure and around flowering (21 October image) was less useful than the earlier season imagery. It is difficult in this preliminary study to know if this is an effect of disease expression in a closed canopy or a physiological response associated with flowering that alters the canopy reflectance. The infected vines over this period shifted from having an above-average vigour response (2 October) to a below-average vigour response (26 December) (data not shown). This crossover period in late October/November almost certainly caused problems with the modelling. Results indicated that timeliness in image collection was extremely important, as it is in many other crops (Wilkie & Finn Citation1996). Further studies on how different stages of development, both canopy and disease, affect the canopy reflectance are needed to: (a) better understand the canopy response to disease pressure; and (b) understand how best to deploy canopy sensors in kiwifruit orchards.
The January and February imagery was less effective in the BLR than the 2 October imagery for identifying infected orchards. This may be due to issues interpreting a canopy response following mid-season canopy management, which alters canopy vigour (Boyd & Barnett Citation2011), or again an issue of having orchards under different, multiple stages of disease infection and expression at this point of the season.
While potential relationships between Psa infection and canopy vigour obtained from remotely sensed imagery have been identified, the authors recognise that there were several limitations to this study. First, this study was preliminary in nature and restricted to a single season. Certainly the results here should be tested over multiple seasons. Second, the analysis and interpretation of the remote-sensed imagery would have been facilitated by having Psa infection data collected at a better spatial and temporal resolution. In particular, infection data should be collected at a block (or maturity area) level rather than the enterprise (orchard) level and the date that the infection was observed (visual or sample taken), rather than the date of a positive laboratory test, should be recorded. Similarly, data on the severity and type of infection (internal [vascular] or external [leaf]) should also be recorded and used in the modelling.
Conclusions
Differences in the early season development of the kiwifruit vine canopy were a strong indicator of Psa infection, with high vigour responses at the start of October indicative of infected vines. This information could be used for early season identification and the development of a target sampling strategy to verify and monitor disease spread. Interpreting imagery from later in the season was more complex, in part due to how vine management affects the canopy and possibly because of a different rate of expression in diseased vines. There appeared to be a crossover point around canopy closure and flowering (late October), where Psa infected vines shifted from exhibiting a more vigorous to a less vigorous canopy response.
Although results for early season detection were encouraging, this is a single season analysis on opportunistic and archived data. A more target study is needed to better understand the responses observed in this preliminary investigation.
Acknowledgements
This research was funded by Zespri Group Ltd. The authors wish to thank Kiwifruit Vine Health Inc. and Zespri International Ltd for providing access to the pathogen infection data and satellite imagery used to undertake this research. We would also like to thank AgFirst Ltd, Bay of Plenty, New Zealand for providing geospatial data over the study area.
References
- Boyd LM, Barnett AM 2011. Manipulation of whole-vine carbon allocation using girdling, pruning, and fruit thinning affects fruit numbers and quality in Kiwifruit. HortScience 46: 590–595.
- Broge NH, Leblanc E 2001. Comparing prediction power and stability of broadband and hyperspectral vegetation indices for estimation of green leaf area index and canopy chlorophyll density. Remote Sensing of Environment 76: 156–172. 10.1016/S0034-4257(00)00197-8
- Dash J, Curran PJ 2004. The MERIS terrestrial chlorophyll index. International Journal of Remote Sensing 25: 5403–5413. 10.1080/0143116042000274015
- Datt B 1999. A new reflectance index for remote sensing of chlorophyll content in higher plants: tests using eucalyptus leaves. Journal of Plant Physiology 154: 30–36. 10.1016/S0176-1617(99)80314-9
- Everett KR, Taylor RK, Romberg MK, Rees-George J, Fullerton RA, Vanneste JL et al. 2011. First report of Pseudomonas syringae pv. actinidiae causing kiwifruit bacterial canker in New Zealand. Australasian Plant Disease Notes 6: 67–71. 10.1007/s13314-011-0023-9
- Ferrante P, Scortchini M 2009. Identification of Pseudomonas syringae pv. actinidae as a causal agent of bacterial canker of yellow kiwifruit (Actinidia chiensis Planchon) in central Italy. Journal of Phytopathology 157: 768–770. 10.1111/j.1439-0434.2009.01550.x
- Gitelson AA, Gritz Y, Merzlyak MN 2003. Relationships between leaf chlorophyll content and spectral reflectance and algorithm for non-destructive chlorophyll assessment in higher plant leaves. Journal of Plant Physiology 160: 271–282. 10.1078/0176-1617-00887
- Gitelson AA, Merzlyak MN 1994. Spectral reflectance changes associated with autumn senescence of Aesculus Hippocastanum L. and Acer Platanoides L. leaves: spectral features and relation to chlorophyll estimation. Journal of Plant Physiology 143: 286–292. 10.1016/S0176-1617(11)81633-0
- Gitelson AA, Merzlyak MN 1998. Remote sensing of chlorophyll concentration in higher plant leaves. Advances in Space Research 22: 689–692. 10.1016/S0273-1177(97)01133-2
- Huete A, Justice C, Liu H 1994. Development of vegetation and soil indices for MODIS-EOS. Remote Sensing of Environment 49: 224–234. 10.1016/0034-4257(94)90018-3
- Huete AR, Liu H, Batchily K, van Leeuwen W 1997. A comparison of vegetation indices over a global set of TM images for EOS-MODIS. Remote Sensing of Environment 59: 440–451. 10.1016/S0034-4257(96)00112-5
- Hurvich CM, Tsai C-L 1989. Regression and time series model selection in small samples. Biometrika 76: 297–307. 10.1093/biomet/76.2.297
- Jones HG, Schofield P 2008. Thermal and other remote sensing of plant stress. General and Applied Plant Physiology 34: 19–32.
- Koh YJ, Jung HS, Hur JS 2003. Current status of occurance of major diseases on kiwifruits and their control in Korea. Acta Horticulturae 610: 437–443.
- Koh YJ, Kim GH, Jung JS, Lee YS, Hur JS 2010. Outbreak of bacterial canker on Hort16A (Actinidia chiensis Planchon) caused by Pseudomonas syringae pv. actinidae in Korea. New Zealand Journal of Crop and Horticultural Science 38: 275–282. 10.1080/01140671.2010.512624
- Lamb DW, Hall A, Louis J 2001. Airborne remote sensing of vines for canopy variability and productivity. Australian Grapegrower and Winemaker 449A: 89–92.
- Metternicht G 2003. Vegetation Indices derived from high-resolution airborne videogaphy for precision crop management. International Journal of Remote Sensing 24: 2855–2877. 10.1080/01431160210163074
- Nguy-Robertson AL, Gitelson AA, Peng Y, Viña A, Arkebauer TJ, Rundquist DC 2012. Green leaf area index estimation in maize and soybean: combining vegetation indices to achieve maximal sensitivity. Agronomy Journal 104: 1336–1347. 10.2134/agronj2012.0065
- Phylloxera and Grape Industry Board of South Australia 2012. Phylloxera surveillance using GIS. http://www.phylloxera.com.au/services/mapping-gis/ (accessed 14 October 2013).
- R Development Core Team 2011. R: a language and environment for statistical computing. Vienna, Austria, R Foundation for Statistical Computing. http://www.R-project.org/. ISBN 3-900051-07-0
- Rouse JW, Haas RH, Schell JA, Deering DW 1973. Monitoring vegetation systems in the great plains with ERTS. Third ERTS Symposium, NASA SP-351 I: 309–317.
- Sankaran S, Mishra A, Ehsani R, Davis C 2010. A review of advanced techniques for detecting plant diseases. Computers and Electronics in Agriculture 72:1–13. 10.1016/j.compag.2010.02.007
- Tabachnick B, Fidell L 1996. Using multivariate statistics. 3rd edition. New York, Harper Collins. 880 p.
- Taylor JA, Praat J-P, Bollen AF 2007. Spatial variability of kiwifruit quality in orchards and its implications for sampling and mapping. HortScience 42: 246–250.
- Vanneste JL, Giovanardi D, Yu J, Cornish DA, Kay C, Spinelli F et al. 2011. Detection of Pseudomonas syringae pv. actinidae in kiwifruit pollen samples. New Zealand Plant Protection 64: 246–251.
- West JS, Bravo C, Oberti R, Lemaire D, Moshou D, McCartney HA 2003. The potential of optical canopy measurement for targeted control of field crop diseases. Annual Review of Phytopathology 41: 593–614. 10.1146/annurev.phyto.41.121702.103726
- Wilkie DS, Finn JT 1996. Remote sensing imagery for natural resource monitoring: A guide for first time users. Chichester, New York, Columbia University Press. 50 p.
- Woodward TJ, Clearwater MJ 2011. Spatial variation in ‘Hayward’ kiwifruit dry matter content within a growing region across seasons. New Zealand Journal of Crop and Horticultural Science 39: 241–249. 10.1080/01140671.2011.588235
- Woodward TJ, Clearwater MJ 2012. Spatial variation in ‘Hayward’ kiwifruit fruit size and orchard yield within a growing region across seasons. New Zealand Journal of Crop and Horticultural Science 40: 187–199. 10.1080/01140671.2011.639377