
ABSTRACT
In Canterbury, New Zealand, potato (Solanum tuberosum L.) growers are concerned that current fertiliser inputs limit yields. We tested if increasing these inputs would enable the crops to achieve their potential yield (Ypot). In four crops, nitrogen (N), phosphorus (P) and potassium (K) fertilisers were applied at or double the growers’ current rates. We also included two rates of calcium (Ca). Tuber yields were compared using ANOVA and by simulation using PARJIB, a nutrient response model. None of the crops achieved Ypot. Yield was unaffected by changes in K or Ca rate. Doubling N and P applications increased yield at one site only (where Ypot was largest but soil P and mineral N concentrations were least). Up to 21% of Ypot was lost because of factors not included in the PARJIB model. Except at the least fertile sites, increasing fertiliser rates is unlikely to improve yield until the non-nutritional causes of yield gaps are identified and remedied.
Introduction
In the developed world, potato (Solanum tuberosum L.) crops are often produced using considerable amounts of inorganic fertilisers (Allison et al. Citation2001a, Citation2001b; Craighead & Martin Citation2003; Reid et al. Citation2011; Mohr & Tomasiewicz Citation2012). In Canterbury, New Zealand, potatoes grown for processing are an important crop (Plant & Food Research, Horticulture New Zealand Citation2014), but the viability of the industry is under threat because over the past 10 years input costs have risen while yields, in general, have not (John Jackson, McCain Foods Ltd, pers. comm. 2012). Many growers consider that their crops are not performing to potential and they are particularly concerned that their crops may not be receiving sufficient fertiliser nutrients to maximise yields (D. McLeod, Seed & Field Services, pers. comm. 2012).
We are not aware of any widespread survey of current fertiliser use by potato growers in New Zealand. A combined field and simulation study of five commercial crops in Canterbury from 2002 to 2005 suggested that the nitrogen (N) applications used by the growers were not limiting yields (Jamieson et al. Citation2004, Citation2006). Reid et al. (Citation2011) also used a combination of field measurements and simulation to examine N, phosphorus (P), potassium (K) and magnesium (Mg) fertiliser use on two process potato crops grown in alluvial soils in Canterbury and two table potato crops grown in volcanic soils near Ohakune. They concluded that at the growers’ chosen fertiliser rates, yield losses due to nutrient supply were up to 26% for the Ohakune crops, but for the Canterbury crops the losses were <8%.
Here we report a further investigation of whether current fertiliser practices are limiting yields of process potatoes in Canterbury. This is a first step towards identifying what, if any, management practices need to be adjusted if yields are to increase. The hypothesis under test is that increasing current fertiliser applications would enable the crops to achieve potential yields.
Materials and methods
Overview
Fertiliser response experiments were set up within four commercial crops of process potatoes. With the exception of the fertiliser treatments, the crops were managed by the commercial growers themselves according to their normal practices. The nutrients applied were N, P, K and calcium (Ca). Yields from the various treatments were examined by analysis of variance and by simulation using a nutrient response model calibrated for potatoes.
Field experiments
Sites
Details of the four sites are given in . All sites were irrigated, at dates and rates chosen by the growers. The sites were chosen in collaboration with industry representatives. To help to characterise the sites in terms of disease pressure, alongside each experimental area an extra plot (10 × 7 m) was reserved for destructive examination of plants through the season. This plot received the growers’ fertiliser rates. At intervals from the middle of February 2013, a sample of roots and underground stems was excavated by spade and examined by eye for obvious signs of pathogen attack. There were no signs of damage caused by root-knot nematodes (Meloidogyne fallax and M. hapla) at any site, or galls such as Spongospora subterranean at Sites A, B and D. At Site C, some galls were found on roots 2 weeks before harvest, but none before then. At all sites there were signs of Rhizoctonia solani stem canker on underground stems from mid-February through to final harvest. There were no signs of damage due to psyllid (Bactericera cockerelli [Sulc]) or the liberibacter pathogen it transmits, at any site.
Table 1. Site and potato crop details.
Treatments
At each site, for N, P and K there were two main treatments: the grower's current fertiliser application rate and double that rate. Some industry representatives expressed opinions that applications of fertiliser Ca (not widely practised at present) may also increase yields, and so two rates of Ca (either 117 or 234 kg Ca ha−1) were included. Different combinations of N, P, K and Ca rates made up the experimental treatments which are listed in ; note that the growers’ rates for N, P and K differ between sites (). At each site the treatments were arranged in three replicate blocks of 12 plots each. Plot length was 10 m, and width was eight rows of potatoes (c. 7 m).
Table 2. Experimental fertiliser treatments for potato crops.
The growers’ rates of fertiliser for N, P and K were applied by the growers themselves across the whole experimental area. These applications were a combination of base dressings at the start and side dressings through the season. After each application by the growers, we applied by hand whatever extra fertiliser was necessary to make up the double growers’ rate treatments. Both Ca treatments were applied as gypsum prior to planting. All fertilisers were broadcast.
The growers indicated that fertiliser rates were chosen first on the basis of soil test results and then aligned with anticipated crop needs for a target paid yield of 65 t ha−1 fresh (c. 13.3 t ha−1 dry). The Ca rate was chosen based on some growers’ previous experience and rates used. In all cases the decisions were vetted by a consultant, but the rules and supporting data used are proprietary, and the authors are unaware, for example, of how allowance was made for nutrient concentrations already in the soil.
Measurements
Before the first fertiliser applications the soils were sampled for chemical analysis. From each plot nine cores were taken at 0–15 cm depth, three cores at 0–30 cm depth and three from 30–60 cm depth. For each plot and depth combination, the cores were bulked. Samples from 0–15 cm depth were analysed for pH, Olsen P, anion storage capacity, exchangeable cations, reserve K and anaerobically mineralisable N (). The samples from 0–30 and 30–60 cm depths were analysed for mineral N only.
Table 3. Soil chemical properties at the experimental potato sites.
Yields were measured between 3 and 21 days after the commercial harvest in the rest of the paddock (depending on the weather). Plant and stem populations were counted first, then tubers were removed from an area two rows wide by 8 m long using a two-row harvester (Sites A and B) or by hand and fork (Sites C and D). Clean tuber yield was measured fresh on all harvested tubers, and dry tuber yield was estimated from this using tuber moisture % measurements made on subsamples (>700 g) dried at 90 °C.
Data analysis
Analysis of variance (ANOVA) was carried out on the fresh and dry weight tuber yields and dry matter (DM) % for each site using GenStat® v14. The experiment was designed to enable three different analyses with different subsets of data. The complete data set was used to examine the effects of individual treatments to see if any particular treatments stood out. A more sensitive test for the effects of the main treatments is possible with this experimental design. A subset of the data was used to examine the effects of N, P and Ca independently of K. This data set was obtained by restricting K = 2, and the design could be broken down to a 2 × 2 × 2 factorial, allowing the assessment of the main effects of N, P and Ca, plus two- and three-way interactions. Another subset was extracted to allow assessment of K effects and two-way interactions with K. The full treatment design was chosen to allow a fractional factorial for partial assessment of K effects. For this analysis, treatments 4, 6, 7 and 8 were excluded from the data. Treatments were confounded so that it was only possible to analyse the two-way interactions. These design constraints were necessary because of resource restrictions.
None of the above ANOVAs was carried out using covariates such as measures of soil fertility. Antecedent soil fertility can have a marked influence on yield responses to fertiliser. Simple linear responses may not occur, and complex interactions may occur between the effects of soil N, P and K status (Cooke Citation1982; Reid Citation2002) and plant populations, making it difficult to interpret the effects of such variables when used as covariates. Such effects can be explored using simulation models of crop growth and response to nutrients.
Simulation analyses
After Reid et al. (Citation2011), we used the PARJIB model to explore some of the factors influencing yield across the experimental sites. PARJIB calculates yield losses attributable to an inadequate supply of N, P, K, Mg and water (Reid Citation2002). It needs to be fitted for the exact combination of crop species and techniques of soil chemical analysis but, because it uses potential yield as a scaling factor, once fitted the model is usually portable across soil types, years, crop varieties, planting times and weather conditions (Jamieson et al. Citation2001; Reid et al. Citation2002; Reid et al. Citation2004a, Citation2004b; Wilson et al. Citation2006; Reid et al. Citation2011). We used parameter values fitted for experiments examining potato response to nutrient supply at seven different locations within New Zealand (Reid et al. Citation2011). A plot of observed on simulated yield for the fitting data set had a slope of (1.01 ± 0.043) (Reid et al. Citation2011).
For each crop simulated, PARJIB requires input of potential yield (Ypot)—that is the tuber DM yield that would be attained if the crop (at a standard planting density of 4.76 m−2 and at its actual planting date) received sufficient mineral nutrients and water to be unstressed. Ypot values are sensitive to cultivar characteristics, particularly phenological parameters that influence the time course of leaf area index (Jamieson et al. Citation2004). The PARJIB parameter set fitted by Reid et al. (Citation2011) used estimates of Ypot calculated from the Potato Calculator (Jamieson et al. Citation2004, Citation2006, Citation2008), so here we did the same. For each site the Potato Calculator was set to forecast yield with no limitations due to water or nutrients, using the weather recorded at the nearest automatic weather station. A separate set of simple water balance calculations (Ritchie Citation1972) provided the potential soil water deficit values needed for PARJIB. For those calculations we again used the weather recorded at the nearest automatic weather station to each site supplemented with leaf area index values simulated by the Potato Calculator, and where possible the actual irrigation amounts and timings. Irrigation data were supplied by the growers at Sites A and B, but not at Sites C and D. So for Sites C and D we carried out two sets of simulations: a no-irrigation scenario (water received from rainfall only) and a fully irrigated scenario (irrigation amounts applied to keep the potential soil moisture deficit smaller than the critical value identified in the PARJIB calibration).
The yield gap
PARJIB involves a catena of yield estimates. It starts with Ypot which is itself of value to growers and should be a good indication of the very best that a crop could yield given the restrictions of the cultivar and seasonal weather. PARJIB adjusts Ypot upwards or downwards for the observed plant population, and downwards as necessary for water stress, to produce Ymax, which dictates the demands for mineral nutrients. Finally, the simulated yield (Ysim) is Ymax adjusted for the supply of N, P, K and Mg (direct effects of soil pH on potato yield could not be discerned in the fitting dataset used by Reid et al. [Citation2011]). Here we introduce two extra quantities based on the concept of a yield gap (Ygap):
where Yobs is the observed dry weight yield. If (Ygap1 > 0), that suggests that management factors have limited yield and it is worth looking deeper to identify them. Interim variables calculated within PARJIB indicate the likely yield reduction due to water stress and to supplies of N, P, K and Mg. If (Ygap2 > 0), that indicates that yield has been reduced by factors not taken into account in the potential yield and PARJIB models. Examples might include competition from weeds, disease pressure or soil compaction—or supply of mineral nutrients such as Ca that are not included in the PARJIB model as applied here.
Reliability of Y pot and yield gap values
In earlier work the Potato Calculator had a tendency to overestimate observed yields in some commercial crops. This was interpreted (Jamieson et al. Citation2006) as indicating such yields were being suppressed by disease, pest, water or nutritional factors not included in the potential yield model. This tendency was not active or perhaps was compensated for in the fitting of the PARJIB model, because as noted above, the fitting process resulted in very good agreement between observed and simulated yields. A key criterion for the choice of data to fit PARJIB was that the crops were clean of obvious disease and pests, and other than water or nutrient supply there were no soil properties (such as poor structure) that were likely to have limited the yield. Nevertheless, we cannot discount the possibility that our estimates of Ypot and Ygap1 may be slightly high.
Data analysis
Forecast values for yield and for yield losses due to water and nutrients (N, P, K and Mg either separately or in combination) were analysed using the same ANOVA procedures described above for measured yields.
We also carried out graphical and regression analyses of relationships between Ygap2 and plot-by-plot measurements of various variables. It is important to remember that Ysim and thus Ygap2 are subject to uncertainties associated with the fitting of PARJIB. Here we calculated two confidence intervals for Ysim based on information from the model fitting process: ± the root mean square error of calibration, and ± the 5% confidence limits from the regression of observed on simulated yields for the fitting data set. We emphasise that values of Ysim calculated for Sites A, B, C or D were independent of the data used for model fitting, and involved no adjustment of model parameters, and so hereafter we treat them as yield forecasts.
Results and discussion
Except where noted, we report yields for total tuber DM. Unless indicated otherwise, tolerances associated with means are given as standard errors (SE = σ /√n).
Simulation analyses
To forecast the suitability of the growers’ fertiliser rates, we pooled data from the Ca1 and Ca2 treatments (the PARJIB model as previously fitted did not include responses to Ca). Values of Ygap1 were large at all sites (), supporting the growers’ opinion that their crops were not performing to potential.
Table 4. Forecast yield losses in potato tuber dry matter (t ha−1) for growers’ rates of N, P and K (treatments 9 and 11 pooled, n = 6).
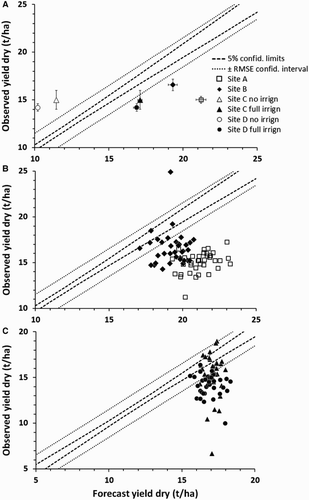
None of this yield loss can be attributed to inadequate plant population density. In general, plant populations were slightly less than the standard value of 4.76 m−2 used for the Ypot calculations, and the PARJIB analysis suggested that this would have benefited yield a little (). Furthermore, only part of the yield losses was attributed to inadequate irrigation. At Site A, water stress did not limit the forecast yields. At Site B, irrigation did appear to be less than optimal, but simulated yield losses due to water stress were only about 1.9 t ha−1, or 9% of Ypot (). The no-irrigation scenarios at Sites C and D indicated that simulated yield losses to water stress were larger than Ygap2 () representing 36% and 46% of Ypot, respectively (). The observed yields were rather larger than the simulated values, suggesting that the full-irrigation scenarios are rather closer to actual practice at these sites.
Table 5. Forecast yield losses in potato tuber dry matter expressed as a percentage of Ypot for growers’ rates of N, P and K (treatments 9 and 11 pooled, n = 6).
The forecast yield losses due to mineral nutrition varied considerably between sites ( and ). For Site A (the least fertile site), the PARJIB model suggested about 4.8 t ha−1 of dry yield (21% of Ypot) would have been lost because of inadequate nutrient supply. Supplies of N and P were roughly equally limiting, with K supply affecting yield less. Note that the PARJIB model includes a description of interactions between nutrient effects on yield and so the net effect of inadequate nutrients may be less than the sum of the interim calculated values for individual nutrients. Forecast yield losses due to inadequate mineral nutrition averaged c. 9% of Ypot at Site B, 5% at Site C under full irrigation and 10% at Site D under full irrigation. The forecast losses under nil irrigation at Sites C and D were negligible because the water stress reduced the simulated demand for mineral nutrients. Across all sites the forecast yield losses due to nutrition were mainly associated with inadequate N and P supply; K appeared to be limiting yield only at Site A, and Mg did not limit yield at any of the four sites.
Overall, the simulation analyses forecast that the growers’ fertiliser rates were insufficient for the crops to achieve potential yield but substantial yield responses to increased fertiliser rates would occur only at Site A. At the other sites, forecast yield limitations due to mineral nutrition were associated with N and P supply (not K) and generally they were less than 2 t ha–1 or 10% of potential yield.
Observed responses to fertiliser
ANOVAs detected no effects of individual treatments on the fresh mass yield of potatoes at any of the four sites (). There was an indication (P < 0.01) that the tuber DM% varied among the treatments at Site B. Usually, dry mass yield is better than fresh mass yield as an indicator of crop performance. At Site A alone there were significant differences between treatments in dry mass yields. There, the significant difference arose because plants in treatment 3 (N1 P1 K2 Ca2) had a lower dry mass yield than those in the other treatments. This was because of one plot with a dry mass yield 3.5 t ha–1 (24%) less than the average for the other plots of that treatment. In this plot, some soil chemical properties were relatively poor. Mineral N (0–30 cm depth), Olsen P (0–15 cm) and exchangeable K (0–15 cm) were, respectively, 71%, 70% and 57% of the site averages. Anion storage capacity and exchangeable Ca (both at 0–15 cm depth), respectively, were 120% and 107% of the site average values.
Table 6. Individual treatment effects on observed potato tuber yields and dry matter % at the different sites.
Analysis of variance for main treatment effects at the individual sites indicated no direct effects of Ca rates on yield or DM% at the K2 rate (). Doubling the rate of N and P fertilisers significantly affected the yield only at Site A. In general, Site A had the least chemical fertility of the four sites examined, with the smallest concentration of mineral N in the top 15 cm soil at planting, and along with Site D had the smallest soil Olsen P (). Furthermore, the grower's P application rate at Site A was considerably less than those at the other sites, and the potential yield was the largest of all the sites (). Therefore we should expect that Site A was the most likely to show responses to increased P fertiliser and maybe N also.
Table 7. Response of observed fresh and dry weight potato yields (t ha− 1) and tuber DM% to the main treatments (two rates each of N, P, Ca and K).
Also at Site A only, the ANOVAs showed a significant interaction between the effects of N, P and Ca fertiliser rates on dry mass yield (). This interaction arose because the yield of plants in the N1 P1 Ca2 treatment was less than for plants in the other N, P and Ca combinations, which did not differ significantly from each other. As mentioned above, at this site one plot of treatment 3 (N1 P1 K2 Ca2) had an unusually small yield that might be associated with poor supply of N and P from the soil. Excluding this plot from the analysis eliminated the interaction effect.
Tuber DM% decreased significantly when P rate was doubled, but only at Site D. Across all sites there was a trend that DM% was decreased where P fertiliser increased the proportion of tuber yield >90 mm. This is consistent with findings of Freeman et al. (Citation1998), who showed that P decreased specific gravity if the P application also increased the proportion of tubers >280 g. However, our results are insufficient to suggest under what conditions P will increase the proportion of large tubers and thus alter DM%. Tuber DM% was affected by significant (N × P) and (Ca × P) interactions at Site B (). In contrast to Site D, doubling the rate of P at Site B significantly increased the tuber DM% when the single rates of N and Ca were applied. However, at the double rate of N or Ca, increasing the P rate did not significantly increase tuber DM%. This pattern was quite specific to Site B; at other sites the interaction was not significant and did not follow this trend. Laboski & Kelling (Citation2007) also noted N × P interactive effects on tuber specific gravity in some situations. Similarly, effects of Ca have been reported in some situations, but not others (Laboski & Kelling Citation2007). The interactions in the effects of N, P and Ca on DM% observed here are not sufficiently consistent to justify changes to management practices.
The contrast between the effects of the K1 and K2 treatments showed no effects of doubling the K rate at Sites A, C and D (). However, the results for Site B suggest a risk associated with increasing the growers’ K rates when soil K status is already adequate. Site B had the largest initial concentration of exchangeable K—and the smallest initial concentration of exchangeable Ca—in the soil (). At this site, doubling the grower's rate of K application increased the fresh mass yield, but it did this by decreasing tuber DM% and DM yield was unaffected (). This is consistent with experience overseas (Allison et al. Citation2001a) and in New Zealand (Craighead & Martin Citation2003). Usually, decreases in tuber DM% are associated with poorer processing and cooking quality of potatoes (Storey & Davies Citation1992), so the slightly increased fresh yield due to K application at Site B is of dubious value to the grower and processor.
Summary of responses to fertiliser
For the least fertile site (A), the simulation analyses forecast that the growers’ fertiliser rates provided insufficient N, P and to a lesser extent K to the crop, and doubling those fertiliser rates did significantly increase measured yield. This supports the hypothesis under test that increasing current fertiliser applications would enable the crops to achieve potential yields. For the other three sites, the model forecast that the crops were limited much less by nutrient supply, and doubling the growers’ fertiliser rates failed to increase measured yield significantly. So, for three of the four sites, our results do not provide strong support for the hypothesis.
Yield gaps
Yields simulated using the PARJIB model take into account the effects of weather conditions, cultivar characteristics, plant population, water stress and nutrient supply. Comparing Yobs with Ysim for all the experimental plots revealed some substantial differences between the sites (A–C). Even after allowing for the losses due to water and nutrient supply, Ysim was often much larger than Yobs, so Ygap2 values were considerable. There were no significant effects of the N, P, K and Ca fertiliser rates on Ygap2 (results not shown). At the growers’ rates of N, P and K (treatments 9 and 11 combined), Ygap2 averaged (21 ± 2.1)% and (13 ± 3.0)% of Ypot for Sites A and B, respectively. At Sites C and D, Ygap2 values were not significantly greater than zero if the crops had not been irrigated (). As noted above, it is likely that the full irrigation scenarios are a more realistic representation for these sites. Under full irrigation, for the growers’ rates of N, P and K, the average Ygap2 was (19 ± 12)% and (14 ± 4.6)% of Ypot at sites C and D, respectively. So, at Sites A, B and D at least, there appear to have been significant yield losses that were not due directly to factors included in PARJIB.
Figure 1. Comparison between observed potato yields and those forecast using the PARJIB model: A, mean yields for all sites plotted ± confidence limits for P = 5%; B, individual plot yields from sites A and B; C, individual plot yields from sites C and D. Note that the axes' scales differ between graphs. The pecked lines represent two different confidence limits for the forecast yields: the P = 5% limit associated with regression analysis of observed on simulated yields from the original fitting of the PARJIB model for New Zealand potato crops (Reid et al. Citation2011), and the 1:1 line plus and minus the root mean square error of simulation, again from the original model fit. The relatively poor ‘fit’ of observed on forecast yields for many plots here reflects the yield gap (Ygap2). A yield gap is indicated where plotted yields are to the right of the lower of the plotted confidence lines.
We prepared plots and regressions of Ygap2 against measured management, environment or crop variables on all plots and treatments for Sites A and B, and for the fully irrigated scenarios at Sites C and D. To simplify comparisons we expressed Ygap2 as a percentage of Ypot. Across all four of these situations the best relationship we found was for Ygap2 (%) to increase as the calculated cumulative drainage (d, mm) increased (Ygap2 = 7–0.07d, R2 = 0.115, P < 0.001). There was also a tendency for Ygap2 (%) to decrease slightly as the application of K fertiliser (Kfert, kg K ha−1) increased (Ygap2 = 22–0.017Kfert, R2 = 0.110, P < 0.001). Site-to-site management variations had a considerable influence on both Kfert and d, and the number of different values was very limited, so these weak relationships may be chance results or reflections of other differences between sites.
Next we examined the variation in Ygap2 within individual sites. At Sites A and B, the best relationships found were between Ygap2 (%) and anaerobically mineralisable N from 0–15 cm depth (Ns, kg N ha−1). At Sites A and B respectively, the relationships were (Ygap2 = 14 + 0.15Ns, R2 = 0.184, P < 0.01) and (Ygap2 = 3–0.13Ns, R2 = 0.127, P < 0.05). It is difficult to interpret these weak relationships, and given that no such relationships were apparent at Sites C and D, we suggest that they are chance results.
General discussion
At three of the four study sites, measured yields were substantially less than potential, but doubling the growers’ fertiliser rates of N and P increased measured yields at the least fertile site only. There were no effects on tuber dry mass yield at any of the four sites associated with doubling the growers’ rates of K application or from increasing Ca applications from 117 to 234 kg Ca ha−1. For three of the four sites, the measured yield results do not support the hypothesis that current fertiliser applications are insufficient for the crops to achieve potential yields.
The simulation results reinforce the notion that supply of K was not limiting yield at the growers’ fertiliser rates at any of the four sites. However, the PARJIB model did suggest that at growers’ fertiliser rates, N supply was limiting yield at all four sites and P supply was limiting at two sites. That does support the hypothesis under test. This apparent contradiction between the observed and simulated results needs to be considered in more detail.
First, the results for observed yields at three sites simply indicate that doubling the growers’ rates of fertiliser did not cause yield increases that were detectable with the degree of precision achieved in these experiments. They should not be interpreted as showing that a smaller increase in nutrient supply could not have increased yields; curves of yield response to nutrient inputs may sometimes have a noticeable optimum rather than be asymptotic to a maximum (Wood Citation1980; Cooke Citation1982). Furthermore, underlying treatment effects in the observed yields may have been obscured by within-crop variability and other processes. The simulated yield losses due to inadequate N and P supply were 21% of potential yield at Site A, but only 5%–10% at the remaining sites. It is quite possible that effects of this size were not detectable in the field at Sites B, C and D.
Second, we must consider the reliability of the model for these situations. PARJIB is a semi-mechanistic model and as noted above requires to be fitted to experimental data. The model as used here was fitted by Reid et al. (Citation2011) and is independent of the data gathered in these experiments. It is important to compare the ranges of the most important data used in that fitting process with those from these experiments. The observed dry tuber yields in the fitting dataset were up to 18 t ha−1; in these experiments only five of the 144 measured plot yields, and none of the treatment mean yields, exceeded this value. The maximum rates of N, P, K and Mg fertiliser application in the fitting data set were 472, 382, 615 and 161 kg element ha−1. These adequately cover the range of growers’ application rates (), but with the exception of P they are smaller than the element application rates for the double growers’ rates treatments. So we can have confidence that the PARJIB model as used here is well suited for analysis of the growers’ rates treatments, but we must be more cautious of its simulations of the N2 and K2 treatments. It is worth noting that within the fitting data of the PARJIB model, yield did not start to decline due to a supra-optimal supply of N, P or K. We suggest that the model is probably correct in indicating that at all sites yields could be improved, if only a little, by increasing the growers’ rates of N and P. However, we must be less confident of the simulated response to increasing N applications beyond 472 kg N ha−1.
Third, we cannot discount the possibility that the observed yields were subject to influences not accounted for in the PARJIB model. At Sites A, B and D the observed yields were generally smaller than the simulated ones and Ygap2 > 0.
Our results, and in particular the size of Ygap2, suggest that there are other causes of yield losses that should be a higher priority target than adjusting fertiliser regimes. We found no strong relationships between Ygap2 and any of the crop or environmental variables measured, but we cannot discount the possibility that relationships would have been apparent if there were a wider range of some of these variables. Suggestions for future investigation include soil compaction, excess soil wetness, seed potato quality and plant diseases. Potato crops in Canterbury can be very sensitive to water deficit (Jamieson Citation1985) and although our calculations here suggest inadequate irrigation was not a dominant cause of yield losses, we suggest this should be checked in more detail. Our calculations have assumed that irrigation reached and infiltrated the soil surface evenly. Poor distribution of water or excessive application rates could lead to a patchwork pattern of water deficits and water excess within the crop, which could contribute towards substantial yield gaps.
Apparently, the growers’ choices of fertiliser rates were strongly influenced by a target paid yield of 65 t ha−1 fresh (c. 13.3 t ha−1 dry). This is less than the measured (total) plot yields and substantially less than Ypot even after making typical allowances for yield losses at harvest and factory rejection rates. So, it may not seem surprising that the crops did not reach potential yields nor that the PARJIB model suggested yields could be increased by raising N and P application rates at some sites. Nevertheless, at three of the four sites our measurements showed little or no advantage to doubling fertiliser rates, and it appears that yield was strongly limited by factors not directly related to nutrient supply. Overall our results indicate that there is nothing to be gained by increasing fertiliser rates until the causes of large Ygap2 values are identified and remedied.
The results presented here cover four different sites, but only one season. The modelling analysis has made extensive use of Ypot calculations and so our conclusions from this should be robust in the face of much seasonal variation in weather conditions. However, some weather events such as extreme heat or rain might adversely affect yield in ways not accounted for by our approach. In all cases we can think of, these would suppress yield. Mostly this would reinforce our conclusion that increasing fertiliser rates would not improve yield. The exception to this could be an extreme rainfall event shortly after the majority of fertiliser N had been applied; if that leached sufficient nitrate to reduce yield then increasing the growers’ standard rates of fertiliser application might well improve yields but with adverse environmental impacts.
Conclusions
At the four sites studied, achieved yields were less than potential. Doubling the growers’ fertiliser rates improved yields only at one site (Site A), which had relatively poor N and P supplies and a large potential yield. At three of the four sites (including Site A) there were substantial gaps between the observed yields and those expected after allowing for irrigation and fertiliser applications. At all except the least fertile sites, increasing fertiliser rates is unlikely to improve yield until the non-nutritional causes of such yield gaps are identified and remedied.
Acknowledgements
We thank C.S. Tregurtha, S. Dellow and S. Pethybridge for advice and assistance, and D. McLeod (Seed and Field), the growers and their agronomists for access to and use of their crops and land.
Disclosure statement
No potential conflict of interest was reported by the authors.
Additional information
Funding
References
- Allison MF, Fowler JH, Allen EJ. 2001a. Responses of potato (Solanum tuberosum) to potassium fertilizers. Am J Agric Econ. 136:407–426.
- Allison MF, Fowler JH, Allen EJ. 2001b. Effects of soil- and foliar-applied phosphorus fertilizers on the potato (Solanum tuberosum) crop. J Agr Sci. 137:379–395.
- Carey PL, Metherell AK. 2003. Rates of release of non-exchangeable potassium in New Zealand soils measured by a modified sodium tetraphenyl-boron method. N Z J Agric Res. 46:185–197. doi: 10.1080/00288233.2003.9513546
- Cooke GW. 1982. Fertilizing for maximum yield. 3rd ed. London: Collins.
- Craighead M, Martin R. 2003. Fertiliser responses in potatoes–an overview of past Ravensdown research. P Ag Soc NZ. 32:15–25.
- Freeman KL, Franz PR, de Jong RW. 1998. Effect of phosphorus on the yield, quality and petiolar phosphorus concentrations of potatoes (cvv. Russet Burbank and Kennebec) grown in the krasnozem and duplex soils of Victoria. Aust J Exptl Agric. 38:83–93.
- Jamieson PD. 1985. Irrigation response of potatoes. In: Hill GD, Wratt GS, editors. Potato growing: a changing scene. 1st ed. Lincoln: Agronomy Society of New Zealand; p. 17–20.
- Jamieson PD, Reid JB, Halse SK, Tregurtha CS, Martin RJ. 2001. Nutrient and water effects on grain production in wheat - a combined model approach. Agron New Zealand 31:45–52.
- Jamieson PD, Stone PJ, Zyskowski RF, Sinton SM, Martin RJ. 2004. Implementation and testing of the Potato calculator, a decision support system for nitrogen and irrigation management. In: MacKerron DKL, Haverkort AJ, editors. Decision support systems in potato production: bringing models to practice. Wageningen: Wageningen Academic Publishers; p. 85–99.
- Jamieson PD, Zyskowski RF, Sinton SM, Brown HE, Butler RC. 2006. The potato calculator: a tool for scheduling nitrogen fertilizer applications. Agron New Zealand 36:49–53.
- Jamieson PD, Zyskowski RF, Li FY, Semenov MA. 2008. Water and N uptake and responses in models of wheat, potatoes and maize. In: Ma L, Ahuja LR, Bruulsema TW, editors. Quantifying and understanding plant nitrogen uptake systems modeling. Boca Raton, FL: CRC Press; p. 127–146.
- Keeney DR, Bremner JM. 1966. Comparison and evaluation of laboratory methods of obtaining an index of soil nitrogen availability. Agron J. 58:498–503. doi: 10.2134/agronj1966.00021962005800050013x
- Keeney DR, Nelson DW. 1982. Nitrogen—inorganic forms. In: Page AL, editor. Methods of soil analysis. Part 2. Chemical and microbiological properties. Madison, WI: American Society of Agronomy, Soil Science Society of America; p. 643–698.
- Laboski CM, Kelling K. 2007. Influence of fertilizer management and soil fertility on tuber specific gravity: a review. Am J Potato Res. 84:283–290. doi: 10.1007/BF02986240
- Lee R, Cornforth IS, Edmeades DC, Watkinson JH. 1991. A comparative study of MAF (Ruakura) and DSIR Land Resources soil analysis results. N Z J Agric Res. 34:227–233. doi: 10.1080/00288233.1991.10423364
- Mohr RM, Tomasiewicz DJ. 2012. Effect of rate and timing of potassium chloride application on the yield and quality of potato (Solanum tuberosum L. ‘Russet Burbank’). Can J Plant Sci. 92:783–794. doi: 10.4141/cjps2011-195
- Plant & Food Research, Horticulture New Zealand. 2014. FreshFacts New Zealand Horticulture 2014 [Pamphlet]. Auckland: Plant & Food Research; Wellington: Horticulture New Zealand; [cited 2016 Jan 18]. Available from: http://www.freshfacts.co.nz/file/fresh-facts-2014.pdf.
- Reid JB. 2002. Yield response to nutrient supply across a wide range of conditions. 1. Model derivation. Field Crops Res. 77:161–171. doi: 10.1016/S0378-4290(02)00088-6
- Reid JB, Pearson AJ, Kale AJ. 2004a. The Tomato calculator —a case study of developing decision support software for New Zealand's process tomato growers. Acta Hort. 694:237–241.
- Reid JB, van der Weerden TJ, Willimot MW. 2004b. PARJIB_express: Providing an economic basis for fertiliser recommendations for root and tuber crops. Acta Hort. 670:143–150.
- Reid JB, Searle BP, Sinton SM. 2011. Does my potato crop need fertiliser? A modeling approach. Agron New Zealand 41:79–95.
- Reid JB, Stone PJ, Pearson AJ, Wilson DR. 2002. Yield response to nutrient supply across a wide range of conditions. 2. Analysis of maize yields. Field Crops Res. 77:173–189. doi: 10.1016/S0378-4290(02)00087-4
- Ritchie JT 1972. Model for predicting evaporation from a row crop with incomplete cover. Water Resour Res. 8:1204–1213. doi: 10.1029/WR008i005p01204
- Storey RMJ, Davies HV. 1992. Tuber quality. In: Harris PM, editor. The potato crop: the scientific basis for improvement. Volume 1. 2nd ed. Dordrecht: Springer Science+Business Media BV; p. 507–569.
- Wilson DR, Reid JB, Zyskowski RF, Maley S, Pearson AJ, Armstrong SD, Catto WD, Stafford AD. 2006. Forecasting fertiliser requirements of forage brassica crops. Proc New Zeal Grassl Assoc. 68:205–210.
- Wood J. 1980. The mathematical expression of crop response to inputs. In: Physiological aspects of crop productivity: proceedings of the 15th Colloquium International Potash Institute held in Wageningen, The Netherlands. Worblaufen-Bern, Switzerland: International Potash Institute; p. 263–271.