
ABSTRACT
Sufficient winter chilling is vital for kiwifruit dormancy release and producing high flower numbers in spring. As global (and New Zealand) average temperatures rise, the risk of insufficient winter chilling increases. This study looks at the potential impact of climate change (considering temperature changes only) on the production viability of the Actinidia chinensis var. deliciosa ‘Hayward’ cultivar of kiwifruit, also known as ‘Hayward’, focusing on the principal growing area of Te Puke in the Bay of Plenty of New Zealand. It is shown that production viability steadily decreases over the coming decades for Te Puke, and becomes generally non-viable by the end of the century under all but the most stringent of global greenhouse gas emissions pathways. There are, however, many other areas of New Zealand that show a potential increase in Hayward kiwifruit production viability over the course of the century.
Introduction
Horticulture is a significant export sector for the New Zealand economy. For the year ending June 2016, horticultural exports were worth NZ$4,982 m; up from NZ$3,322 m in 2009 (MPI Citation2012, Citation2016). Over the same time, New Zealand kiwifruit exports grew from NZ$930 m to NZ$1,558 by 2016. However, globally, it has been recognised that climate change effects on winter temperature is an emerging risk to the economic yield for deciduous fruit crops (Luedeling et al. Citation2011). This is particularly so for those deciduous crops grown in warm temperate regions, such as kiwifruit (Kenny et al. Citation2000).
In New Zealand, over 90% of the industry production is based in the Bay of Plenty region, with over 50% of that located in an area around the Te Puke township (Cradock-Henry Citation2017). Production has predominantly been based on ‘Hayward’, a public domain cultivar derived from Actinidia chinensis var. deliciosa (Ferguson and Seal Citation2008). This cultivar is also grown commercially in other parts of the world. Historically, the climate and soils of the Te Puke area have been well suited to growing kiwifruit (Martin Citation2002). More specifically, the area has an ideal temperature regime with good winter chilling, warm springs and mild summers and autumns (Salinger and Kenny Citation1995). This is combined with high sunshine hours and evenly distributed rainfall on deep free-draining volcanic soils (Greaves Citation1985; Salinger et al. Citation1993).
The most critical temperature-related time of the year for Hayward kiwifruit production is the 3-month period May to July (Snelgar et al. Citation2008). The ‘coldness’ of this period has a very strong influence on the quantity of flowers per winter bud as well as the number of flowers and the timing of flowering. This is due to the direct influence of winter temperature on bud dormancy release processes that determine the timing of budbreak, and hence the number of fruit produced by the vine (Richardson et al. Citation2010). ‘Winter chilling’ is the term used to refer to how effective the cold of winter has been. For instance, a year of high winter chilling will generally mean more kiwifruit flowers, an earlier flowering period once warmer spring temperatures arrive, and often a more compacted flowering period (McPherson et al. Citation1994, Citation2001).
In New Zealand, the productivity of Hayward increased from an average of about 12.5 T/ha in 1980 to 30 T/ha in 2010, with the upper quartile of growers achieving 45 T/ha. This increase in productivity has been achieved by incorporating a range of plant husbandry and technology improvements into orchard management systems (Patterson and Currie Citation2010). Much of the initial increase in productivity was due to the introduction of a late winter application of the dormancy breaking chemical, hydrogen cyanamide (H2NC), to conventionally grown Hayward in the late 1980s (Doyle et al. Citation1989). Up until that time, the number of vegetative shoots and associated floral buds that broke bud was reduced in years with warmer winter conditions, in comparison to cooler winters (Salinger et al. Citation1993). For Hayward, the best budbreak has been shown to occur when excised dormant canes have been exposed to at least 950 h at or below 4°C (Linsley-Noakes and Allan Citation1987) or 850 h at or below 7°C (Lawes Citation1984).
Despite the general climatic suitability of the Te Puke township area, and the regular use of H2NC in the conventionally grown crop, the inter-annual variability in the amount of fruit produced between 2001/2002 and 2015/2016 had a coefficient of variability of about 18% (). A similar coefficient of variability value was also observed in the organically grown Hayward crop, although overall production per hectare was lower due to H2NC not being permitted for use on these orchards. Though some of this variability (especially in the last 5 years) has been the result of the impact of the incursion of the bacterial disease, Pseudomonas syringae pv. actinidiae (or Psa) (Everett et al. Citation2011), a significant contribution can also be attributed to abnormally above- or below-normal temperatures at critical growing times during the year.
Table 1. Productivity attributes for convention and organic Hayward kiwifruit grown in the Te Puke area and submitted to the Zespri export inventory between the 2001/2002 and 2015/2016 seasonsa.
Spraying H2NC on the vines gives an average of about 2°C of winter chilling benefit (Snelgar et al. Citation2008). In other words, during a relatively warm winter, the application of hydrogen cyanamide about 1 month prior to natural budbreak can yield a similar level of flower development compared with untreated vines in a season where the average May–July temperatures were around 2°C lower. The application of H2NC can also decrease season-to-season variability by reducing the percentage of lateral or side flowers that need to be removed by hand after colder winters (McPherson et al. Citation2001). However, H2NC use is becoming more restricted or banned in regions due to toxicity concerns (Ziosi et al. Citation2015). In New Zealand, the use of H2NC on fruit crops has been reviewed by regulators (Gaskin et al. Citation2006). Development of more sustainable practices to use this chemical have enabled ongoing access until more suitable dormancy release technologies become available. For organic growers, non-chemical techniques such as cane tipping have assisted in improving floral numbers in warm seasons, albeit not as effectively as H2NC (Manson and Snelgar Citation1995).
As air temperatures in New Zealand (and in the Te Puke area) continue to rise (New Zealand average annual temperature has risen by 0.9°C over the last 100 years), associated with global climate change (Reisinger and Kitching Citation2014), the potential for more years with marginal or poor winter chilling conditions steadily increases. New Zealand kiwifruit growers have already identified warming of winter temperatures as their largest climatic risk (Cradock-Henry Citation2017). This could put significant stress on the kiwifruit industry in the Te Puke area, particularly if the use of H2NC is banned. This study looks at the potential impact of projected changes to air temperature on kiwifruit production viability in Te Puke, and also looks at other areas in New Zealand where kiwifruit production viability may improve over the next several decades.
This study forms part of a larger research programme called ‘Climate Changes, Impacts and Implications for New Zealand to 2100’ (http://ccii.org.nz/) and was funded by the New Zealand Ministry for Business, Innovation and Employment (MBIE contract C01X1225).
Aims
The annual economic yield of kiwifruit is a function of genetics, environment and management. The aims of this study are to consider the impact of the environment (in terms of air temperature variation) and management (in terms of the application, or not, of H2NC). We only consider the green ‘Hayward’ kiwifruit, and are not considering any genetic improvements to this cultivar or replacement by other cultivars or related species. Also, for the purposes of this study we have ignored the ongoing management adaptions that the industry has made to climate change such as the selection of lower vigour wood types (Miller et al. Citation2001) and girdling (Snelgar and Manson Citation1992).
A simple temperature threshold-based empirical model has been developed for assessing current and future (to the year 2100) Hayward kiwifruit production viability for the Te Puke area. The model is derived from the phenology of the crop and published literature that relates temperature to four phenological stages of the Hayward vine development. The model includes the effects of applying, or not applying, hydrogen cyanamide (for simplicity, the model runs are labelled ‘with HC’ and ‘without HC’). The model is further used to look at potential future Hayward kiwifruit production viability over the entire country.
Methodology
The methodology has four stages. These are:
Stage 1 – seasonal ‘production risk’ temperature thresholds
A simple temperature index approach is used to identify threshold ‘production risk’ temperatures at Te Puke in four phenologically important seasons (Salinero et al. Citation2009), based on the historic period 1971–2000. The seasons are:
May–July (important for winter chilling and bud/flower numbers);
August–October (important for flower bud development and primary canopy growth);
November–January (important for flowering, fruit set, the cell division and differentiation phase of fruit development as well as canopy secondary growth); and
February–April (important for the enlargement phase of fruit development associated with pre-harvest maturation).
The second phenological stage, August–October, corresponds to the months associated with pre- and post-budbreak, primary shoot growth and flower bud development. In Te Puke, without the use of H2NC, the timing of natural budbreak occurs between mid- to late September (McPherson et al. Citation1994). Cool temperatures up to 40 days prior to budbreak have been shown to delay the timing of budbreak, as well as delay the time to flowering (Warrington and Stanely Citation1986). Temperature after budbreak is positively correlated with the rate of shoot and flower bud development (Morgan et al. Citation1985; McPherson et al. Citation1992). Controlled environment studies show the earliest and latest expanding leaves take about 40 and 70 days, respectively, from budbreak to expand fully (Greer Citation1996). Over this time, the rate of shoot growth and leaf area expansion increases with air temperature (Greer and Jeffares Citation1998). Flower buds are vulnerable to low air temperatures during this stage, with damage occurring after a 30-min exposure to −1.5°C to −2.0°C (Hewett and Young Citation1981).
The third phenological stage, November–January, is associated with flowering, pollination, fruit cell division and differentiation, as well as the growth of secondary and non-terminating shoots. For Te Puke, natural mid-bloom for Hayward vines occurs between early November and early December (McPherson et al. Citation1994). Cooler temperatures during flower bud development in male cultivars can affect pollen viability (Jansson and Warrington Citation1988). Warmer air temperature during the first stages of fruit development can advance the rate of fruit expansion, though these differences do not persist through to harvest (Snelgar et al. Citation1988). While warmer mean air temperature during shoot growth prior to flowering can increase subsequent dry matter development in fruit after fruit set, higher mean air temperature after fruit set can reduce dry matter accumulation in fruit (Snelgar et al. Citation2007). Once fruit set has occurred, increasing temperature can increase the rate of shoot elongation shoot growth while reducing the growth of fruit and dry weight accumulation (Snelgar et al. Citation2005). At this stage of fruit development, vegetative regrowth can compete strongly against fruit for the resources needed to support plant growth (Minchin et al. Citation2010). For Te Puke, the completion of the cell division and differentiation phase of fruit growth is completed about 60 days after mid-bloom (Bebbington et al. Citation2009).
The final phenological stage, February–April, relates to the fruit enlargement phase of growth and pre-harvest fruit maturation. During summer and autumn, the maximum rate of fruit growth occurs at an ambient temperature of 17°C, therefore increasing temperature above this value can reduce fruit growth (Snelgar et al. Citation2005). In April, when ambient temperatures can often be below 17°C in Te Puke, an increase in temperature can increase fruit growth. For Hayward, soluble solids content is an important determinant of harvest maturity. Prior to the use of H2NC, the date that an average soluble solids content of 6.2% was reached for Te Puke orchards was early- to mid-May (Snelgar et al. Citation1993). Depending on the clearance criteria (Lallu et al. Citation1989) and application of H2NC, the harvesting of Hayward orchards in the Te Puke area can start in early- to mid-April. The time that an orchard can reach a given soluble solids content, such as 6.5%, can be predicted from the mid-flowering date and mean half hourly air temperature records (Hall and McPherson Citation1997). This model found that the rate of increase in fruit soluble solids content halved with an increase of 3.75°C in air temperature. Pre-harvest exposure to temperatures below 7°C can have a benefit on the postharvest storage performance of Hayward by reducing the fruits susceptibility to low temperature breakdown (Burdon et al. Citation2007). Very low temperature events in autumn can also affect productivity. For example, mild frost in the autumn can cause premature leaf abscission, resulting in damage to fruit and crop loss if subsequent frost events occur (Pyke et al. Citation1986). Promotion of the pathogenicity of Pseudomonas syringae pv. actinidiae by spring or autumn frosts is a newly emerging risk with the establishment of this pathogen in New Zealand (Ferrante and Scortichini Citation2014).
For each 3-month season the threshold production risk temperatures are based on the median, and upper and lower quartiles of the average 3-month temperatures of the above periods, calculated over the 30-year period 1971–2000, using air temperature data from Te Puke. The easy interpretability of results is an important goal in this study. For this reason, a red/green (i.e. ‘high/low production risk’) seasonal temperature matrix was developed. shows this matrix.
Figure 1. The 4 × 4 seasonal temperature matrix, showing high (red) and low (green) Hayward kiwifruit production risk thresholds, based on quartiles of 3-month mean temperature at Te Puke. MJJ = May–July, etc.
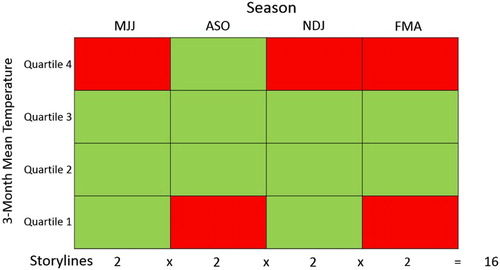
Within the cells defined by the quartile thresholds for each season, published literature and general knowledge from industry on the effect of temperature on the crop was used to define high/low risks to production. For example, in the season May–July, if the average temperature over these 3 months exceeded the upper quartile threshold (i.e. falls within the highest 25% of historic temperature values), then winter chilling was defined as being likely to be insufficient and the risk of a poor crop was assessed as high. This is supported by applying a model (McPherson et al. Citation2001) to predict flowers per winter bud using the May–July mean air temperature values, shown in , which found the upper quartile value had 6.4% and 3.7% less flowers per winter bud than the median value with or without H2NC, respectively.
Table 2. Seasonal temperature distribution for Te Puke, based on HadGEM2-ES/RCM simulated data for the period 1971–2000.
Similarly, for August–October, if the average temperature fell below the historic lower quartile value then this could result in poor early season canopy development or flower bud development (Hewett and Young Citation1981; Snelgar et al. Citation2005). Likewise, for November–January, too warm temperatures could lead to poor fruit development due to an excess of vegetative growth (Richardson et al. Citation2004); and for February–April, temperatures at either end of the distribution can adversely affect the timing of fruit maturation, harvest quality or crop loss (Pyke et al. Citation1986; Seager et al. Citation1991; Burdon et al. Citation2007).
Quartile-based thresholds were used for simplicity and ease of interpretation. It assumes that on average, since the 1970s, the climatic characteristics of the Te Puke region are suitable for Hayward production given the commercial viability and international competitiveness of the region’s kiwifruit orchards. An assumption is also made that when adverse seasonal climatic conditions occur, such as a warm winter, these conditions are likely to occur in the upper or lower quartile. However, if this degree of resolution is insufficient, it is very simple to adjust the thresholds to be based on quintiles, deciles or other percentiles, as required. Similarly, graduated thresholds could be introduced (e.g. a risk scale from 1 to 4, based on three thresholds), although such a variation would make the model more complex and conceivably make it more difficult to interrogate and interpret the results.
Stage 2 – temperature ‘storylines’ and ‘production viability scenarios’
The seasonal threshold temperatures are used to identify 16 unique growing year (May–April) temperature ‘storylines’, which are each linked to Hayward kiwifruit production risk. For example, a temperature storyline for a particular growing year might be as follows:
May–July (MJJ) average temperature greater than the upper quartile threshold (high risk)
August–October (ASO) average temperature in third quartile (low risk)
November–January (NDJ) average temperature in the second quartile (low risk)
February–April (FMA) average temperature in the second quartile (low risk)
Figure 2. Hayward kiwifruit production viability scenarios, based on the temperature threshold storylines. MJJ = May–July, etc.
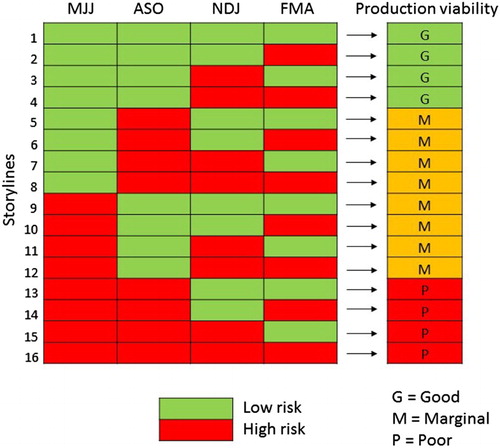
The delineation of the 16 storylines shown in yields a ratio of ‘good’ to ‘marginal’ to ‘poor’ Hayward production viability of 1:2:1, for Te Puke. This is reasonably consistent with general industry knowledge and the published literature discussed earlier. In about one quarter of years the climatic conditions would have resulted in a good commercial crop that has required little vine remedial management interventions; in about half of the years the crop would be viable but requires a lot of vine management; while in about one quarter of years the climatic conditions have resulted in a relatively poor crop, despite crop management interventions.
Historically, the major risks to producing a poor crop have related to frost damage in the spring and poor winter chilling. For example, in the Te Puke region, a spring frost in late September of 2002 resulted in over 350 frost insurance claims that ranged from 30% to 100% crop loss. The warmest winter in the Te Puke region since 1971 was 1998. That growing season, flower bud numbers per m2 were significantly lower across the kiwifruit growing region, with the subsequent national export crop reduced by 14.5% when compared against the exports for previous and following years. This is the reason why our ‘poor’ production viability scenarios (storylines 13–16, ) are all associated with high-risk temperatures during both these critical seasons. Other combinations of high-risk temperatures during the growing year result in marginal or good production viability scenarios, because the potential impact is related to a reduction or delay in product quality, rather than crop loss.
The introduction of payments for the dry matter content of fruit has exposed growers to greater weather-related risks (Hall and Snelgar Citation2007). Adoption of management practices such as the selection of low vigour wood types, girdling, reflective mulches (Patterson and Currie Citation2010) can assist in the adaption by growers to the effect of climate change. The effect of climate change on pest and disease risks in kiwifruit growing regions is also expected to create additional adaption responses by growers (Gerard et al. Citation2013). For the purposes of this study, ongoing advances in such vine, pest and disease management are ignored in relation to comparing current and future climate scenarios on Hayward production. This allows a prediction of what could happen if growers did not adapt to future climate change.
Stage 3 – projections of future kiwifruit viability for Te Puke
The model was run using simulated temperatures derived from NIWA’s Regional Climate Model (RCM; an introduction to regional climate modelling in New Zealand is presented in the next section) for the Te Puke area for the period 1971–2100. The threshold values are calculated based on the RCM ‘historic’ data from the period 1971 to 2000. This ensures consistency when looking at the changes over the whole 130-year period. The RCM-based analysis is used to assess the potential impacts on kiwifruit production viability at Te Puke on a simulated decade-by-decade basis over the entire twenty-first century.
Programmatically, applying hydrogen cyanamide has the effect of lowering the MJJ mean temperature by 2°C. This can only change a ‘poor’ year into a ‘marginal’ year, since a ‘good’ year is defined as needing very little vine management. The model also includes a general MJJ mean temperature threshold of 14°C, above which the production viability is set to ‘poor’ (no matter what happens in the other three seasons).
The results for Te Puke are shown as graphs of the number of ‘good’, ‘marginal’ and ‘poor’ production viability years per decade, from 1971 to 2100. Results from different Global Climate Models (GCMs) and Representative Concentration Pathways (RCPs) are shown on the same graphs, so that climate model and future atmospheric greenhouse gas concentration uncertainty can be assessed.
Stage 4 – mapping of future kiwifruit viability for the whole country
A significant advantage of using the NIWA RCM is that there are simulated temperature data for the entire country on a grid resolution of around 5 km. Thus, kiwifruit production viability can be mapped for the entire country for every year of the 130-year simulation period 1971–2100. This has been done for every combination of six GCMs and four RCPs (see next section for definitions), as well as with or without hydrogen cyanamide. Prior to this mapping exercise, an additional step was added to the model which was not required for the Te Puke site analysis. This was to add a temperature limitation below which kiwifruit would not be viable at all (without this step the maps would show that growing areas could include the top of the Southern Alps).
There have been many detailed crop modelling studies looking at specific climatic responses to the growth stages of Hayward kiwifruit (Hall et al. Citation2001). These models can include complex formulae and may need multiple climate variables (e.g. temperature, solar radiation, vapour pressure and humidity) as data input. Growing degree days (or GDD) is a common temperature-based (or ‘thermal’) index used to assess crop suitability (Snyder et al. Citation1999). In keeping with the ‘simple empirical model’ axiom of this study, an overall temperature limitation of at least 850 GDD (annual total, based on a 10°C mean daily temperature) was chosen as a reasonable value for kiwifruit viability. Hall et al. (Citation2001) reported that at annul GDD (base 10°C) values below 850 there is a ‘good chance that the mean dry matter percentage will be less than 14%’ (the threshold at that time required for Hayward kiwifruit grade 1 standard (note: this threshold has subsequently increased to 15.5%)).
shows a map of the mean annual GDD (base 10°C), where the two colours show the areas of New Zealand above (green) and below (fawn) the 850 GDD viability threshold. It is important to note that the green areas are where there is the potential for growing Hayward kiwifruit, based purely on temperature. There may well be several other reasons why viability in these areas is low (e.g. soil type, drainage, slope, aspect, wind, solar radiation, insufficient rainfall or irrigation potential), but these factors are not being taken into account here.
Figure 3. Map of the mean annual growing degree days (base 10°C) for New Zealand, based on the period 1981–2010, showing areas above (green) and below (fawn) 850 GDD. Also shown are 14°C contours of the mean November–January (NDJ) and February–April (FMA) temperature, based on the same 30-year period.
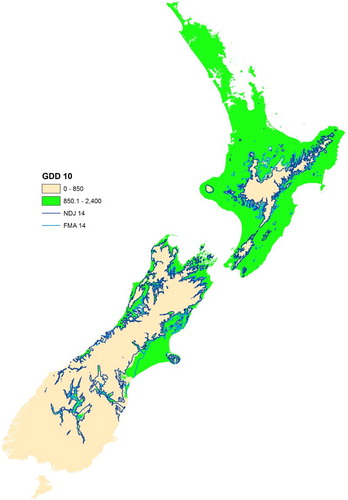
Also shown on are two contour lines, representing the 14°C isotherms of the mean November–January (NDJ) and February–April (FMA) temperature. Testing a number of temperature thresholds for different seasons, these two isotherms most closely matched the 850 GDD (base 10°C) boundary. Of these two, the November–January isotherm was selected as the closest representation, and hence proxy index, of the 850 GDD (base 10°C) viability threshold. Use of the 14°C NDJ mean temperature simplified the model significantly, as this variable is already calculated for use in the seasonal temperature matrix and viability scenario analysis.
As mentioned above, kiwifruit production viability using this simple temperature threshold-based empirical model has been mapped for the entire country for every year of the simulation period 1971–2100. To aid the investigation of these maps, a web-based application has been created. is a screen image of the application, which can be accessed at https://well-shny-vp.shinyapps.io/CCII/.
Figure 4. Simulated year-by-year Hayward kiwifruit production viability for 1971–2100 map application, available at https://well-shny-vp.shinyapps.io/CCII/.
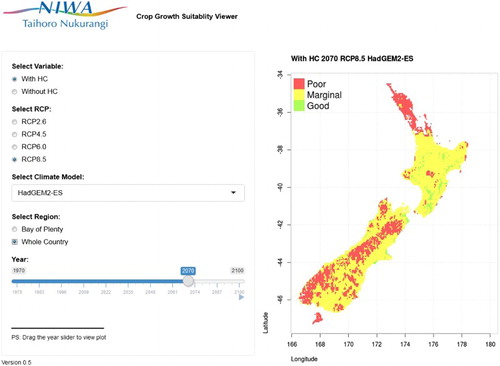
The web-based application has a menu or ‘radio buttons’ where the user can select with or without hydrogen cyanamide, a particular RCP, a particular climate model, and either the Bay of Plenty region or the whole country. The slider can then be dragged to a specific year, or the ‘play’ button can be pressed to start a map animation sequence (and ‘paused’ to stop it). The resultant map shows the Hayward kiwifruit production viability map associated with the particular options selected.
Lastly, the future kiwifruit production viability maps for each year have been summarised by making maps of the six-global-model average number of ‘good or marginal’ viability years in each of the following 20-year time slices:
1986–2005 (current);
2016–2035 (near future);
2046–2065 (mid-century); and
2081–2100 (end-century).
An introduction to regional climate modelling
Regional climate models (RCMs) are high-resolution physical models of the climate for a limited area of the globe. Typically the spatial resolution might range from 30 to 50 km, which contrasts to a General Circulation Model (GCMFootnote1) which might have a resolution of about 100 to 300 km. Unlike many GCMs, RCMs do not include the simulation of an interactive ocean. They simulate the main atmospheric-land processes that influence climate. RCMs are usually nested within a GCM, with atmosphere and ocean state variables such as sea-surface temperature, atmospheric temperature, winds and humidity from the GCM being used to prescribe values at the surface and lateral boundaries of the RCM – imagine atmospheric state variables being prescribed at the ‘curtain’ around the edge of the RCM and ocean state variables prescribed at the ‘floor’ of the RCM.
NIWA uses an RCM developed by the United Kingdom Met Office (UKMO) to simulate New Zealand climate under historic and future conditions. To date, there have been continuous model runs of daily data (maximum and minimum air temperature, rainfall, wind, humidity, atmospheric pressure and solar radiation) from 1971 to 2100 (and sometimes beyond) using boundary conditions derived from six GCMs and four RCPsFootnote2. RCPs are prescribed pathways of atmospheric greenhouse gas concentrations out to the end of the century. The four RCPs span a range from concentrations consistent with very high radiative forcing of 8.8 W/m2 by 2100 (RCP8.5) to concentrations in 2100 consistent with limiting global warming to 2°C above pre-industrial levels (RCP2.6).
The six GCMs selected were chosen from a larger set of models (around 40) that submitted their output data to the Coupled Model Intercomparison Project 5 (CMIP5), for use by researchers for the IPCC Fifth Assessment Report (AR5). The six models are:
NorESM1-M (Norway)
GISS-EL-R (USA)
GFDL-CM3 (USA)
BCC-CSM1.1 (China)
CESM1-CAM5 (USA)
HadGEM2-ES (UK)
NIWA has invested a lot of effort into looking at biases in GCM and RCM output, and generating bias-corrected datasets (Sood Citation2017). These bias-corrected datasets have also been subsequently downscaled from the RCM grid resolution (30 km) to the finer 5 km grid resolution of the VCSN dataset.Footnote3 While all the RCM-derived data used for this study are at the 5 km spatial scale, not all variables will have been bias corrected.Footnote4
Results
lists the median, upper and lower quartile air temperatures, using the HadGEM2-ES/RCM-based simulated data for each 3-month season for the period 1971–2000 for Te Puke. The table also highlights the key thresholds associated with the seasonal temperature matrix () for identifying production risk. Similar tables were generated for the other five GCMs. Note, because each GCM produces simulated temperatures for the entire 130-year period 1971–2100, the quartile values shown in do vary depending upon the GCM. However, the variation between models is not large because the data are all bias-corrected using VCSN dataset.
The seasonal interquartile ranges shown in (rounded to 1 decimal place) are: 0.5°C (MJJ), 0.4°C (ASO), 0.6°C (NDJ) and 0.6°C (FMA). In comparison, using actual temperature data from Te Puke (concatenated from two closed and one open climate station) for the period 1973–2000 (a similar period to that used for ), the same interquartile ranges are: 0.8°C (MJJ), 0.8°C (ASO), 0.9°C (NDJ) and 1.1°C (FMA). The higher interquartile ranges of the observed data are due to local site factors which enhance variability and are not resolved by the GCM/RCM simulations and downscaled products, respectively.
Using the MJJ values from and projected temperatures out to 2100 based on RCP8.5, shows how the decadal frequency of each temperature quartile for this very important season is projected to change over the 130-year period 1971–2100.
Figure 5. The number of years per decade with mean MJJ temperatures in each of the four 1971–2000 quartile bands, based on HadGEM2-ES/RCM RCP8.5 simulated data for Te Puke. The year on the X-axis is the last year of the decade (i.e. 1980 = 1971–1980).
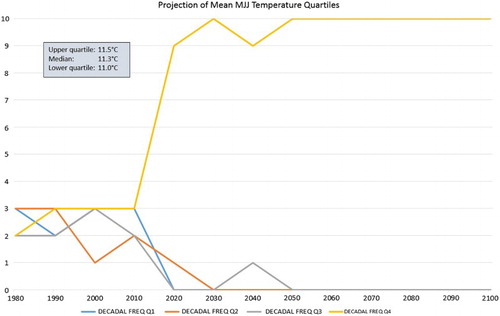
shows that there is an even distribution of years in each temperature quartile in the first four decades, as would be expected since the quartile thresholds are defined based on the period 1971–2000. However, thereafter there is a very fast transition to a dominance of quartile 4 temperatures for the MJJ season. From 2050 onwards, the mean MJJ temperature for Te Puke, based on HadGEM2-ES/RCM RCP8.5 simulated data, is greater than the 1971–2000 upper quartile value for all years.
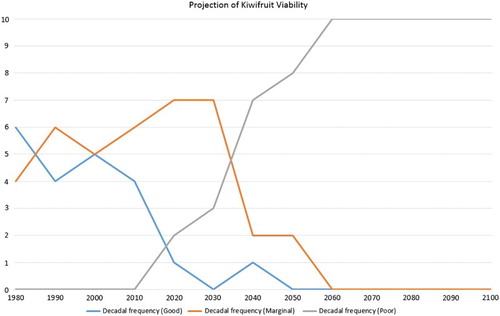
Looking at the Hayward kiwifruit production viability scenarios shown in , the above result means that viability is projected (for this particular simulation and RCP) to be ‘marginal’ at best at this location from mid-century onwards (storylines 9–16). In fact, shows that in the 2030s around half the years are ‘poor’ (when the mean MJJ temperature exceeds the general threshold of 14°C), and by the 2060s, all years are in this viability category.
Figure 6. The number of years per decade with ‘good’, ‘moderate’ and ‘marginal’ production viability for Hayward kiwifruit, based on HadGEM2-ES/RCM RCP8.5 simulated data for Te Puke. The year on the X-axis is the last year of the decade (i.e. 1980 = 1971–1980).
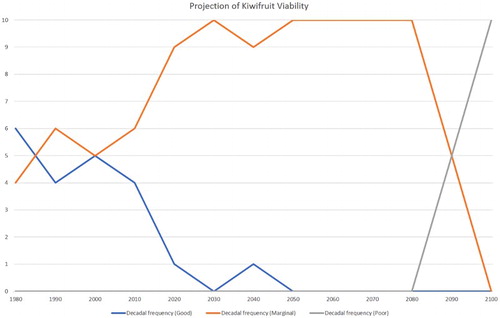
If hydrogen cyanamide is applied to the vines, then the production viability projections shown in change to those shown in . This clearly demonstrates the value of applying the chemical to artificially enhance the winter chilling effect, with production viability remaining ‘marginal’ all the way to near the end of the century.
Figure 7. As for , but including the effect of applying hydrogen cyanamide.
It is not sufficient to only examine the results based on one climate model and RCP, as has been done so far. Fortunately, there are six climate models available for analysis and four RCPs. Exploring firstly the inter-climate model variations, shows the decadal frequency of ‘marginal’ production viability at Te Puke, over the period 1971–2100, for each of the six GCMs.
Figure 8. The number of years per decade with ‘poor’ production viability for Hayward kiwifruit for all six GCMs, based on RCM RCP8.5 simulated data for Te Puke and no application of hydrogen cyanamide. The year on the X-axis is the last year of the decade (i.e. 1980 = 1971–1980).
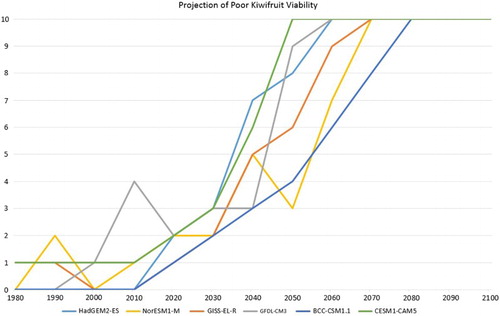
This shows that while there is some inter-model variability, there is also a very consistent overall pattern of (for the RCP8.5 scenario) a steadily increasing frequency of ‘poor’ production viability through the middle part of the century, ending with all years being poor.
examines the variation of ‘poor’ viability for the four RCPs. Only the HadGEM2-ES model is shown to avoid cluttering the plot, but the same general pattern is present for the other five GCMs.
Figure 9. As for , but showing all four RCPs for the HadGEM2-ES model.
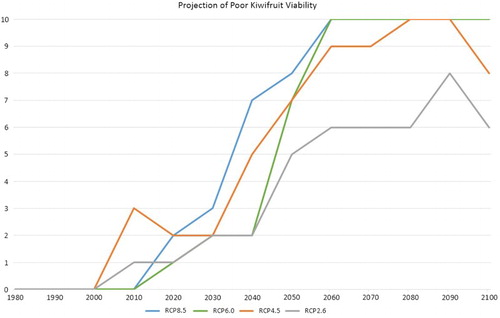
This plot shows that RCPs 4.5, 6.0 and 8.5 have a similar profile, while the only RCP that does not yield a full 10 years in a decade with ‘poor’ production viability is RCP2.6. This is the greenhouse gas concentration pathway which was designed to match the goal of limiting the global mean temperature increase to 2°C above pre-industrial levels, requiring significant reductions in global emissions (plus removal of CO2 from the atmosphere).
In summary, based on this modelling approach, Hayward kiwifruit production viability for the Te Puke area is shown to steadily decrease over time and becomes consistently marginal by the 2030s and mostly poor by the end of the century. The key reason for this is the loss of sufficient winter chilling as the climate warms. However, areas further inland in the Bay of Plenty as well as several other locations around the country, such as Waikato, Hawkes Bay, Wanganui, Canterbury and Central Otago show an increase in production viability (based purely on temperature) for this crop variety over the century.
show maps of the number of ‘good or marginal’ Hayward kiwifruit production viability years with and without spraying hydrogen cyanamide for two 20-year periods: 2046–2065 (mid-century) and 2081–2100 (end-century). These maps are based on the average of all six GCMs and RCP8.5.
Figure 10. The number of ‘good or marginal’ Hayward kiwifruit production viability years for the period 2046–2065, based on the average of all six GCMs and RCP8.5 (without HC).
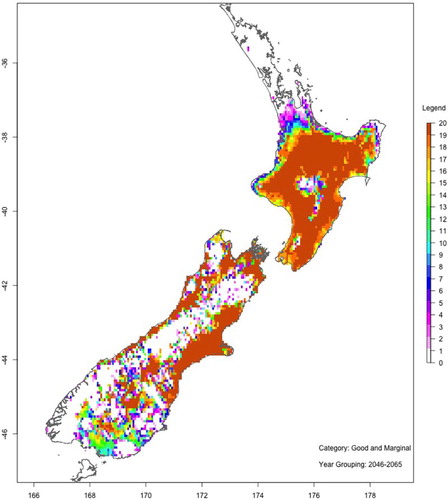
Figure 11. As for , but with HC.
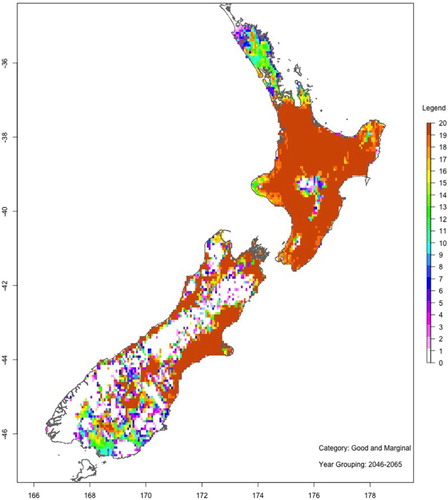
Figure 12. As for , but for the period 2081–2100.
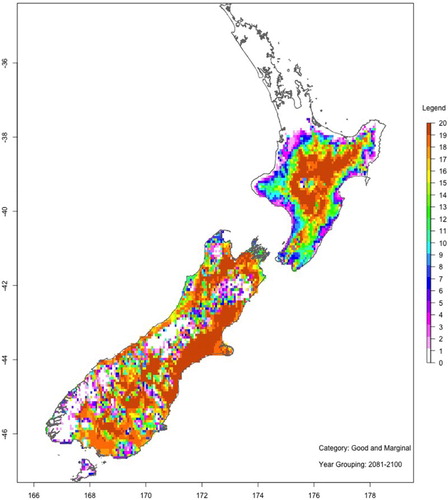
Figure 13. As for , but with HC.
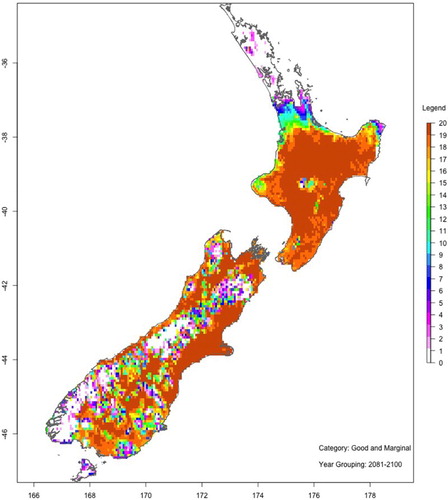
Conclusions
The aim of this study was to develop a simple temperature threshold-based empirical model for assessing current and future (to the year 2100) Hayward kiwifruit production viability for the Te Puke area, including the effects of applying, or not applying, the dormancy release chemical H2NC. The model was also extended to assess future projections of the potential production viability of Hayward kiwifruit over the entire country.
The relative simplicity of the model has the advantage that it is easy to understand and interpret. It can also easily be used with simulated temperature data output from climate models. The model simplicity could also be a disadvantage in that many of the factors that determine kiwifruit production viability, such as soil fertility and drainage, slope, solar radiation, wind and humidity, are not considered. Furthermore, factors such as proximity to ports and other infrastructure as well as access to a labour force, water resources and suitable land are not included. Moreover, advances in vine management practices (including plant breeding) being made by growers as they adapt to climate change are also ignored in the current model.
The results of this study clearly show that Hayward kiwifruit production viability in Te Puke and nearby environs is very likely to become ‘marginal’ by the middle of the century and generally poor by its end, as temperatures continue to increase. This result is entirely consistent with the previous CLIMPACTS study (which was based on older climate models and emission scenarios; Hall et al. Citation2001). Application of hydrogen cyanamide greatly enhances the long-term viability, but there is a risk that the chemical may be banned from use. If this happens soon, then there is an urgent need to consider the viability of kiwifruit production in other areas of the country, alongside genetic improvement through the introduction of low-winter chill requirement traits.
Based on the model used here, areas further inland in the Bay of Plenty show potential for becoming more viable in the future, as do other currently cooler parts of the country including Canterbury and Central Otago (which look viable even without the application of hydrogen cyanamide). Of course, detailed site-specific viability investigations, taking all production factors into account, would be required to assess the true potential for these other locations. Nevertheless, it seems clear that through good planning, the New Zealand kiwifruit industry is very likely to remain viable for many decades to come.
Disclosure statement
No potential conflict of interest was reported by the authors.
Additional information
Funding
Notes
1 For more information on GCMs, see http://www.ipcc-data.org/guidelines/pages/gcm_guide.html.
2 For more information on RCPs, see: http://sedac.ipcc-data.org/ddc/ar5_scenario_process/RCPs.html.
3 See this webpage for more info on VCSN data: https://www.niwa.co.nz/our-science/climate/our-services/virtual-climate-stations.
4 Currently, only temperature and rainfall have been bias-corrected, but other variables will be added over time.
References
- Bebbington M, Hall AJ, Lai CD, Zitikis R. 2009. Dynamics and phases of kiwifruit (Actinidia deliciosa) growth curves. New Zealand Journal of Crop and Horticultural Science. 37(3):179–188. doi: 10.1080/01140670909510263
- Burdon J, Lallu N, Francis K, Boldingh H. 2007. The susceptibility of kiwifruit to low temperature breakdown is associated with pre-harvest temperatures and at-harvest soluble solids content. Postharvest Biology and Technology. 43(3):283–290. doi: 10.1016/j.postharvbio.2006.09.011
- Cradock-Henry NA. 2017. New Zealand kiwifruit growers’ vulnerability to climate and other stressors. Regional Environmental Change. 17(1):245–259. doi: 10.1007/s10113-016-1000-9
- Doyle CJ, Moore WB, Henzell RF. 1989. Modelling the economic consequences of potential management changes in a mature kiwifruit orchard in New Zealand. Agricultural systems. 31(4):321–347. doi: 10.1016/0308-521X(89)90033-4
- Everett KR, Taylor RK, Romberg MK, Rees-George J, Fullerton RA, Vanneste JL, Manning MA. 2011. First report of Pseudomonas syringae pv. actinidiae causing kiwifruit bacterial canker in New Zealand. Australasian Plant Disease Notes. 6(1):67–71. doi: 10.1007/s13314-011-0023-9
- Ferguson AR, Seal AG. 2008. Kiwifruit. In: Hancock J, editor. Temperate fruit crop breeding. Springer; p. 235–264.
- Ferrante P, Scortichini M. 2014. Frost promotes the pathogenicity of Pseudomonas syringae pv. actinidiae in Actinidia chinensis and A. deliciosa plants. Plant pathology. 63(1):12–19. doi: 10.1111/ppa.12070
- Gaskin RE, Manktelow DWL, Steele KD. 2006. Adjuvant and application technologies to minimise off-target drift from kiwifruit sprays. New Zealand Plant Protection. 59:217.
- Gerard PJ, Barringer JRF, Charles JG, Fowler SV, Kean JM, Phillips CB, Tait AB, Walker GP. 2013. Potential effects of climate change on biological control systems: case studies from New Zealand. BioControl. 58(2):149–162. doi: 10.1007/s10526-012-9480-0
- Greaves AJ. 1985. Root distribution of kiwifruit (Actinidia deliciosa) in a deep sandy loam soil of the Te Puke district, New Zealand. New Zealand Journal of Agricultural Research. 28(3):433–436. doi: 10.1080/00288233.1985.10430449
- Greer DH. 1996. Photosynthetic development in relation to leaf expansion in kiwifruit (Actinidia deliciosa) vines during growth in a controlled environment. Functional Plant Biology. 23(5):541–549.
- Greer DH, Jeffares D. 1998. Temperature-dependence of carbon acquisition and demand in relation to shoot growth of kiwifruit (Actinidia deliciosa) vines grown in controlled environments. Functional Plant Biology. 25(7):843–850.
- Hall A, Snelgar B. 2007, July. Temperature effects on kiwifruit dry matter at harvest. Acta Horticulturae. 803:155–162.
- Hall AJ, Kenny GJ, Austin PT, McPherson HG. 2001. Changes in kiwifruit phenology with climate. In: Warrick RA, Kenny GJ, Harman JJ, editors. The effects of climate change and variation in New Zealand: an assessment using the CLIMPACTS system. Hamilton: The International Global Change Institute (IGCI), University of Waikato; p. 33–46.
- Hall AJ, McPherson HG. 1997. Predicting fruit maturation in kiwifruit (Actinidia deliciosa). Journal of Horticultural Science. 72(6):949–960. doi: 10.1080/14620316.1997.11515587
- Hewett EW, Young K. 1981. Critical freeze damage temperatures of flower buds of kiwifruit (Actinidia chinensis planch.). New Zealand Journal of Agricultural Research. 24(1):73–75. doi: 10.1080/00288233.1981.10420873
- IPCC. 2013. Summary for policymakers. In: Stocker TF, Qin D, Plattner G-K, Tignor M, Allen SK, Boschung J, Nauels A, Xia Y, Bex V and Midgley PM, editors. Climate change 2013: the physical science basis. Contribution of working group I to the fifth assessment report of the Intergovernmental Panel on Climate Change. Cambridge: Cambridge University Press.
- Jansson DM, Warrington IJ. 1988. The influence of temperature during floral development and germination in vitro on the germinability of kiwifruit pollen. New Zealand Journal of Experimental Agriculture. 16(3):225–230. doi: 10.1080/03015521.1988.10425644
- Kenny GJ, Warrick RA, Campbell BD, Sims GC, Camilleri M, Jamieson PD, Mitchell ND, McPherson HG, Salinger MJ. 2000. Investigating climate change impacts and thresholds: an application of the CLIMPACTS integrated assessment model for New Zealand agriculture. Climatic Change. 46(1):91–113. doi: 10.1023/A:1005576910408
- Lallu N, Searle AN, Macrae EA. 1989. An investigation of ripening and handling strategies for early season kiwifruit (Actinidia deliciosa cv Hayward). Journal of the Science of Food and Agriculture. 47(4):387–400. doi: 10.1002/jsfa.2740470402
- Lawes GS. 1984. Winter temperatures and kiwifruit bud development. Orchardist of New Zealand. 57:110.
- Linsley-Noakes GC, Allan P. 1987. Effects of winter temperatures on flower development in two clones of kiwifruit (Actinidia deliciosa (A. chev.) CF liang et AR ferguson). Scientia Horticulturae. 33(3):249–260. doi: 10.1016/0304-4238(87)90072-0
- Luedeling E, Girvetz EH, Semenov MA, Brown PH, Traveset A. 2011. Climate change affects winter chill for temperate fruit and nut trees. PloS one. 6(5):e20155. doi: 10.1371/journal.pone.0020155
- Manson PJ, Snelgar WP. 1995. Regional variations in the response of kiwifruit vines to time of cane tipping. New Zealand Journal of Crop and Horticultural Science. 23(1):67–71. doi: 10.1080/01140671.1995.9513869
- Martin RA. 2002. The production and marketing of New Zealand kiwifruit. Acta Horticulturae. 610:25–28.
- Mcpherson HG, Hall AJ, Stanley CJ. 1992. The influence of current temperature on the time from bud break to flowering in kiwifruit (Actinidia deliciosa). Journal of Horticultural Science. 67(4):509–519. doi: 10.1080/00221589.1992.11516277
- McPherson HG, Hall AJ, Stanley CJ. 1994. Seasonal and regional variation in budbreak and flowering of kiwifruit vines in New Zealand. New Zealand Journal of Crop and Horticultural Science. 22(3):263–276. doi: 10.1080/01140671.1994.9513835
- McPherson HG, Jill Stanley C, Warrington IJ. 1995. The response of bud break and flowering to cool winter temperatures in kiwifruit (Actinidia deliciosa). Journal of Horticultural Science. 70(5):737–747.
- McPherson HG, Snelgar WP, Manson PJ, Snowball AM. 1997. Bud respiration and dormancy of kiwifruit (Actinidia deliciosa). Annals of Botany. 80(4):411–418. doi: 10.1006/anbo.1997.0455
- McPherson HG, Richardson AC, Snelgar WP, Currie MB. 2001. Effects of hydrogen cyanamide on budbreak and flowering in kiwifruit (Actinidia deliciosa ’Hayward'). New Zealand Journal of Crop and Horticultural Science. 29(4):277–285. doi: 10.1080/01140671.2001.9514189
- Miller SA, Broom FD, Thorp TG, Barnett AM. 2001. Effects of leader pruning on vine architecture, productivity and fruit quality in kiwifruit (Actinidia deliciosa cv. Hayward). Scientia Horticulturae. 91(3):189–199. doi: 10.1016/S0304-4238(01)00259-X
- Minchin PEH, Snelgar WP, Blattmann P, Hall AJ. 2010. Competition between fruit and vegetative growth in Hayward kiwifruit. New Zealand Journal of Crop and Horticultural Science. 38(2):101–112. doi: 10.1080/01140671003781728
- MPI. 2012. Situation and outlook for primary industries. ISBN 978-0-478-38854-1. 53 p.
- MPI. 2016. Situation and outlook for primary industries. ISBN 978-1-77665-278-5. 84 p.
- Morgan DC, Warrington IJ, Halligan EA. 1985. Effect of temperature and photosynthetic photon flux density on vegetative growth of kiwifruit (Actinidia chinensis). New Zealand Journal of Agricultural Research. 28(1):109–116. doi: 10.1080/00288233.1985.10427003
- Mullan B, Dean S, Stuart S. 2013a. How good are the CMIP5 models? Abstract and presentation for New Zealand Climate Change Centre Conference; Jun 4–5, Palmerston North.
- Mullan B, Dean S, Stuart S. 2013b. Validation of 5th assessment global climate models in the New Zealand region. Abstract and presentation for Joint Conference of the NZ Hydrological Society and Meteorological Society of NZ; Nov 19–22; Palmerston North (Conference Handbook, p. 152–153).
- Patterson KJ, Currie MB. 2010, September. Optimising kiwifruit vine performance for high productivity and superior fruit taste. Acta Horticulturae. 913:257–268.
- Pyke NB, Stanley CJ, Warrington IJ. 1986. Kiwifruit: frost tolerance of plants in controlled frost conditions. New Zealand Journal of Experimental Agriculture. 14(4):443–447. doi: 10.1080/03015521.1986.10423063
- Reisinger A, Kitching R. 2014. Chapter 25. Australasia. In: Barros VR, Field CB, Dokken DJ, Mastrandrea MD, Mach KJ, Bilir TE, Chatterjee M, Ebi KL, Estrada YO, Genova RC, et al., editors. Climate change 2014: impacts, adaptation, and vulnerability. Part B: regional aspects. Contribution of working group II to the fifth assessment report of the Intergovernmental Panel on Climate Change, Chapter 24. Cambridge: Cambridge University Press; p. 1371–1438.
- Richardson AC, Marsh KB, Boldingh HL, Pickering AH, Bulley SM, Frearson NJ, Ferguson AR, Thornber SE, Bolitho KM, Macrae EA. 2004. High growing temperatures reduce fruit carbohydrate and vitamin C in kiwifruit. Plant, Cell & Environment. 27(4):423–435. doi: 10.1111/j.1365-3040.2003.01161.x
- Richardson AC, Walton EF, Meekings JS, Boldingh HL. 2010. Carbohydrate changes in kiwifruit buds during the onset and release from dormancy. Scientia horticulturae. 124(4):463–468. doi: 10.1016/j.scienta.2010.02.010
- Salinero MC, Vela P, Sainz MJ. 2009. Phenological growth stages of kiwifruit (Actinidia deliciosa ‘Hayward’). Scientia Horticulturae. 121(1):27–31. doi: 10.1016/j.scienta.2009.01.013
- Salinger MJ, Kenny GJ. 1995. Climate and kiwifruit cv. ‘Hayward’ 2. Regions in New Zealand suited for production. New Zealand Journal of Crop and Horticultural Science. 23(2):173–184. doi: 10.1080/01140671.1995.9513884
- Salinger MJ, Kenny GJ, Morley-Bunker MJ. 1993. Climate and kiwifruit cv. ‘Hayward’ 1. Influences on development and growth. New Zealand Journal of Crop and Horticultural Science. 21(3):235–245. doi: 10.1080/01140671.1993.9513775
- Seager NG, Hewett EW, Warrington IJ, MacRae EA. 1991. The effect of temperature on the rate of kiwifruit maturation using controlled environments. Acta Horticulturae. 297:247–254.
- Snelgar WP, Bayley GS, Manson PJ. 1988. Temperature studies on kiwifruit vines using relocatable greenhouses. New Zealand Journal of Experimental Agriculture. 16(4):329–339. doi: 10.1080/03015521.1988.10425660
- Snelgar WP, Hall AJ, Ferguson AR, Blattmann P. 2005. Temperature influences growth and maturation of fruit on ‘Hayward’ kiwifruit vines. Functional Plant Biology. 32(7):631–642. doi: 10.1071/FP05062
- Snelgar WP, Hall AJ, McPherson HG. 2008. Modelling flower production of kiwifruit (Actinidia deliciosa) from winter chilling. New Zealand Journal of Crop and Horticultural Science. 36(4):273–284. doi: 10.1080/01140670809510244
- Snelgar WP, Hall AJ, Richardson AC, Currie MB. 2007. Influence of temperature on between-season variation in dry matter content of ‘Hayward’ kiwifruit. Acta Horticulturae. 753:383–388. doi: 10.17660/ActaHortic.2007.753.48
- Snelgar WP, Hopkirk G, McPherson HG. 1993. Predicting harvest date for kiwifruit: variation of soluble solids concentration with mean temperature. New Zealand Journal of Crop and Horticultural science. 21(4):317–324. doi: 10.1080/01140671.1993.9513788
- Snelgar WP, Manson PJ. 1992. Determination of the time of flower evocation in kiwifruit vines. New Zealand Journal of Crop and Horticultural Science. 20(4):439–447. doi: 10.1080/01140671.1992.10418062
- Snelgar WP, Manson PJ, McPherson HG. 1997. Evaluating winter chilling of kiwifruit using excised canes. Journal of Horticultural Science. 72(2):305–315. doi: 10.1080/14620316.1997.11515517
- Sood A. 2017. Improved bias corrected and downscaled regional climate model data for climate impact studies: validation and assessment for New Zealand (under review).
- Snyder RL, Spano D, Cesaraccio C, Duce P. 1999. Determining degree-day thresholds from field observations. International Journal of Biometeorology. 42(4):177–182. doi: 10.1007/s004840050102
- Warrington IJ, Stanley CJ. 1986. The influence of pre-and post-budbreak temperatures on flowering in kiwifruit. Acta Horticulturae. 175:103–108. doi: 10.17660/ActaHortic.1986.175.15
- Ziosi V, Di Nardo A, Fontana A, Vitali F, Costa G. 2015. Effect of BLUPRINS® application on Bud release from dormancy in kiwifruit, cherry, and table grape. In: Anderson J, editor. Advances in plant dormancy. Springer International; p. 301–308.