
ABSTRACT
Pseudomonas syringae pv. actinidiae (Psa) causes bacterial canker of kiwifruit, currently the most important disease of Actinidia species worldwide. Due to the risk of Psa being associated with plant material moved from Psa-affected regions, there is a need to understand the behaviour and survival of Psa within tissue cultured plants, and identify detection or intervention points within the propagation process. In this study, we evaluate the ability of Psa to grow on plant culture media, assess the movement of Psa within in vitro growing plants, investigate the detection threshold of Psa and model the likelihood of false negatives when screening for Psa. Following inoculation of in vitro growing plants, even of genotypes considered Psa resistant, the bacteria spread rapidly through growing shoots. Standard plant tissue culture media did not support easily visible growth of Psa, however, supplementing these with peptone promoted Psa growth, providing a rapid, non-destructive visual indicator of its presence.
Introduction
The bacterial plant pathogen Pseudomonas syringae pv. actinidiae (Psa) is the causal agent of kiwifruit canker, a damaging disease of Actinidia species in a number of countries. It has spread relatively rapidly around the world, being first reported in Asia (Japan) in the 1980s (Takikawa et al. Citation1989), in Europe (Italy) in the 1990s (Scortichini Citation1994) and in Australasia (New Zealand) in 2010 (Everett et al. Citation2011). Actinidia propagation material, eg budwood, is considered the main pathway for long-distance spread and is suspected to be the source of outbreaks in France, Spain and Switzerland, whilst in Italy there are suggestions that tissue cultured plants may have been a source of Psa infection (EPPO Citation2012).
On orchard, kiwifruit canker is characterised by leaf spots (brown necrotic spots, with or without halos, or dark brown angular spots), bud rot, blossom blight, cane dieback, cankers and the production of red or white exudates (Serizawa et al. Citation1989; Scortichini Citation1994). There is little information on the symptoms in tissue culture plantlets contaminated with Psa though some reports are that affected kiwifruit plantlets are asymptomatic. Minardi et al. (Citation2012) micropropagated Actinidia chinensis var. deliciosa ‘Hayward’ and found that at a low inoculum concentration Psa asymptomatically colonised the plant tissue without visible contamination of the plant growth medium. They also found that Psa survived through seven in vitro transfers over a 2-year period without symptoms appearing on the plants (Minardi et al. Citation2015).
Although there is a perception that in vitro growing plants are ‘sterile’, it is known that in vitro growing plants can host endophytic bacteria asymptomatically and without contamination of the plant growth medium (Debergh & Vanderschaeghe Citation1988; Cooke et al. Citation1992; Orlikowska et al. Citation2017). Pseudomonads are known as bacterial contaminants of many plant micropropagation systems; species recorded include P. fluorescens, P. cepacia, P. paucimobilis and P. putida (Leifert et al. Citation1989; Leifert et al. Citation1991a). Pseudomonas syringae pv. syringae (Pss) has been reported in micropropagated Actinidia deliciosa ‘Hayward’ derived from axillary buds (Muganu et al. Citation2009), demonstrating the potential for successful initiation of in vitro cultures from infected plants. Leifert and Cassells (Citation2001) reported that pseudomonads tended not to produce symptoms in in vitro plants, although they may detrimentally affect plant growth and root formation. These non-symptomatic infections are described as ‘latent’ or ‘cryptic’ (Leifert et al. Citation1991a). Latent infections of in vitro plants by P. syringae, amongst other bacterial pathogens, have been studied by Cooke et al. (Citation1992), who found that P. syringae remained asymptomatic in tissue cultured Rosa plants.
Detection of contaminating organisms in asymptomatic plants can be problematic with a range of procedures described. A three-step process comprising visual inspection, screening on bacteriological media, and tissue indexing using segments from different parts of the plant was described by Thomas (Citation2004).
In other hosts and pathosystems, in vitro cultured plants are used in high health systems to ensure the absence, or elimination, of unwanted organisms. This is particularly common for the elimination of viruses with a range of technologies used including meristem tip culture (García-Gonzáles et al. Citation2010), in conjunction with thermotherapy (Panattoni et al. Citation2013), and/or cryotherapy (Pathirana et al. Citation2015a).
Micropropagation will likely have a role in schemes to generate and verify that Actinidia plants are free of Psa, thereby facilitating the movement of germplasm. Although it is possible to screen field or greenhouse growing ‘mother’ plants from which cultures are initiated for symptoms of Psa, the observation that even tolerant or resistant lines can harbour the bacterium (Tyson pers. obs.) makes selection of clean lines difficult.
The risk of Psa being associated with micropropagated Actinidia plants (Minardi et al. Citation2012) highlights the need to understand the behaviour and survival of Psa within in vitro growing kiwifruit shoots. This will be particularly important if in vitro cultures are used as a pathway for generating Psa-free plant material from affected orchards. In this study, we evaluate the ability of Psa to grow on plant culture media, assess the survival and movement of Psa within in vitro growing plants, investigate the detection threshold of Psa and model the likelihood of false negatives when screening for Psa at low titres.
Materials and methods
Inoculum preparation
Pseudomonas syringae pv. actinidiae isolate cc691 (Psa biovar 3) was used for all experiments in this study. This isolate was originally from leaf spots on Actinidia chinensis var. chinensis (red-fleshed fruit) in Te Puke, New Zealand, and is known to be pathogenic in leaf disc assays and potted plant studies (Tyson et al. Citation2015). Psa isolate cc691 has been deposited in the International Collection of Microorganisms from Plants, Landcare Research, Auckland, New Zealand (ICMP 21746).
For each experiment, the inoculum was grown on King’s B medium (KB) (King et al. Citation1954) for 48 h at 20°C, then suspended in bacteriological saline (BS, 0.85% NaCl in sterile distilled water) and the concentration adjusted to an optical density of c. 1.0 (600 nm) with an Agilent 8453 spectrophotometer. The target inoculum concentrations were achieved by preparing 10× serial dilutions. After 3 days, plate counts were performed to confirm the inoculum concentration as colony forming units/mL (cfu/mL).
Tissue culture media and culture environment
The basal medium (BM) for all plant in vitro culture work comprised MS salts (Murashige & Skoog Citation1962), B5 vitamins (Gamborg et al. Citation1968), 30 g/L sucrose and 7.5 g/L Bacto®-agar (New Zealand Manuka Bioactives Ltd). In vitro shoots were propagated on proliferation medium (PM) that comprised BM supplemented with 0.05 mg/L indole-3-butyric acid (IBA), 0.3 mg/L benzyl amino purine (BAP), and 0.1 mg/L gibberellic acid (GA3). A shoot maintenance medium (MM) comprised BM with the MS macro salts at half strength.
When used to supplement plant culture medium, peptone (Duchefa Biochemie, P1328) was used at 3 g/L and added prior to autoclaving. GA3 was filter sterilised and added to the medium after autoclaving.
Media were adjusted to pH 5.7 with either 0.1 N NaOH or 0.1 N HCl prior to autoclaving at 121°C for 15 min. Culture vessels were disposable 290 mL (80 mm base diameter × 60 mm deep) tubs with snap-on lids (Alto Packaging Ltd, Hamilton, New Zealand), containing approximately 50 mL of medium. In vitro plant material was maintained at 25 ± 2°C with a 16/8 h light/dark cycle until use. The light intensity of 35–45 µmol/m2/s at shelf level was provided by ‘Cool White’ fluorescent tubes.
Plant material
In vitro growing plants of Actinidia species and cultivars, including A. chinensis var. chinensis ‘Hort16A’, A. chinensis var. deliciosa ‘Hayward’ and A. polygama were used in experiments. A. chinensis var. chinensis ‘Hort16A’ is considered highly susceptible to Psa (Hoyte et al. Citation2015) and A. polygama is considered resistant (Datson et al. Citation2015).
In vitro elongated axillary shoots were subcultured and transferred to fresh PM to increase shoot numbers for experimental work as needed. Individual shoots were also grown as single elongated shoots on MM. Shoots would frequently develop roots on MM, although this was genotype and time dependent. Freshly cut shoots, without roots, were used for the inoculation experiments.
Prior to inoculation, bacterial isolations were made from plantlets of each genotype and all were found to be free of systemic contamination by culturable bacteria. There was no evidence of contaminating organisms in any of the uninoculated control treatments described in this work.
Assessment of the ability of plant in vitro culture growth media to support Psa growth – peptone-amended culture medium
Inoculation of in vitro culture growth media with Psa
The ability of Psa to grow on the surface of standard and amended tissue culture media was tested. A 100-µL aliquot of c. 103 cfu/mL of Psa was spread across 11 plates each of PM, peptone-amended PM (3 g/L peptone), maintenance medium, peptone-amended MM (3 g/L peptone), and a ‘microbiological growth medium’ comprising Difco® potato dextrose agar (PDA) and 5 g/L peptone. Kings B medium (KB) was used as a positive control. Bacterial colony counts were made after incubation at 20°C for 3, 5 and 7 days. Data for the 7 day counts were formally analysed using a negative binomial generalised linear model with a logarithmic link, fitted as described below for ‘Statistical modelling of detection thresholds’.
Inoculated plants on peptone-amended maintenance medium
In vitro cultured shoots of A. chinensis var. chinensis ‘Hort16A’ (eight plants), two A. chinensis selections (six and eight plants, respectively) and one A. deliciosa selection (four plants) were held individually on MM. Shoots were approximately 3.5 cm in height with three to five leaves. Each shoot was inoculated with Psa by excising the base of the shoot with a sterile scalpel and immersing the freshly cut end in a 100-µL droplet of inoculum (103 cfu/mL) for 60 s. Inoculated shoots were then transferred onto fresh MM. After 48 h, half of the plants were transferred to peptone-amended MM. Inoculated plantlets were incubated at ambient temperature (c. 22°C) and checked daily for 16 days for symptom development and the presence of bacteria on the growth media.
Psa movement through inoculated tissue cultured plants
In vitro cultured shoots of three Actinidia species considered to have different tolerances to Psa, A. chinensis var. chinensis ‘Hort16A’ (highly susceptible), A. chinensis var. deliciosa ‘Hayward’ (tolerant) and A. polygama (resistant) were inoculated with suspensions of Psa at 102, 104, 106 and 108 cfu/mL. Plantlets inoculated with BS served as the controls.
There were five replicates of each Actinidia genotype for each incubation period and treatment (Psa inoculum concentration). Individual Actinidia shoots were held in tubs and were approximately 3.5 cm in height with three to five leaves. Each plantlet was inoculated by excising the base of the shoot using a sterile scalpel and immersing the cut end in a 100-µL droplet of inoculum for 60 s. Inoculated shoots were then placed singly into fresh tubs of MM. The bases of the control shoots were immersed in BS for the same time period. Inoculated plantlets were incubated at room temperature (c. 22°C) for 0, 2, 7 or 14 days. An additional set of plantlets, including controls and all inoculation concentrations, was used to observe development of symptoms over the 14 days of the experiment.
After each incubation period all leaves, and roots if present, were removed and each shoot was surface sterilised for 15 min in 0.1% NaOCl, then rinsed twice with sterile reverse osmosis (RO) water. The stem was divided into three equal parts: the base, middle and top. Each part was macerated in 100 µL BS, left for 5 min and 100 µL of the resulting suspension spread across isolation plates of KB medium. Bacterial colony counts were made after the isolation plates were incubated at 20°C for 72 h in the dark. Isolation plates with over 4000 colonies became impossible to count; these were recorded as ‘4000’. These data have not been analysed formally: results as presented are a simple diagrammatic summary.
Detection threshold of Psa using the isolation/enrichment technique
The limit of detection of Psa in plant tissue was examined by spiking 0.05 g samples of kiwifruit leaf tissue with a series of concentrations of Psa. The plant tissue comprised young leaves of 3-month-old A. chinensis var. chinensis ‘Hort16A’ sourced from greenhouse grown plants from a Psa-free region. Before inoculation, the leaf tissue was surface sterilised for 15 min in 0.1% NaOCl, then rinsed twice with sterile RO water.
The relationship between initial inoculum concentration and detected Psa was explored over 10 sets of runs (individual experiments). Each set of runs contained a BS-spiked negative control, and 7 or 10 concentrations of Psa. A preliminary set of runs comprised a 10× dilution series with a starting concentration of 109 cfu/mL (109–101), with two replicates of leaf tissue used per concentration. Subsequent sets all used five replicates per concentration. The next five sets comprised a 10× dilution series with a starting concentration of 107 Psa (107–101 cfu/mL). To achieve a good spread of values across the very low inoculum concentrations, the final four runs had initial concentrations of 102 (2 runs), 103 and 104 cfu/mL and comprised dilutions of 10:0, 9:1, 8:2 down to 1:9 parts of the starting inoculum to parts of BS.
A 100-µL aliquot of the given inoculum was added to the plant tissue, which was then macerated and left for 5 min. Then 100 µL of the resulting suspension was spread across King’s B media. Bacterial colony counts were made after the isolation plates had been incubated at 20°C for 2–3 days.
An inoculum only 10× dilution series served as the bacterial (positive) control and allowed an accurate count of viable bacterial cells (cfu). A set of leaf tissue spiked with BS served as the plant (negative) control.
Statistical modelling of detection thresholds
The relationship between the number of cfu resulting from each test and the actual inoculation levels (as estimated from the inoculum only dilution series) was modelled. Since cfu are counts, the data were analysed using a generalised linear model, with a logarithmic link (McCullagh & Nelder Citation1989). The standard model for counts is a Poisson distribution, for which the variance of the counts is equal to the mean count. However, for these data, the variances were substantially greater than the mean, that is, the data were over dispersed (McCullagh & Nelder Citation1989). A probable cause of this over dispersion is ‘aggregation’, where the cfu (bacterial cells) are lumped or aggregated. Thus a negative binomial distribution was used rather than a Poisson distribution, since it is essentially a Poisson distribution extended to allow for aggregation. The analysis uses the following form of the negative binomial distribution:where Γ is the gamma function, μ is the mean count and
the variance for a given inoculated cfu, k is known as the aggregation parameter, and as k tends to infinity, the distribution tends towards the standard Poisson distribution. That is, the larger the value of k, the less aggregated is the data. To allow the aggregation parameter k to be estimated, the above model was fitted using a hierarchical generalised linear modelling approach (Lee et al. Citation2006). This had a Poisson distribution for the fixed effects (Set, actual inoculation level, the interaction between these), and, to estimate the aggregation k, a gamma distribution for a single random effect, which had one level per data point within each set. The parameter k was estimated separately for each Set by using a ‘structured dispersion’ (Lee et al. Citation2006). Both the fixed and random effects had logarithmic links.
Since a logarithmic link was used, μ is related to a given actual inoculation rate mI with the following equation: , where parameters a and b are estimated as part of the model fitting, and log10 is the common log (ie base 10 log). The analysis assessed whether parameters a and b varied significantly between the nine sets. This was done using a χ2 test of the change in deviance on dropping a term, as implemented in GenStat’s HGFTEST procedure (VSN International Citation2015).
For any given actual inoculation rate, the probability that a single test will give a negative result can be estimated by substituting in 0 for y in the above equation for the distribution, and simplifying:This was calculated separately for each of the nine runs, for each of a range of actual inoculation rates. The analyses were all carried out with GenStat (GenStat Committee Citation2015).
Results
Assessment of the ability of plant in vitro culture growth media to support Psa – peptone-amended culture medium
Inoculation of tissue culture growth media with Psa
At 3 days, bacterial colonies on the microbiological growth medium were uncountable (‘lawn’). For the other media, fewer colonies formed on the four tissue culture growth media than on the KB medium typically used for growing Pseudomonas spp. (P < 0.001; ), with relatively smaller differences between the four tissue culture growth media (P = 0.072). While all the peptone-amended media had countable colonies by day 3, Psa colony growth was not visible on the peptone-free proliferation or maintenance media until 5 days after inoculation and even after 7 days the colonies were very small ().
Figure 1. Growth of Psa on various media 7 days after inoculation. (A) Proliferation medium; (B) proliferation medium + peptone; (C) maintenance medium; (D) maintenance medium + peptone; (E) microbiological growth medium (potato dextrose agar + peptone); (F) King’s medium B.
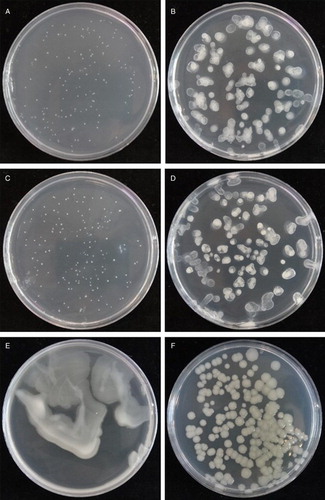
Table 1. Mean number of colonies (95% confidence limits) of Psa on six growth media 7 days after inoculation with 100 µL of c. 103 cfu/mL Psa.
Inoculated plants on peptone-amended maintenance medium
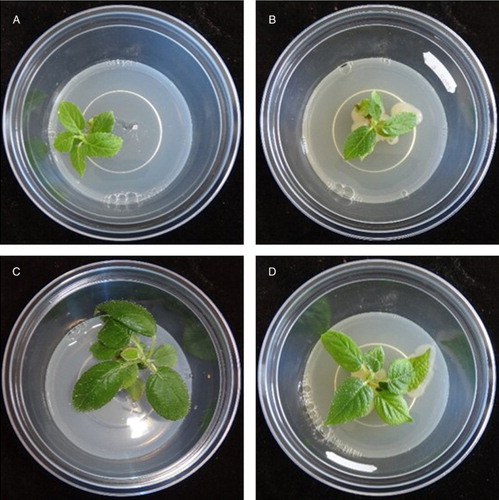
Bacterial growth appeared at the base of all the shoots transferred to peptone-amended maintenance medium within 3 days of transfer (). No bacterial outgrowth was seen from the shoots kept on standard maintenance medium.
Figure 2. In vitro growing Actinidia shoots that had been inoculated at the base with a 100-μL inoculum droplet (103 cfu/mL) of Psa for 60 s and transferred to maintenance medium. Left: Standard maintenance medium. Right: Bacterial growth on maintenance medium supplemented with 3 g/L peptone. Photos taken 16 days after inoculation. (A and B) A. chinensis var. chinensis ‘Hort16A’, (C and D) Actinidia deliciosa selection.
Psa movement through inoculated tissue cultured plants
All of the BS-inoculated controls remained free of bacteria for the duration of the study (). Most of the inoculated tissue culture shoots were rapidly colonised by Psa with the bacteria found to have spread throughout the plants within 14 days of inoculation even at the lowest inoculum concentration. The spread occurred more slowly at the 102 cfu/mL inoculum concentration.
Table 2. Movement of Psa through inoculated tissue culture plants of Actinidia spp.
The population of Psa increased throughout the shoots over time. The rate of increase was fastest in the susceptible genotype (A. chinensis var. chinensis ‘Hort16A’) and slowest in the resistant genotype (A. polygama). No symptoms that could be ascribed to Psa infection were seen on any of the inoculated shoots during the 14 days of the experiment.
Detection threshold of Psa using the isolation/enrichment technique
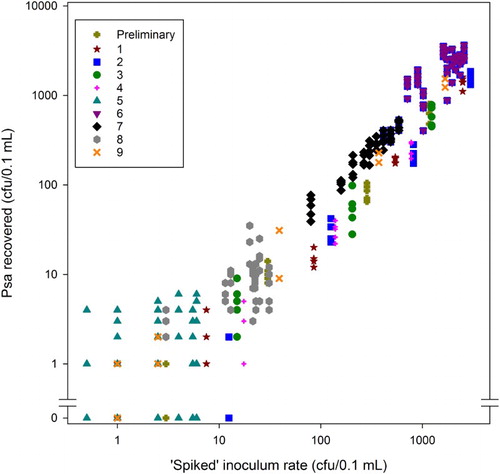
When Psa was added into the leaf tissue at titres higher than 104 cfu/0.1 mL, colony counts could not be made as the colonies merged, forming a ‘bacterial lawn’ on the isolation plates. These data were thus excluded.
Recovered Psa increased consistently with increasing levels of ‘spiked Psa’. No false negatives were found for plant tissue spiked with above 15 cfu/0.1 mL Psa (). However, below this level, there were false negatives for almost all the levels of spiked Psa that were tested.
Figure 3. Psa recovered (total cfu/0.1 mL) from 0.05 g samples of leaf tissue of A. chinensis var. chinensis ‘Hort16A’ spiked with varying concentrations of inoculum. Different symbols/colours are used for each of the 10 sets of runs. Note that in several cases the points represent several test results, because the same number of colonies were counted for the same ‘spiked’ cfu level (inoculum concentration). For example, at a spiked cfu of 1 for the set represented by orange crosses, there were four tests with a resulting cfu of 0.
Statistical modelling of detection thresholds
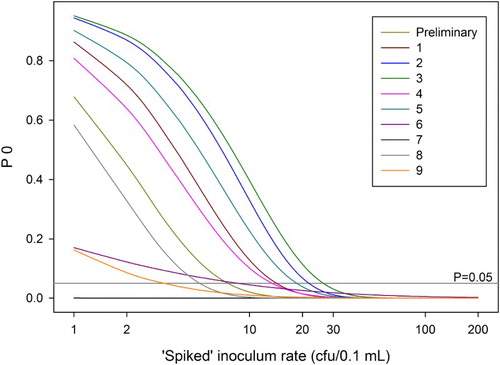
The data in suggest that the relationship between ‘spiked’ and recovered Psa varied somewhat between the runs, indicating that a single fitted curve would not adequately describe the data. All three parameters (a, b and k) varied significantly between sets (P < 0.001; ), confirming this. Because of these differences between the sets, a model averaged over sets would not necessarily fit well to any future datasets, so predictions relating to future tests must be treated with caution.
Table 3. Parameters (standard errors) from fitted model.
The spiked inoculum rate (I0) at which there was less than a 5% chance of getting a negative test result (false negative) varied between the sets from 1 to 27 cfu. Given the rate at which Psa increases in plant material over time (), this means that any material that tested negative initially will give a positive test at a second later stage even if the initial level of Psa was quite low: once the inoculum level rises above c. 30 cfu, the probability of getting a false negative result is close to zero ().
Figure 4. Probability P0 of getting a negative result from a single test for various ‘spiked’ inoculum rates, using the parameters derived from fitting separate models to the data for each of the 10 sets of runs. Each curve represents one of the 10 sets of runs.
Discussion
A key challenge for the kiwifruit industry is how to move new kiwifruit cultivars developed in regions in which Psa is prevalent to Psa-free regions. In vitro culture of plants provides an opportunity to do this. A particular challenge is to develop a protocol that can be used to routinely and non-destructively screen plants for the presence of the bacterium, even at low titres. Minardi et al. (Citation2012) demonstrated that Psa-infected plants can be introduced to in vitro culture and Minardi et al. (Citation2015) showed that Psa will propagate within asymptomatic in vitro cultured plants through multiple cycles.
Growth of Psa was minimal after 7 days on the surface of an MS-based in vitro plant culture medium of a type typically used for kiwifruit shoot proliferation and maintenance. Supplementing the medium with peptone (3 g/L) resulted in rapid growth of Psa and colonies could be detected visually within 3 days. Typically, when screening plants for ‘covert’ bacteria, samples are collected from the plants and tested separately on bacteriological media, eg Thomas (Citation2004) and Kaluzna et al. (Citation2013). Here we have added peptone, a key component of KB medium, to the in vitro plant culture medium. Kiwifruit grown for up to 3 months on PM and other media supplemented with 3 g/L peptone showed no adverse effects. Leaves were frequently a darker green colour than on standard media, although responses were genotype dependent (Morgan, pers. obs.). This approach to detecting bacteria in in vitro cultures is similar to that of Navacchi et al. (Citation2013) who used ‘ambivalent’ media that would support growth of artichoke plants and contaminating bacteria (Bacillus spp.) to make the presence of the bacterial colonies visually detectable.
The observation that the addition of peptone to the medium promoted growth of Psa on the medium at the base of the shoot without obvious detriment to the kiwifruit plant provides opportunity for repeated non-destructive screens of in vitro growing plants for the presence of the bacterium. We anticipate that future screening of in vitro plants in this way, in addition to providing a simple and repeatable visual method for routinely screening Actinidia cultures for Psa, will result in a rapid increase in bacterial titre, facilitating application of molecular techniques for reliable detection and characterisation of any Pseudomonas species detected. Although further testing may be needed, particularly of plants that have been inoculated and then grown on non-peptone-containing medium for a period to allow healing of the inoculation wound before transfer to the peptone-amended medium, the approach described here appears to provide a useful screen for Psa within tissue culture plantlets.
Colony count assays tracked the movement of Psa within in vitro shoots of three Actinidia species, including a species considered resistant. Even in the species considered most resistant, Psa had spread through the entire in vitro plant within 14 days of inoculation. This observation of the rapid spread of Psa through the plant is similar to the result reported by Minardi et al. (Citation2012). Although from , it may seem that in some cases the population of Psa dropped over time, this was due to the variable success of infection in the lowest inoculum level (102 cfu/mL), with some plants remaining clear of Psa.
An in vitro Psa-free shoot can become the ‘mother’ shoot from which all subsequent tissue cultures of a particular genotype are derived. The basal portion of this mother shoot can be destructively assayed by bacterial isolation and subsequent PCR for further confirmation of its disease-free status (Rees-George et al. (Citation2010) noted that the Psa-specific PCR primer pairs PsaF1/R2 and PsaF3/R4, although reliable in identifying the bacterium, should be used with an isolation step. Provided good aseptic techniques are followed at each subculture stage, all cultures derived from this mother shoot will retain their ‘high health’ status. This is further enhanced by having robust protocols for recording all in vitro culture steps (Seelye et al. Citation2016).
Psa-inoculated kiwifruit tissue culture plantlets were often asymptomatic for a long time, significantly longer than the usual 30-day timeframe between tissue culture subcultures (unpub. data). Although disease symptoms were never seen over the 14-day duration of the inoculation trials, the bacterium multiplied rapidly and was readily isolated from all the infected plantlets.
Given the rate at which Psa increases within in vitro plant material over time, this means that any material that tests negative initially will give a positive test at a second later stage even if the level of Psa is quite low in the mother plant: once the inoculum level rises above c. 30 cfu/plant sample, the probability of getting a false negative result is close to zero.
High health schemes typically require that the ‘mother plant’ is tested and found free of the pathogen of interest. There is limited information available on the likelihood of Psa being associated with the original kiwifruit plant tissue taken from an orchard that then becomes a ‘mother plant’. Work is currently in progress to test primary plant tissue (budwood) for Psa and to test the naturally infected progeny (explants) through cycles of tissue culture.
In recent work, all budwood from which 10 explant donor tissues were grown was found to be infected with Psa. Some of the in vitro cultures initiated from that infected bud wood were subsequently found to be free of Psa. Work is required to test the distribution of Psa through newly sprouted plant tissue from which explants are harvested for initiation of in vitro cultures.
Further work in progress is examining the feasibility of eradicating Psa from plant tissue culture. Previously published methods of elimination of Pseudomonas spp. from micropropagated plants include antibiotics (Leifert et al. Citation1991b), thermotherapy (Muganu et al. Citation2009) and cryotherapy (Pathirana et al. Citation2015b).
Acknowledgements
We gratefully acknowledge the support of Andrew Mullan and Belinda Diepenheim for providing plant tissue culture media, and Maree Debenham for producing some of the tissue culture plants used in this work.
Disclosure statement
No potential conflict of interest was reported by the authors.
ORCID
Joy L. Tyson http://orcid.org/0000-0002-0547-1093
Ruth C. Butler http://orcid.org/0000-0001-8646-1147
Ed R. Morgan http://orcid.org/0000-0002-5353-2639
Additional information
Funding
References
- Cooke DL, Waites WM, Leifert C. 1992. Effects of Agrobacterium tumefaciens, Erwinia carotovora, Pseudomonas syringae and Xanthomonas campestris on plant tissue cultures of Aster, Cheiranthus, Delphinium, Iris and Rosa; disease development in vivo as a result of latent infection in vitro. Zeitschrift fur Pflanzenkrankheiten und Pflanzenschutz. 99(5):469–481.
- Datson P, Nardozza S, Manako K, Herrick J, Martinez-Sanchez M, Curtis C, Montefiori M. 2015. Monitoring the Actinidia germplasm for resistance to Pseudomonas syringae pv. actinidiae. Acta Horticulturae. 1095:181–184. doi: 10.17660/ActaHortic.2015.1095.22
- Debergh PC, Vanderschaeghe AM. 1988. Some symptoms indicating the presence of bacterial contaminants in plant tissue cultures. Acta Horticulturae. 225:77–81 doi: 10.17660/ActaHortic.1988.225.8
- EPPO. 2012. Final pest risk analysis for Pseudomonas syringae pv. actinidiae. Paris: EPPO. 50 p.
- Everett KR, Taylor RK, Romberg MK, Rees-George J, Fullerton RA, Vanneste JL, Manning MA. 2011. First report of Pseudomonas syringae pv. actinidiae causing kiwifruit bacterial canker in New Zealand. Australasian Plant Disease Notes. 6:67–71. doi: 10.1007/s13314-011-0023-9
- Gamborg OL, Miller RA, Ojima K. 1968. Nutrient requirements of suspension cultures of soybean root cells. Experimental Cell Research. 50(1):151–158. doi: 10.1016/0014-4827(68)90403-5
- García-Gonzáles R, Quiroz K, Carrasco B, Caligari P. 2010. Plant tissue culture: current status, opportunities and challenges. Ciencia e Investigacion Agraria. 37(3):5–30. doi: 10.4067/S0718-16202010000300001
- GenStat Committee. 2015. The guide to the GenStat® command language (release 18). Hemel Hempsted: VSN International.
- Hoyte S, Reglinski T, Elmer P, Mauchline N, Stannard K, Casonato S, Chee AA, Parry F, Taylor J, Wurms K. 2015. Developing and using bioassays to screen for Psa resistance in New Zealand kiwifruit. Acta Horticulturae. 1095:171–180. doi: 10.17660/ActaHortic.2015.1095.21
- Kaluzna M, Mikinski A, Sobiczewski P, Zawadzka M, Zenkteler E, Orlikowska T. 2013. Detection, isolation, and preliminary characterization of bacteria contaminating plant tissue cultures. Acta Agrobotanica. 66(4):81–92. doi: 10.5586/aa.2013.054
- King EO, Ward MK, Raney DE. 1954. Two simple media for the demonstration of pyocyanin and fluorescin. Journal of Laboratory and Clinical Medicine. 44(2):301–307.
- Lee YJ, Nelder JA, Pawitan Y. 2006. Generalized linear models with random effects: unified analysis via H-likelihood. London, UK: Chapman & Hall/CRC Press. 416 p.
- Leifert C, Camotta H, Wright SM, Waites B, Cheyne VA, Waites WM. 1991b. Elimination of Lactobacillus plantarum, Corynebacterium spp., Staphylococcus saprophyticus and Pseudomonas paucimobilis from micropropagated Hemerocallis, Choisya and Delphinium cultures using antibiotics. Journal of Applied Bacteriology. 71(4):307–330. doi: 10.1111/j.1365-2672.1991.tb03795.x
- Leifert C, Cassells AC. 2001. Microbial hazards in plant tissue and cell cultures. In Vitro Cellular & Developmental Biology Plant. 37(2):133–138. doi: 10.1007/s11627-001-0025-y
- Leifert C, Ritchie JY, Waites WM. 1991a. Contaminants of plant-tissue and cell cultures. World Journal of Microbiology and Biotechnology. 7(4):452–469. doi: 10.1007/BF00303371
- Leifert C, Waites WM, Nicholas JR. 1989. Bacterial contaminants of micropropagated plant cultures. Journal of Applied Bacteriology. 67:353–361. doi: 10.1111/j.1365-2672.1989.tb02505.x
- McCullagh P, Nelder JA. 1989. Generalized linear models. London, UK: Chapman & Hall. 511 p.
- Minardi P, Ardizzi S, Lucchese C, Bertaccini A. 2012. Micropropagation of kiwifruit: one-year endophytic colonisation of Pseudomonas syringae pv. actinidiae in shoots of Actinidia deliciosa cv. Hayward. Journal of Plant Pathology. 94(4, Supplement):S4.70.
- Minardi P, Ardizzi S, Lucchese C, Bertaccini A. 2015. A reliable method for Pseudomonas syringae pv. actinidiae detection in asymptomatic kiwifruit plants three years after pathogen inoculation in micropropagated shoots and buds. II International Psa Symposium. pp. 51.
- Muganu M, Fratarcangeli L, Paolocci M, Balestra GM. 2009. Improvement of the quality of nursery kiwifruit plants: sanitation of micropropagated shoots infected by Pseudomonas syringae pv. syringae (van Hall). Italus Hortus. 16(5):227–230.
- Murashige T, Skoog F. 1962. A revised medium for the rapid growth and bioassays with tobacco tissue cultures. Physiologia Plantarum. 15:473–497. doi: 10.1111/j.1399-3054.1962.tb08052.x
- Navacchi O, Zuccherelli G, Mazzucchi U. 2013. Development of ambivalent media to detect bacterial contamination of globe artichoke micropropagation media. Acta Horticulturae. 983:215–220. doi: 10.17660/ActaHortic.2013.983.29
- Orlikowska T, Nowak K, Reed B. 2017. Bacteria in the plant tissue culture environment. Plant Cell, Tissue and Organ Culture (PCTOC). 128(3):487–508. doi: 10.1007/s11240-016-1144-9
- Panattoni A, Luvisi A, Triolo E. 2013. Review. Elimination of viruses in plants: twenty years of progress. Spanish Journal of Agricultural Research. 11:173–1881 doi: 10.5424/sjar/2013111-3201
- Pathirana R, Mathew L, Tyson JL, Jibran R, McLachlan A, Buritt DJ. 2015b. Cryopreservation and cryotherapy of kiwifruit. Combio. pp. 130 (Abstr.).
- Pathirana R, McLachlan A, Hedderley D, Carra A, Carimi F, Panis B. 2015a. Removal of leafroll viruses from infected grapevine plants by droplet vitrification. Acta Horticulturae. 1083:491–498. doi: 10.17660/ActaHortic.2015.1083.64
- Rees-George J, Vanneste JL, Cornish DA, Pushparajah IPS, Yu J, Templeton MD, Everett KR. 2010. Detection of Pseudomonas syringae pv. actinidiae using polymerase chain reaction (PCR) primers based on the 16S–23S rDNA intertranscribed spacer region and comparison with PCR primers based on other gene regions. Plant Pathology. 59(3):453–464. doi: 10.1111/j.1365-3059.2010.02259.x
- Scortichini M. 1994. Occurrence of Pseudomonas syringae pv. actinidiae on kiwifruit in Italy. Plant Pathology. 43(6):1035–1038. doi: 10.1111/j.1365-3059.1994.tb01654.x
- Seelye JF, Corpe S, Debenham MC. 2016. A management system for tracking high health in vitro kiwifruit germplasm. Acta Horticulturae. 1113:113–118. doi: 10.17660/ActaHortic.2016.1113.16
- Serizawa S, Ichikawa T, Takikawa Y, Tsuyumu S, Goto M. 1989. Occurrence of bacterial canker of kiwifruit in Japan: description of symptoms, isolation of the pathogen and screening of bactericides. Annals of the Phytopathological Society of Japan. 55(4):427–436. doi: 10.3186/jjphytopath.55.427
- Takikawa Y, Serizawa S, Ichikawa T, Tsuyumu S, Goto M. 1989. Pseudomonas syringae pv. actinidiae pv. nov.: the causal bacterium of canker of kiwifruit in Japan. Annals of the Phytopathological Society of Japan. 55(4):437–444. doi: 10.3186/jjphytopath.55.437
- Thomas P. 2004. A three-step screening procedure for detection of covert and endophytic bacteria in plant tissue cultures. Current Science (Bangalore). 87(1):67–72.
- Tyson JL, Horner IJ, Curtis CL, Blackmore A, Manning MA. 2015. Influence of leaf age on infection of Actinidia species by Pseudomonas syringae pv. actinidiae. New Zealand Plant Protection. 68:328–331.
- VSN International. 2015. Genstat release 18 reference manual, part 3: procedures. Oxford, UK: VSN International. 1351 p.