
ABSTRACT
The tomato potato psyllid (TPP) is a serious pest of New Zealand glasshouse crops. This study examined the use of sticky traps in a glasshouse tomato crop to identify factors that influence TPP catches, with a view to developing a more consistent TPP monitoring system for use in IPM decision models. TPP catches were highest on yellow traps compared with black traps and white traps, and were greatest when traps were set near the glasshouse roof (2.1 m). Ultraviolet (UV) illumination substantially increased TPP catches on traps of all colours. There was considerable variation in TPP catch density within traps, especially near the edges. The results suggest that yellow sticky traps have good potential as TPP monitoring tools in glasshouse tomato crops. Consistency in TPP counts could be enhanced if traps were placed at constant height, were illuminated by UV, and assessments were limited to the trap centres.
Introduction
The tomato potato psyllid (TPP, Bactericera cockerelli (Šulc) Homoptera: Triozidae) was confirmed as present in New Zealand (NZ) in 2006 (Teulon et al. Citation2009). TPP attack a number of fruit, vegetable and non-crop plant species, although they breed primarily on members of the Solanaceae. Plant damage is caused by the direct removal of photosynthates, transmission of pathogens and introduction of phytotoxic compounds in saliva (Liefting et al. Citation2008; Martin Citation2008; Butler and Trumble Citation2012). Although control of TPP by botanically-derived insecticides, biological control and physical barriers have all been evaluated (Berry et al. Citation2009; Page-Weir et al. Citation2011; Jorgensen et al. Citation2013; Merfield et al. Citation2015; Geary et al. Citation2016), synthetic insecticides remain the primary means of TPP management in NZ (Gharalari et al. Citation2009; Guenthner et al. Citation2012; Prager et al. Citation2013a).
Pest monitoring schemes are central to integrated pest management (IPM) decision making strategies, and fundamental when determining whether infestation thresholds have been breached and the application of chemical biocides should be initiated (Binns and Nyrop Citation1992). TPP in NZ glasshouses tend to be monitored by checking numerous leaves on individual plants, which can be time consuming, tedious and prone to considerable intra- and inter-plant variation (Al-Jabr and Cranshaw Citation2007; Butler and Trumble Citation2012; Walker et al. Citation2013a; Tomatoes NZ Citation2016).
Sticky traps, although considered useful for providing quick indications of TPP activity, are currently not considered part of the formal programme of TPP monitoring in NZ glasshouses, as there is insufficient information relating trap catches with TPP populations levels (Tomatoes NZ Citation2016). However, in a field situation, sticky traps have been used to monitor the biogeographic spread of TPP through NZ (Teulon et al. Citation2009). In Australia, where to date TPP have been only recorded from Western Australia, yellow sticky traps have formed the basis of biosecurity monitoring in potato crops to detect incursions in to the eastern states (e.g. Walker et al. Citation2015). Sticky traps have also been used to provide relative measures of abundance in orchards and potatoes (Cameron et al. Citation2009; Walker et al. Citation2011; Page-Weir et al. Citation2012). Previous research has suggested that TPP collected on yellow sticky traps (YST) were a good indicator of crop infestation levels in field potatoes, and could be useful in predicting imminent psyllid outbreaks (Walker et al. Citation2013a, Citation2013b).
In order to make sensible and accurate crop management decisions based on sticky trap TPP captures it is desirable to standardise protocols, at least within the same crop and/or production system. However, a disconcerting issue with sticky traps is that catches of target insects can be dependent upon a number of procedural aspects, such as trap colour, pattern, shape and size. Moreover, catches on sticky traps can vary spatially within and around a crop, and be affected by trap height, orientation, position in the glasshouse or distance from field margins (Brennan and Weinbaum Citation2001; Al-Jabr and Cranshaw Citation2007; Mainali and Lim Citation2010; Butler and Trimble Citation2012; Verijssen et al. Citation2013; Taylor et al. Citation2014). A further aspect of variation in trap counts which appears to have received less attention is that which occurs over the surface of the trap itself. The density of insects attached to the traps tends not to be uniform, and can depend upon the size of the trap and whether the centre of the trap is surrounded by a border of the same or different colour (e.g. Taylor et al. Citation2014).
In order to standardise TPP monitoring protocols for IPM decision-making it is necessary, therefore, to evaluate all potential sources of variation in trap catches. The aim of this study was to address a number of issues that could influence TPP counts on sticky traps in glasshouse tomato crops. We have examined the effect of trap colour and trap height on psyllid catches, and also investigated the effect of UV-illumination. Additionally, we have examined the distribution of TPP over the surface of sticky traps in order to identify the region(s) where variation in TPP counts is lowest and would thus result in the most consistent data.
Materials and methods
TPP population
TPP were allowed to develop on tomatoes maintained in a small glasshouse (5 m long, 2.5 m wide, 2.1 m high) at Lincoln University, NZ. The trials ran from December 2017 to March 2018, with an average night-time temperature of 18°C and average daytime temperature of 31°C. Tomatoes were grown under natural lighting in 40 L plastic tubs (two plants per tub) using long term potting mix (80% compost; 20% bark/pumice with Osmocote fertiliser added). Six tubs were placed along each side of the glasshouse, with watering trays placed under each tub and filled by an automatic watering system. The tomatoes were trussed using strings tied to a wire that ran along the glasshouse roof. TPP from a Lincoln University research culture were introduced to the tomatoes at planting, and the population allowed one month to grow before trials commenced. The tomato plants were approximately 1 m tall when trials were started: as plants became too degraded by heavy TPP infestations they were replaced as and when required by new plants (approximately 0. 5 m tall) in order to maintain the TPP population.
The effect of trap colour, trap height and UV-illumination on TPP captures
To examine the effect of trap colour on TPP capture, three different coloured sticky traps were compared: Yellow [30 × 25 cm Glupac GB001 Universal glue board; Pelsis Ltd. UK]; Black [30 × 25 cm Glupac GB002 Universal glue board; Pelsis Ltd. UK]; White [32 × 26 cm Luminos 3 Glue Board, Stock number 300010- Rentokil Initial Supplies, UK]. The YST and black sticky traps were divided into 12 × 10 rows of 2.5 cm squares. The white traps were divided into 16 × 13 rows of 2 cm squares. One trap of each colour was placed at the same end of the glasshouse approximately 1 m off the ground and left in place for 7 d. This process was repeated four times, with the order of colour sequence (from left to right) changed on each occasion. All of the TPP on each trap were counted using a stereo microscope and, due to the different total areas of the different coloured traps, these counts were converted to density (TPP.cm−2).
To examine the effect of trap height on TPP catch, small YST, with a collecting area of 12.5 × 7.5 cm, were attached to five wooden stakes (2.1 m; same height at the glasshouse), at seven different heights (0, 35, 70, 105, 140, 175, 210 cm) from the ground. The stakes were spaced (approx. 1 m apart) along the centre of the glasshouse, and left in place for 7 d. TPP density was calculated using TPP caught over the whole collecting area.
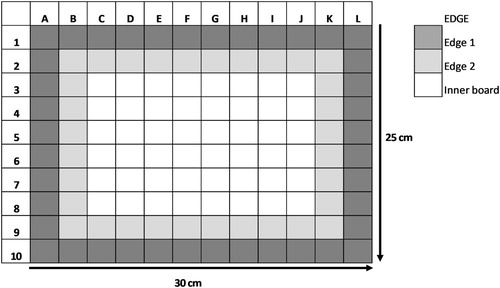
To investigate the effect of UV-illumination on TPP catches, two Luminos-3 insect traps fitted with three F15 T8 365 BL UVA fluorescent tubes [Rentokil Ltd] were installed at one end of the glasshouse, 0.8 m from the ground and 2 m apart. Two full-sized sticky traps of the same colour were tested on each occasion, with one sticky trap being placed into each UV trap. One of the UV traps was then randomly selected to be turned on during the collecting period, whereas the other UV trap remained tuned off during the collecting period. The process was repeated three times with each of the three trap colours, with each trial lasting 7 d. In this trial, there was a clear systematic tendency for TPP not to be trapped on some edges (see Results). Therefore TPP density was calculated using only TPP caught on the central squares of the trap, with the two outer rows being omitted ().
Figure 1. Representation of 30 × 25 cm yellow sticky trap (in landscape orientation), divided into 12 columns, 10 rows, and 120 2.5 × 2.5 cm squares.
A further trial was performed to examine whether the positive effect of UV-illumination on TPP catches (as observed in the above trial) was influenced by whether the traps were illuminated during the day or during the night. YST (25 × 30 cm) were arranged under the two UV lamps. One trap was randomly chosen to be illuminated by UV for 4 h during the day (11:30 am–15:30 pm) and the other was UV-illuminated for 4 h during the night (11:30 pm–3:30 am). The traps were left in place for 7 d and the TPP density in the central trap area then calculated. The process was repeated three times.
Data analysis
ANOVA was used to compare TPP densities among treatments [GenStat v17, VSI International LTD, UK]. In all cases data were transformed as log10(x + 1) to improve normality of residuals and equalise variances among groups. For the initial comparison of TPP densities on the different coloured boards, an ANOVA was used, treating board colour as a fixed factor and including the four runs of the trial as a random blocking factor. For the trap height comparison, height was included as a fixed factor in the ANOVA model with the five different wooden stakes treated as a blocking factor.
When comparing the effect of UV-illumination and board colour, a split-plot ANOVA model was used that included board colour (whole plot) and UV-illumination (split-plot) as fixed factors, and the three runs as a blocking factor. For the day v night UV-illumination trial, illumination time was included in the ANOVA as a fixed factor, and the three runs of the trial as a blocking factor.
To take into account any possible relationship between the variance and mean of TPP counts, in some cases the coefficient of variation has been used to provide a measure of the variation, where CV% was calculated as: CV% = 100 × (standard deviation / mean). The numbers of TPP in the glasshouse fluctuated naturally over the course of the experiments, and therefore direct comparisons of TPP numbers among the different trials should be treated with caution.
Within trap variation in TPP densities on yellow sticky traps
The YST were divided up into 120 squares, each 2.5 × 2.5 cm, arranged in a grid pattern so that each small square could be assigned to rows, columns and ‘edge zones’, where the outer edge was classified as ‘Edge 1’, the squares one from the edge as ‘Edge 2’, and the remaining squares described as ‘Inner Board’ ().
One-way analysis of variance was used to compare the average TPP counts and CV% in squares in the different edge zones for the UV-illuminated and non-UV-illuminated YST, with study week included in these analyses as a random variable. As different total numbers of TPP were collected each week, to aid presentation of the data the counts were standardised to a 100 point scale using the formula:A bootstrap analysis was performed to examine how many squares needed to be counted in order to produce an estimate of TPP density within a given deviance from the actual mean. Only the data from the Inner Board area of the YSTs were used in this analysis, and a separate bootstrap analysis was performed for each week of sampling (four replicates under typical glasshouse light conditions and three replicates under UV-illumination). Samples of 5 to 40 squares, in steps of five, were randomly selected (with replacement), and the absolute deviation of the sample mean from the actual mean calculated in each case (expressed as a percentage of the actual mean). This process was repeated 10,000 times, and the proportions of simulations that exceeded 2.5%, 5% and 10% percent deviation from the actual mean were obtained.
Results
The effect of trap colour, trap height and UV-illumination on TPP captures
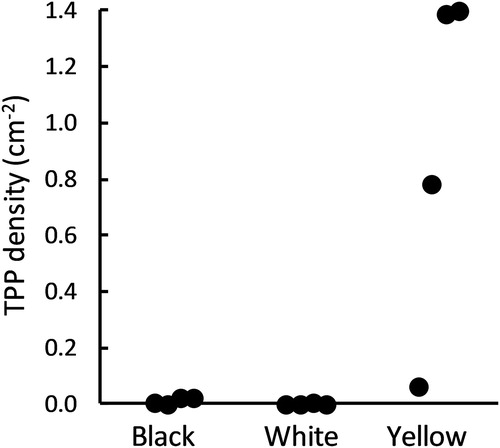
During the four runs of the trap colour comparison trial under ambient lighting, a total of 3131 TPP were collected, of which 3075 (98.2%) were collected on the yellow traps. When temporal block was taken in to account, and total counts converted to density (TPP.cm2), this difference in TPP density among the three different coloured boards was statistically significant (F2,6 = 14.4, P = 0.005) and the density on the YST was separated from those on the other two colours by Fishers LSD (P < 0.05; ).
Figure 2. TPP collected (TPP.cm−2) on different coloured sticky traps over a 7 d period under natural light conditions in a heavily infested glasshouse tomato crop.
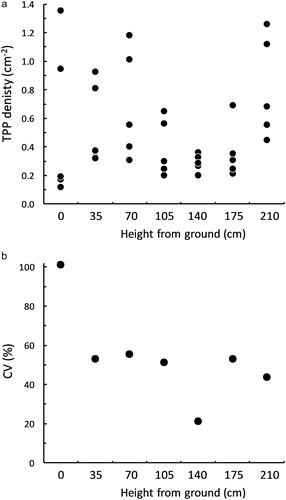
There was moderate evidence indicating a difference in TPP catches on the small YST set at different heights (F6,24 = 2.41 , P = 0.058), however there was no unidirectional trend. The highest densities were on traps set at the highest point (0.81 ± 0.16 TPP.cm−2), followed by the three positions near the ground; the traps set at intermediate heights (70–140 cm from the ground) captured the fewest TPP ((A)). The highest variation within traps at the same height occurred at ground level (CV = 102%) and was lowest at 140 cm from the ground (CV = 21%; (B)). The traps at the other heights all had quite similar values for CV, ranging from 44% (at 210 cm) to 56% (at 70 cm; (B)). In this case, the densities of TPP captured on these small YST were similar to those on the larger YST used in the colour comparison trial (c.f. and ).
Figure 3. The (A) density (TPP.cm−2) and (B) coefficient of variation (%) of TPP collected over 7 d on yellow sticky traps set at different heights in a glasshouse containing a heavily infested tomato crop.
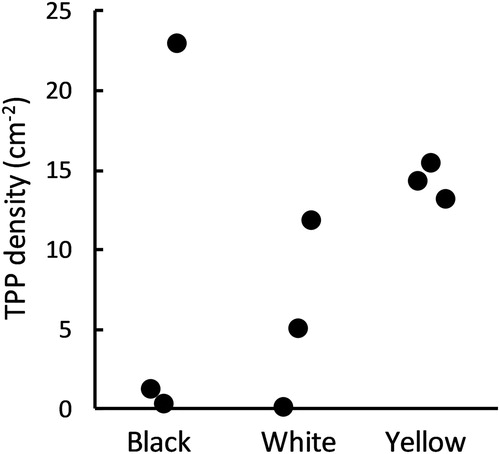
Over the whole nine weeks of the UV illumination trial, a total 28,526 TPP were collected in the Inner Board zones of the traps, of which 28,487 (99.86%) were collected on the traps with UV-illumination. Thus, in terms of density of TPP, the UV-illuminated traps had a considerably higher catch per cm2 (9.466 ± 2.685) than the non-UV traps (0.014 ± 0.006; F1,6 = 25.7, P = 0.002). However, in this trial there was no significant difference among the trap colours (F2,4 = 2.01, P = 0.249), a result strongly influenced by the catch on one of the UV-illuminated black sticky traps, where a density of 23.0 TPP.cm−2 was recorded (). Of the UV-illuminated traps, the YST obtained the highest average catch (14.4 TPP.cm−2) and the most consistent catch (CV% = 8%) among the three colours tested ().
Figure 4. TPP collected (TPP.cm−2) on different coloured sticky traps with UV illumination over a 7 d period in a heavily infested glasshouse tomato crop.
In the trial examining day and night time catches, there was virtually no difference in TPP catch density when YST were UV-illuminated for 4 h by night (0.19 ± 0.04 TPP.cm−2) or 4 h by day (0.20 ± 0.12 TPP.cm−2) (F1,2 = 0.001, P = 0.983). The density of TPP on these UV-illuminated yellow traps was much lower than that which occurred in the earlier trial, reported above. This result occurred because TPP were not at such high density in the crop during this trial, and also because the traps were illuminated for only 4 h per day, not 24 h as in the previous trial.
Within trap variation in TPP densities on yellow sticky traps
For the YST not illuminated by UV, the minimum number of TPP in any one square was 0, and the maximum was 22. For Week 1, TPP catches were low, and there appeared no patterns in TPP density over the surface of the trap (). However, for Weeks 2 and 3 the density of TPP was higher towards the top and the left corner of the traps, and for Week 4 towards the upper edge (). With respect to distance from the edge, TPP densities over all three weeks were very similar in the Edge 1 zone (6.7 ± 3.7 SD TPP.cm2) and the Edge 2 zone (6.5 ± 4.1 SD TPP.cm2) compared with that found in the Inner Board (6.1 ± 3.7 SD TPP.cm2; F2,6 = 0.89, P = 0.459; (A)).
Figure 5. Heat maps illustrating relative TPP counts in each 2.5 cm square on a yellow sticky trap for seven sampling periods (7 d). Traps were maintained under normal glasshouse light conditions or under a UV lamp. Scale ranges from deep red (highest count) to dark blue (lowest count) for that trap.
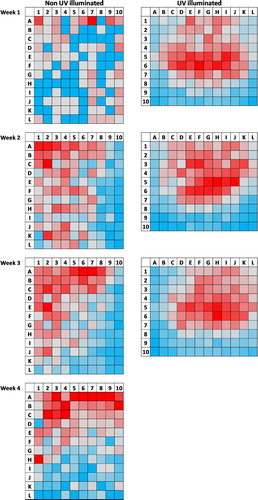
Figure 6. The effect of distance from the trap edge on the mean (standardised count) and variation (CV%) of TPP on yellow sticky traps collected over 7 d under (A,C) normal glasshouse light conditions and (B, D) under UV illumination. Different circle shades represent data from different weekly sampling periods.
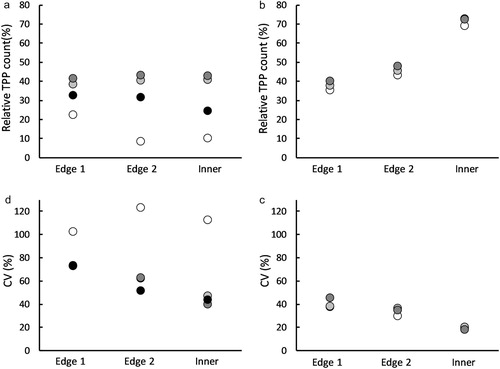
For the UV-illuminated YST, the minimum number of TPP in any one square was 10, and the maximum was 123. In all three study weeks TPP numbers were highest in the centre of the trap and lowest around the margins, although there were also some relatively high numbers in the edge squares at the top of the traps (). With respect to distance from the edge, TPP densities over all three weeks were much lower in the Edge 1 zone (55.7 ± 7.0 SD TPP.cm2) and Edge 2 zone (63.6 ± 6.7 SD TPP.cm2) compared to that found in the Inner Board (90.0 ± 7.0 SD TPP.cm2; F2,4 = 1439, P < 0.001; (B)).
In terms of variability, the counts in the Inner Board of the non-illuminated traps were considerably less variable (mean CV% ≈ 60.9%), compared with the Edge 1 (CV% ≈ 80.5%) and Edge 2 zones (CV% ≈ 75.1%; (C)), but these differences were not statistically significant (F2,6 = 3.13, P = 0.117). This pattern was even more pronounced for the UV-illuminated traps where the CV% for the Inner Board squares (≈18.6%), was approximately half that seen in the Edge 1 (CV% ≈ 40.7%) and Edge 2 (CV% ≈ 33.8%) zones ((D): F2,4 = 43.2, P < 0.001).
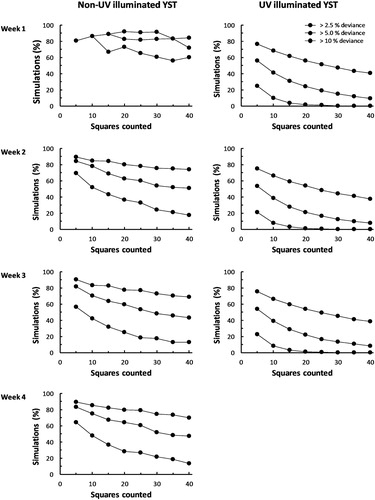
The results of the bootstrap analyses of the Inner Board squares of the YST are summarised in . For the non-illuminated traps, the data from Week 1 contained very low counts of TPP (mean = 0.81 TPP/square; see ) and produced trends relating sample estimates and actual mean TPP densities that were dissimilar to the other three sampling weeks. In contrast, the analysis of the UV-illuminated YST produced relationships between the number of squares counted and proximity of the sample means to the actual means that were very consistent between study weeks. Additionally, the estimates of TPP density provided by sampling the UV-illuminated squares were considerably closer to the actual mean than for similar sample sizes for the non-illuminated boards. For example, counting the TPP collected in 25 randomly-selected small squares on a UV-illuminated board produced an estimate of the mean count within 10% the actual mean on more than 99% of occasions, and within 5% of the actual mean on more than 80% of occasions (). For comparison, counting the TPP collected in 25 randomly-selected small squares on a non-illuminated board produced an estimate of within 10% the actual mean on fewer than 81.5% of occasions, and within 5% of the actual mean on fewer 46.6% of occasions ().
Figure 7. Relationships between the numbers of Inner Board 2.5 cm squares used for TPP assessment and the proportion of simulated estimates that were a given deviance from the actual mean count for seven sampling periods (7 d). Traps were maintained under normal glasshouse conditions or under a UV lamp.
Discussion
Under ambient light conditions more TPP were collected on YST than the other two trap colours used in this study. Many hemipteran plant feeders, such as psyllid or aphids, are attracted to yellow (or yellow/green) because this colour is associated with young, senescing or infected foliage that tends to indicate a higher availability of nutrients such as amino-acids (e.g. Brenan and Weinbaum Citation2001; Hodge and Powell Citation2010; but see Farnier et al. Citation2014). The attractiveness of YST to TPP has been demonstrated previously (e.g. Al-Jabr and Cranshaw Citation2007; Taylor et al. Citation2014), and these traps appear to have become the default method to monitor or compare densities of TPP in NZ field crops (e.g. Teulon et al. Citation2009; Walker et al. Citation2011; Page-Weir et al. Citation2012; Vereijssen et al. Citation2013). Our results would support the use of YST, as opposed to other coloured traps, as a monitoring tool for TPP in glasshouse crops. Psyllid catches can differ on yellow traps of different spectral reflectance (e.g. Brennan and Weinbaum Citation2001; Al-Jabr and Cranshaw Citation2007), and there are opportunities to optimise the system further by testing the efficacy of sticky traps with different yellow hues.
Brenan and Weinbaum (Citation2001) found that catches of the eucalyptus psyllid Ctenarytaina eucalypti were similar at 1.5 m and 3 m above the ground, whereas catches of a related species, C. spatulata, were greatest on the higher traps. Similarly, for TPP in a glasshouse tomato crop, Al-Jabr and Cranshaw (Citation2007) captured more psyllid on traps set at 1.5 m (near the top of the plants) compared with those placed lower down (0.3 m). However, in a field potato crop, Vereijssen et al. (Citation2013) found the opposite situation and collected more TPP on YST at 1 m compared with those set at 1.75 m. Our results were similar to those of Al-Jabr and Cranshaw (Citation2007) in that the highest traps captured the most TPP. We frequently observed adult TPP moving towards the top of the glasshouse, possibly due to a combination of positive phototaxis and negative geotaxis, so they would tend to accumulate near these upper traps. Although no clear patterns with TPP counts and trap height were observed, in terms of using YST for monitoring TPP in glasshouse crops it would seem prudent to place traps at a single height to avoid introducing additional variation to the data.
In this study, illuminating sticky traps of all colours with UV vastly increased the numbers of TPP attached to them. At this stage we are uncertain whether it was UV-illumination per se or the increase in light intensity that increased the attractiveness of the traps. However, over nine weeks the total numbers of TPP attached to the UV-illuminated sticky traps was close to 30,000, which suggests that these illuminated traps may have potential as a TPP control or interception technique, in addition to having increased sensitivity as a detection or monitoring tool (Paris et al. Citation2015). The attraction of insects towards UV lamps is exploited by many kinds of domestic and commercial electric insect killing devices (Shimoda and Honda Citation2013), and the positive response of insects to UV has been further developed to increase trap captures of agricultural pests such as Lepidoptera (Cowan and Gries Citation2009; Hegazi et al. Citation2009), whitefly (Mutwiwa and Tantau Citation2005; Stukenberg et al. Citation2015), and Coleoptera (Katsuki et al. Citation2012). UV-producing light emitting diodes (LEDs) have been found to attract other psyllid species (e.g. the citrus psyllid, Diaphorina citri; Paris et al. Citation2015) and the combined effects of UV-emitting LEDs and YST on TPP captures is a topic for future research.
For both the UV-illuminated and non-illuminated YST the areas around the edge of the traps gave the most variable TPP counts. Previously, Taylor et al. (Citation2014) found that border colour could influence TPP catches in the central area, and this effect was dependent upon colour and size of the trap. Overall, this suggests that when developing a TPP monitoring scheme any potential variation in the data caused by edge effects could be excluded if only the inner area of the YST was considered. It is also desirable to minimise sampling effort and time spent counting TPP on YST if this can be achieved without compromising accuracy. The bootstrap analysis suggested that counting TPP on 25 randomly selected Inner Board squares on UV-illuminated YST would provide an estimate within 10% the true Inner Board density over 99% of the time, which would cut processing time by approximately half compared with counting TPP in the whole Inner Board area. This result, however, was not found for the non-illuminated boards, which is currently likely to be the default situation in most NZ glasshouses.
In this study we did not explicitly investigate between-trap variation in TPP counts. The results from the trap height comparison trial (without UV-illumination) provided some information on this issue, and indicated that the CV% in TPP density between YST was generally around 50%. This level of variation would suggest that multiple traps would be needed in order to produce a stable estimate of TPP infestation levels based on trap counts. Although our study has assessed variation in TPP counts, there is no actual requirement for an IPM monitoring system to use counts as the metric for decision making. For example, Prager et al. (Citation2013b) suggested a binomial sequential sampling method for TPP that attempted to mediate for high variation in counts within and between plants. A similar scheme could be adopted using YST where the number of traps that exceeded some threshold score was used in the decision making process. This score could be in the form of a trap-level binary measure of TPP presence/absence, the number of Inner Board small squares that contained any TPP, or when some threshold count limit had been exceeded.
We concede that these findings are based on trials with low levels of replication, and additional work is required in order to evaluate repeatability. Our traps were set at the edges of the glasshouse and do not provide information on how TPP would respond to UV if traps were hung among plants. Additionally, extrapolating our results from a small glasshouse to commercial glasshouses, which can be 3–5 m in height and several hectares in size, should be treated with caution at this stage, and further research is required to establish the relationship between actual TPP infestation levels in the crop and what appears on the traps. Nevertheless, our results clearly indicate that YST should be used in preference to other coloured sticky traps when monitoring TPP, and because YST are already present in glasshouse crops for pest control and monitoring (e.g. aphids, whitefly, thrips, leaf miners; Shimoda and Honda Citation2013), the development of YST for monitoring TPP appears sensible. Our findings suggest that variation in YST catches could be minimised if trap height was held constant, the edges of the traps were not included in the assessment, and, if possible, UV-illumination was applied to enhance trap attractiveness.
Acknowledgements
The authors wish to thank Brent Richards and Leona Meachen for plant care. Two anonymous reviewers provided insightful comments and suggestions on an earlier draft of the manuscript that led to considerable improvement in the final version.
Disclosure statement
No potential conflict of interest was reported by the authors.
ORCID
Simon Hodge http://orcid.org/0000-0001-6933-5253
Charles N Merfield http://orcid.org/0000-0003-2866-7213
Additional information
Funding
References
- Al-Jabr AM, Cranshaw WS. 2007. Trapping tomato psyllid, Bactericera cockerelli (Sulc) (Hemiptera: Psyllidae), in greenhouses. Southwestern Entomol. 32:25–30. doi: 10.3958/0147-1724-32.1.25
- Berry NA, Walker MK, Butler RC. 2009. Laboratory studies to determine the efficacy of selected insecticides on tomato/potato psyllid. NZ Plant Protection. 62:145–151.
- Binns MR, Nyrop P. 1992. Sampling insect populations for the purpose of IPM decision making. Ann Rev Entomol. 37:427–453. doi: 10.1146/annurev.en.37.010192.002235
- Brennan EB, Weinbaum SA. 2001. Psyllid responses to colored sticky traps and the colors of juvenile and adult leaves of the heteroblastic host plant Eucalyptus globulus. Environ Entomol. 30:365–370. doi: 10.1603/0046-225X-30.2.365
- Butler CD, Trumble JT. 2012. The potato psyllid, Bactericera cockerelli (Sulc) (Hemiptera: Triozidae): life history, relationship to plant diseases, and management strategies. Terrestrial Arthropod Rev. 5:87–111. doi: 10.1163/187498312X634266
- Cameron PJ, Surrey MR, Wigley PJ, Anderson JAD, Hartnett DE, Wallace AR. 2009. Seasonality of bactericera cockerelli in potatoes (solanum tuberosum) in South Auckland, New Zealand. NZ J Crop Hort Sci. 37:295–301. doi: 10.1080/01140671.2009.9687584
- Cowan T, Gries G. 2009. Ultraviolet and violet light: attractive orientation cues for the Indian meal moth, Plodia interpunctella. Entomologia Experimentalis et Applicata. 131:148–158. doi: 10.1111/j.1570-7458.2009.00838.x
- Farnier K, Dyer AG, Steinbauer MJ. 2014. Related but not alike: not all Hemiptera are attracted to yellow. Frontiers Ecol Evol. 2:67. doi: 10.3389/fevo.2014.00067
- Geary I, Merfield CN, Hale RJ, Hodge S. 2016. Predation of nymphal tomato potato psyllid, Bactericera cockerelli (Šulc) (Hemiptera: Triozidae), by the predatory mite, Anystis baccarum L. (Trombidiformes: Anystidae). NZ Entomol. 39:110–116. doi: 10.1080/00779962.2016.1218525
- Gharalari A, Nansen C, Lawson D, Gilley J, Munyaneza J, Vaughn K. 2009. Knockdown mortality, repellency, and residual effects of insecticides for control of adult Bactericera cockerelli (Hemiptera: Psyllidae). J Econ Entomol. 102:1032–1038. doi: 10.1603/029.102.0322
- Guenthner J, Goolsby J, Greenway G. 2012. Use and cost of insecticides to control potato psyllids and zebra chip on potatoes. Southwestern Entomol. 37:263–270. doi: 10.3958/059.037.0302
- Hegazi E, Khafagi WE, Konstantopoulou M, Raptopoulos D, Tawfik H, Abd El-Aziz GM, Abd El-Rahman SM, Atwa A, Aggamy E, Showeil S. 2009. Efficient mass-trapping method as an alternative tactic for suppressing populations of leopard moth (Lepidoptera: Cossidae). Annals Entomol Soc Amer. 102:809–818. doi: 10.1603/008.102.0507
- Hodge S, Powell G. 2010. Conditional facilitation of an aphid vector, Acyrthosiphon pisum, by the plant pathogen, pea enation mosaic virus. J Insect Sci. 10:155. doi: 10.1673/031.010.14115
- Jorgensen N, Butler RC, Vereijssen J. 2013. Biorational insecticides for control of the tomato potato psyllid. NZ Plant Protection. 66:333–340.
- Katsuki M, Omae Y, Okada K, Kamura T, Matsuyama W. 2012. Ultraviolet light-emitting diode (UV LED) traps the West Indian sweet potato weevil, Euscepes postfasciatus (Coleoptera: Curculionidae). Appl Entomol Zool. 47:285–290. doi: 10.1007/s13355-012-0113-y
- Liefting LW, Perez-Egusquiza ZC, Clover GRG, Anderson JAD. 2008. A new ‘candidatus liberibacter’ species in Solanum tuberosum in New Zealand. Plant Disease. 92:1474–1474. doi: 10.1094/PDIS-92-10-1474A
- Mainali BP, Lim UT. 2010. Circular yellow sticky trap with black background enhances attraction of Frankliniella occidentalis (Pergande) (Thysanoptera: Thripidae). Appl Entomol Zool. 45:207–213. doi: 10.1303/aez.2010.207
- Martin NA. 2008. Host plants of the potato/tomato psyllid: a cautionary tale. The Weta. 35:12–16.
- Merfield CN, Geary IJ, Hale RJ, Hodge S. 2015. Field evaluation of the effectiveness of mesh crop covers for the protection of potatoes from tomato potato psyllid. NZ J Crop Hort Sci. 43:123–133. doi: 10.1080/01140671.2015.1015576
- Mutwiwa U, Tantau H. 2005. Suitability of a UV lamp for trapping greenhouse whitefly Trialeurodes vaporarium Westwood (Homoptera: Aleyrodidae). Agricultural Engineering International. 7:1–11.
- Page-Weir NEM, Chhagan A, Jamieson LE, Poulton J, Davis VA, Griffin M, Connolly PG. 2012. The phenology of tomato/potato psyllid (TPP) in tamarillos and efficacy of insecticides against TPP. Plant & Food Report, SPTS No. 7407.
- Page-Weir NEM, Jamieson LE, Chhagan A, Connolly PG, Curtis C. 2011. Efficacy of insecticides against the tomato/potato psyllid (bactericera cockerelli). NZ Plant Protection. 64:76–281.
- Paris TM, Croxton SD, Stansly PA, Allan SA. 2015. Temporal response and attraction of Diaphorina citri to visual stimuli. Entomologia Experimentalis et Applicata. 155:137–147. doi: 10.1111/eea.12294
- Prager SM, Vindiola B, Kund GS, Byrne FJ, Trumble JT. 2013a. Considerations for the use of neonicotinoid pesticides in management of Bactericera cockerelli (Sulk) (Hemiptera: Triozidae). Crop Protection. 54:84–91. doi: 10.1016/j.cropro.2013.08.001
- Prager SM, Butler CD, Trumble JT. 2013b. A sequential binomial sampling plan for potato psyllid (Hemiptera: Triozidae) on bell pepper (Capsicum annum). Pest Manag Sci. 69:1131–1135. doi: 10.1002/ps.3475
- Shimoda M, Honda K. 2013. Insect reactions to light and its applications to pest management. Appl Entomol Zool. 48:413–421. doi: 10.1007/s13355-013-0219-x
- Stukenberg N, Gebauer K, Poehling H-M. 2015. Light emitting diode (LED)-based trapping of the greenhouse whitefly (Trialeurodes vaporariorum). J Appl Entomol. 139:268–279. doi: 10.1111/jen.12172
- Taylor NM, Butler RC, Vereijssen J, Davidson MM. 2014. Trap colour, size, and borders alter catches of Bactericera cockerelli in a potato crop. Entomologia Experimentalis et Applicata. 150:226–231. doi: 10.1111/eea.12157
- Teulon DAJ, Workman PJ, Thomas KL, Nielsen M-C. 2009. Bactericera cockerelli: incursion, dispersal and current distribution on vegetable crops in New Zealand. NZ Plant Protection. 62:136–144.
- Tomatoes New Zealand Inc. 2016. New Zealand code of practice for the management of tomato/potato psyllid (TPP) in greenhouse tomato and capsicum crops. 3rd ed. Wellington: Tomatoes New Zealand Inc. and Vegetables New Zealand Inc.; pp. 24.
- Vereijssen J, Jorgensen N, Taylor NM, Barnes A-M, Butler RC, Berry N, Scott IAW, Thompson S, Davidson MM. 2013. Movement of Bactericera cockerelli in the New Zealand environment. Proceedings of the 13th Annual SCRI Zebra Chip Reporting Session; San Antonio( TX) USA. p. 24–28.
- Walker GP, MacDonald FH, Larsen NJ, Wallace AR. 2011. Monitoring Bactericera cockerelli and associated insect populations in potatoes in south auckland. NZ Plant Protection. 64:269–275.
- Walker GP, MacDonald FH, Larsen NJ, Wright PJ, Wallace AR. 2013a. Sub-sampling plants to monitor tomato-potato psyllid (Bactericera cockerelli) and associated insect predators in potato crops. NZ Plant Protection. 66:341–348.
- Walker GP, MacDonald FH, Puketapu AJ, Wright PJ, Connolly PG, Anderson JAD. 2013b. A field trial to assess action thresholds for management of Bactericera cockerelli in main crop processing potatoes at Pukekohe. NZ Plant Protection. 66:349–355.
- Walker PW, Allen GR, Tegg RS, White LR, Wilson CR. 2015. The tomato potato psyllid, Bactericera cockerelli (Šulc, 1909) (Hemiptera: Triozidae): a review of the threat of the psyllid to Australian solanaceous crop industries and surveillance for incursions in potato crops. Austral Entomol. 54:339–349. doi: 10.1111/aen.12129