
 ?Mathematical formulae have been encoded as MathML and are displayed in this HTML version using MathJax in order to improve their display. Uncheck the box to turn MathJax off. This feature requires Javascript. Click on a formula to zoom.
ABSTRACT
Potatoes are a staple food in New Zealand and a contributing source of dietary cadmium (Cd), although there is little information nationally on the soil and plant factors that affect Cd concentrations in the crop. We measured Cd concentrations in 10 commercial potato cultivars grown in three field sites across New Zealand and assessed the soil factors that affect Cd concentrations. Cadmium concentrations in potato tubers ranged from 0.004 to 0.574 mg kg−1 DW (0.001–0.113 mg kg−1 FW), although overall Cd concentrations were lower than the maximum limit of 0.1 mg kg−1 FW for human consumption. There were significant differences (2.8-fold) in Cd concentrations between potato cultivars, although these varied by site. No significant relationships were found between soil properties and Cd concentrations in potatoes. Management of Cd in potatoes is likely to be most effective by avoiding growing high-Cd-accumulating cultivars in soils with elevated Cd. Further studies could determine if other management factors such as irrigation or type and rates of fertiliser affect Cd concentrations in potatoes.
Introduction
Cadmium (Cd) is a potentially toxic heavy metal and impurity in many phosphorus (P) fertilisers (Williams and David Citation1973). As a result of extensive P fertiliser use, Cd has accumulated in some agricultural soils worldwide (McGrath Citation1986; Johnston et al. Citation1987; Gray et al. Citation1999). There is concern regarding the accumulation of Cd in soils because it can readily be taken up by food crops (Schroeder and Balassa Citation1963; Chaney and Hornick Citation1978; Zhao et al. Citation2015; Baldantoni et al. Citation2016), and then has the potential to enter the human food chain through the crops and crop based products we consume in our diet (Clemens et al. Citation2013; Rietra et al. Citation2017).
Along with rice (Oryza saliva L.) and wheat (Triticum aestivum L.), potatoes (Solanum tuberosum L.) are an important staple food in many parts of the world, but also a source of Cd in the human diet (Fan et al. Citation2009; Rietra et al. Citation2017). Food standards provide for a safe level of intake over a lifetime. Therefore, while an occasional exceedance presents a low health risk, it could present a trade or reputational risk that ultimately affects the viability of potato production systems in New Zealand. It is therefore important that Cd concentrations in potatoes are maintained below maximum acceptable standards set by regulatory bodies. In response, research has been undertaken to identify which soil and plant factors influence Cd concentrations in potatoes to help manage Cd uptake in this crop (McLaughlin et al. Citation1994; Maier et al. Citation2002; Fan et al. Citation2009). In a survey of Cd concentrations in potatoes across 359 sites across Australia, McLaughlin et al. (Citation1997) reported topsoil chloride concentration were best related to Cd concentrations in potatoes with soil pH, total zinc (Zn) and cultivar types only having a small influence on Cd concentrations. In Sweden, Oborn et al. (Citation1995) found that a combination of organic matter content and increasing soil pH were negatively correlated with Cd concentrations in potatoes across 69 commercial field sites. Al Mamun et al. (Citation2017) also showed the importance of increased soil pH and organic matter on reduction of Cd concentrations in potatoes. In contrast, Tack (Citation2014) reported no relationship between potato Cd concentrations and topsoil pH and organic matter across 21 sites in Belgium. As well as soil factors, significant differences in Cd concentrations between potato cultivars has sometimes been reported (McLaughlin et al. Citation1994, Citation1997; Dunbar et al. Citation2003; Ashrafzadeh et al. Citation2017). Ozturk et al. (Citation2011) for instance showed Cd concentrations in potato tubers ranged between 0.08 and 0.32 mg kg−1 DW in 16 cultivars from Turkey.
In line with many Western countries and South America, potatoes are a staple food in New Zealand and an important contributory source of dietary Cd (Pearson et al. Citation2018). Furthermore, potatoes are also a key export crop, worth an estimated $113 M in 2017 (Plant and Food Research Citation2017). Few studies have measured Cd concentrations in potatoes in New Zealand (e.g. Roberts et al. Citation1995; Kim Citation2005; Ashrafzadeh et al. Citation2017), and there is little information on the effects of soil properties and cultivar differences on Cd concentrations in potatoes across the main commercial growing areas (Pukekohe, Manawatū, Hawkes Bay and Canterbury). This information is important to determine if Cd concentrations in potatoes are currently compliant with national maximum limits (ML) for Cd of 0.1 mg kg−1 FW outlined in the Food Standards of Australia and New Zealand (FSANZ) standard 1.4.1.
In addition, to address the concerns of Cd accumulation in New Zealand soils, a Cadmium Management Strategy (CMS) based on an assessment of the risk Cd poses to agricultural systems has been released (MAF Citation2011). The objective of the strategy is to ensure that ‘Cd in rural production poses minimal risks to health, trade, land use flexibility and the environment over the next 100 years’. The strategy outlines a risk-based framework for managing Cd accumulation in agricultural soils that focuses on a Tiered Fertiliser Management System (TFMS). The TFMS contains five tiers and four trigger concentrations, whereby as soil Cd concentrations increase, increasingly stringent fertiliser management practices are imposed. The trigger values are however considered only interim (Warne Citation2011), because there was little New Zealand-specific Cd data available at the time to inform their development. As a result, some overseas soil guideline values were used. It is uncertain however how robust these overseas trigger values are for protecting New Zealand agricultural systems. Total soil Cd concentrations tend to be lower than many other countries (Roberts et al. Citation1994). However, there have still been occasional exceedances of our food standards for Cd (Gray et al. Citation2001; Kim Citation2005). Therefore, for some regions of New Zealand, the trigger values currently in the TFMS may not be sufficiently consistent with the CMS’s objectives outlined above.
The development of New Zealand-specific risk-based trigger values firstly requires New Zealand-specific Cd data in a range of geographic areas, including plant concentrations in important food crops such as potatoes, along with information on the soil and plant factors which control Cd concentrations. The objectives of this study were (i) to determine Cd concentrations in 10 economically important potato cultivars, and (ii) to determine Cd concentrations in two potato cultivars grown across the main commercial potato cropping regions of New Zealand to assess the relationships between soil factors and Cd concentrations in potatoes.
Materials and methods
Sites and sampling
Soil cores and potato samples were collected from a combination of research trials and commercial field sites. In 2015, Cd concentrations were determined in 10 potato cultivars at Lincoln, eight at Pukekohe and two at the Waikato site (). In 2016 and 2017, Cd concentrations were determined in two commonly used potato cultivars (Moonlight and Innovator) grown across 35 commercial and research sites (). The sites covered seven of the 15 soil orders in New Zealand (Hewitt Citation2010) (data not shown).
Table 1. Summary of sites and details of soil and plant sampling.
Analysis
Soil and plant analysis
Soils were oven-dried (35°C) and sieved (<2 mm) before analysis. Soil pH was determined in a 1:2 soil:water solution by potentiometric analysis (Blakemore et al. Citation1987). Exchangeable potassium (K), calcium (Ca), magnesium (Mg) and sodium (Na) were measured in a 1 M ammonium acetate extracted at pH 7 (Blakemore et al. Citation1987) and analysed by Inductively Coupled Plasma Optical Emission Spectrometry (ICP-OES). Cation exchange capacity (CEC) was calculated by summing concentrations of extractable cations and extractable acidity. Bioavailable P (Olsen P) was determined by bicarbonate extraction (Olsen et al. Citation1954). Total carbon (C) and nitrogen (N) were determined by combustion using an Elementar Vario-Max CN Elemental analyser. Soil chloride concentrations were measured in a filtered 1:5 soil:water extract by ion chromatography. Pseudo total concentrations of Cd, Zn, P, aluminium (Al) and iron (Fe) were determined by microwave digestion using nitric acid and hydrogen peroxide as reported by Simmler et al. (Citation2013); these will be referred to forthwith as total concentrations for simplicity. The digests were analysed by Inductively-Coupled Plasma Mass Spectrometry (ICP-MS) for Cd and ICP-OES for Zn, P, Al and Fe. Particle size analysis was measured using the pipette method (Claydon Citation1989).
Potato tubers were washed, peeled, roughly chopped, weighed, dried at 60°C to constant weight, and weighed again to enable reporting of data as fresh weight (FW) and dry weight (DW). Dried tubers were ground before digestion using the nitric acid and hydrogen peroxide microwave digestion method described by Cindrić et al. (Citation2015). The digests were analysed for Cd by ICP-MS. In a selection of samples, peel was separated from the potatoes and the peel and flesh analysed separately for Cd and titanium (an indicator of soil contamination) by ICP-MS.
Quality control/assurance
Soil and plant samples were digested in batches of up to 40. Each batch included at least one digestion blank. One out of every 20 samples were analysed in duplicate to confirm repeatability of the analysis. Cadmium concentrations in procedural blanks were less than the detection limit and duplicate analysis of samples were within 5% of each other. The accuracy of soil and plant analysis was assessed using several internal and external certified reference materials including for soil (NIST Montana 2711; Interlab internal WEPAL soil 921; Interlab internal WEPAL soil 981), and plant (NIST 1573a, tomato leaves; ASPAC internal clover; ASPAC internal beetroot). Analytical results were within 5% of the certified values. The method detection limit for soil Cd was 0.020 mg kg−1 and 0.005 mg kg−1 in plant material.
Statistics
Statistical analyses were conducted using tuber Cd concentrations expressed on a dry weight basis. Comparison of Cd concentrations in cultivars within a site and between sites was undertaken separately using one-way ANOVA and data checked for normality by assessing residual plots. The data was not required to be transformed and the effects were considered significant if they differed at the probability level of 5% based on Fisher’s unprotected least significant difference (LSD) test. The relationship between the concentration of Cd in the tubers and soil characteristics was determined by linear and stepwise (forward) multiple regression analyses. All analyses were performed using GENSTAT for Windows v18.
Transfer coefficient
The transfer coefficient (TC) is a very commonly used measure to assess the transfer of inorganic contaminants such as Cd from soil to different plant organs (Alloway Citation1990). In this study it was the Cd concentration in the potato tuber divided by the total soil Cd concentration Equation (1):(1)
(1)
Equation (1) can be rearranged to indicate the soil concentration at which a specific plant concentration is reached at a given site, assuming conditions such as soil properties (and therefore TC) do not change. Using the food standard as the target plant concentration (Cdtuber limit), a conservative estimate of the soil concentration at which the food standard can be reached (nCdfood standard) can be calculated (Equation 2). As the food standard is expressed as fresh weight, this requires conversion to a Cd concentration based on dry weight. The mean and standard error of the dry weight of potato samples measured in this study was 19.9% (0.3). This is consistent with the dry weight value (20%) which has been used to transform fresh weight to dry weight in potatoes in several other studies (Oporto et al. Citation2007; Fan et al. Citation2009; Tack Citation2014; Ashrafzadeh et al. Citation2017). A dry weight of 20% was therefore used in Equation 2.(2)
(2) These values are not intended as threshold limits, but rather provide an insight into soil properties influencing plant uptake and the Cd concentrations at which management to mitigate the risk of exceeding food standards may be considered.
Results and discussion
Effect of cultivar type – 2015
Cadmium concentrations in potato tuber cultivars ranged between 0.040 and 0.275 mg kg−1 DW (n = 70) (), with a mean concentration of 0.135 mg kg−1 DW (0.032 mg kg−1 FW). The mean concentration is similar to that previously reported (0.140 mg kg−1 DW) in a survey of potatoes sold commercially in the Waikato region (largely grown in Pukekohe) (Kim Citation2005), but higher than an earlier study (0.100 mg kg−1 DW) of potatoes grown at Pukekohe (Roberts et al. Citation1995). Although, if only considering potatoes from the Pukekohe site, the mean concentration in the present study (0.070 mg kg−1 DW) is lower than both previous studies. Cadmium concentrations are within the range of mean values reported in several overseas studies (0.02–0.40 mg kg−1 DW) (Thomas et al. Citation1972; Wolnik et al. Citation1983; Zurera et al. Citation1987; Oborn et al. Citation1995; McLaughlin et al. Citation1997; Karavoltsos et al. Citation2002; Radwan and Salama Citation2006; Fan et al. Citation2009; Luis et al. Citation2014; Lin et al. Citation2015; Norton et al. Citation2015). As reported the moisture content in our potatoes was 80% (w/w). Therefore, the FW Cd concentrations of the tubers ranged from 0.009 to 0.069 mg kg−1. These Cd concentrations are lower than the FSANZ standard 1.4.1 ML for Cd in potatoes of 0.1 mg kg−1 FW, which is the same as the Codex Standard 193–1995 (CAC Citation2009) and European Commission food standards (EC 1661/2006) for peeled potatoes.
Table 2. Potato tuber Cd concentrations (mg kg−1 DW) in different cultivars at Pukekohe, Waikato and Lincoln.
In some instances, potatoes are consumed without removing the peel. It is therefore important to also know what the Cd concentration is in the potato peel, and the relative mass of the peel to the whole potato. In a subset of samples, the potato peel and the flesh were separated and analysed for Cd. Results showed that in all instances, Cd concentrations in the potato peel were higher (1.3–2.3 fold) than the flesh (). This is consistent with what others have previously reported for Cd (Corguinha et al. Citation2012; Šrek et al. Citation2012; Norton et al. Citation2015), and other trace metals such as Zn, Fe, manganese, nickel and copper (Subramanian et al. Citation2011; Šrek et al. Citation2012).
Figure 1. Comparison of cadmium concentrations (mg kg−1 DW) in the flesh or peel in potato cultivars from the Lincoln research trial site.
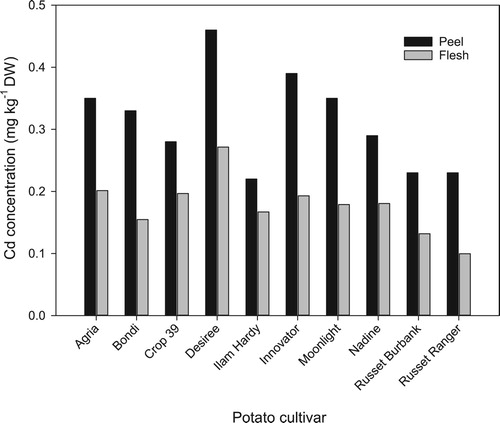
Although the peel contained higher Cd concentrations (0.041–0.080 mg kg−1 FW) than the flesh, it was determined for a range of cultivars (and different sized potatoes), the peel constitutes only 10–17% of the mass of the whole potato (data not shown). As a result, even if potatoes were prepared and eaten without removing the peel, Cd concentrations in the whole potato would still remain compliant with the ML of 0.1 mg kg−1 FW.
There were significant differences in tuber Cd concentrations between cultivars (). At Pukekohe and Lincoln, Cd concentrations varied 2.8 and 2.4 fold respectively, although the difference was less between the two cultivars grown at the Waikato site. Several studies have previously reported variation in Cd concentrations between potato cultivars (Roberts et al. Citation1995; McLaughlin et al. Citation1997; Jönsson and Asp Citation2011; Corguinha et al. Citation2012; Luis et al. Citation2014). In some of these studies, Cd concentrations between cultivars varied by a similar magnitude as found in this study (Dunbar et al. Citation2003; Mengist et al. Citation2017), although others have reported a larger range. For instance, Ashrafzadeh et al. (Citation2017) showed Cd concentrations in potato tubers ranged between 0.05 and 0.21 mg kg−1 DW in 10 cultivars grown at a single site in Lincoln, New Zealand.
It is also important to note that while there were differences in Cd concentrations between cultivars, they were often inconsistent. At the Lincoln site for example, Desiree had the highest Cd concentration, but had one of the lowest Cd concentrations at the Pukekohe site. Nadine had the highest Cd concentration at Pukekohe but had one of the lower Cd concentrations at Lincoln. An exception was Russet Ranger, which had the lowest Cd concentration at both Lincoln and Pukekohe. It is not clear at present why there was this inconsistency. A next step would be to collect data on Cd concentrations in these cultivars across a greater number of sites and seasons to determine if this inconsistency is still maintained.
Compared to other crops (i.e. wheat, rice), there have been few studies that have investigated the mechanisms that control the variation in Cd concentrations in different potato cultivars. Dunbar et al. (Citation2003) and Mengist et al. (Citation2018, Citation2017) both suggest differences are due in part to differential partitioning of Cd between organs (tuber, roots, stem and leaves) within the plant. Mengist et al. (Citation2017) for instance found differences in both the shoot Cd concentration and leaf Cd mobilisation between a low and a high Cd accumulating cultivar. The high Cd accumulator had a higher shoot Cd concentration and remobilisation of Cd from leaves to tubers, thought to be driven by differences in shoot biomass (Mengist et al. Citation2018). Although, unlike Dunbar et al. (Citation2003), Mengist et al. (Citation2017) also indicate that differences in total plant uptake of Cd are important, with higher uptake in the high Cd accumulating cultivar, although the mechanism was not known. Regardless of the mechanism, the variation in Cd uptake in potatoes highlights the potential to use low Cd accumulating cultivars (e.g. Russet Ranger) at sites where there is high Cd uptake. Additionally, including Cd accumulation as one of the traits in future cultivar evaluation trials, which at present is not common practice (Clemens et al. Citation2013), alongside more commonly assessed traits such crop yield and disease resistance should be considered.
A comparison of tuber Cd concentrations in two cultivars (Agria and Moonlight) grown at all three sites showed that Cd concentrations were highest at Lincoln, then Waikato and lowest at the Pukekohe site (). Cadmium concentrations were not related to the total soil Cd concentration, as the Lincoln site had the lowest soil Cd concentration (0.18 mg kg−1), although it did have the lowest pH (6.0), a soil factor known to effect Cd availability in soils (Alloway Citation1990). The comparatively low Cd concentrations in potatoes at Pukekohe may be a result of the high clay content (59%) and pH (6.5), both properties shown to limit Cd availability in soils (Chaney and Hornick Citation1978; Tiller et al. Citation1994). The small number of sites and narrow range of soil properties in the 2015 trials limits any comparison between Cd concentrations and soil properties. As a result, a larger comparison between Cd concentrations and soil properties was undertaken and reported below.
Survey of Cd concentrations in potatoes and soil properties – 2016 and 2017
Soil properties
Total soil Cd concentrations ranged between 0.09 and 0.86 mg kg−1 (a). The mean concentration of 0.36 mg kg−1 is slightly higher than the mean Cd concentration of 0.28 mg kg−1 reported for cropping soils in New Zealand (Cavanagh Citation2014). Most samples (88%) had soil Cd concentrations below the TFMS tier 1 trigger of 0.6 mg kg−1. There were significant differences in total Cd concentrations between regions, with Waikato and Pukekohe higher than Canterbury and Manawatū-Whanganui (a), in line with what is observed in larger surveys (Cavanagh Citation2014). Other soil properties recognised as affecting plant concentrations of Cd also varied and are reported in . Soil pH ranged from low to high, while total C and CEC were low to medium (Blakemore et al. Citation1987). The majority of soils were classified as silt loams.
Figure 2. (A) Total soil cadmium concentration (mg kg−1) in each region (MW = Manawatū–Wanganui; Puke = Pukekohe). The dashed line is the TFMS trigger 1 value. (B) Mean cadmium concentrations (mg kg−1 DW) in potatoes for each region. (C) The transfer coefficient for each region. Boxes depict the 25th and 75th percentile values, with horizontal lines plotted within boxes representing the median value. Whiskers show the 10th and 90th percentile values and the points the 5th and 95th percentile values.
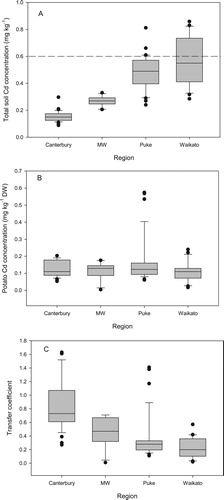
Table 3. Selected soil properties from the survey sites (0–15 cm).
Cadmium concentration in potatoes
Potato tuber Cd concentrations ranged between 0.004 and 0.574 mg kg−1 DW, with a mean concentration of 0.129 mg kg−1 DW (0.026 mg kg−1 FW) (b), although 92% of samples had Cd concentrations < 0.20 mg kg−1 DW. With the exception of two of the three replicates from a single site at Pukekohe, Cd concentrations in potato tubers were well below the FSANZ limit of 0.5 mg kg−1 DW (assuming a dry weight content of 20%). The reason for the higher values at one of the Pukekohe sites is unknown as there were no obvious soil differences. Unlike the other sites surveyed, potatoes were the first crop at this site after it had been in long-term pasture.
There was no significant difference (P = 0.080) in the mean Cd concentrations between Innovator (0.111 mg kg−1 DW) and Moonlight (0.134 mg kg−1 DW). Furthermore, there was no significant difference in tuber Cd concentrations between regions (b). This is in contrast with soil Cd concentrations and resulted in a marked regional variation in the transfer coefficient (c), highlighting that the differences in tuber concentrations could be expected to be attributed to other soil properties affecting Cd phyto-availability or total plant uptake. Very few studies have reported TC values for potatoes to allow comparison with the present study. An exception is Ashrafzadeh et al. (Citation2017) who reported TC values between 0.095 and nearly 6.0 for ten cultivars from the same site.
Relationship between potato Cd concentrations and soil properties
There were no significant relationships between potato tuber Cd concentrations and soil factors commonly shown to affect Cd concentrations, such as organic C, CEC, total Cd, total Zn, and soil Cl concentration (McLaughlin et al. Citation1996) (). The only significant variables were total soil Al, extractable Na and base saturation, that individually explained at most 8% of the variation in potato Cd concentration. The majority (86%) of the data used for exploring the relationships were from a single cultivar, discounting plant factors confounding the relationships. As reported, comparison of Cd concentrations between the two cultivars were not significantly different. Hence, in the relationship analysis, cultivar difference would be small as one cultivar dominated the data and Cd concentrations did not differ between the two cultivars. Stepwise forward multiple regression analysis indicated a subset of six soil properties i.e. Al + Mn + Na + Fe + P + Zn accounted for 56.9% of the variation in potato tuber Cd concentration ().
Table 4. Single relationships of Cd concentration in potatoes (DW) with soil properties.
Table 5. Coefficients of soil properties and their significance levels
It is uncertain why there were no significant relationships between soil properties such as pH and total Cd which have been previously shown to be important for Cd uptake in potatoes, although the absence of relationships is not unique to this study (e.g. Norton et al. Citation2015). It may simply be that compared to studies that have reported relationships (McLaughlin et al. Citation1997), soil properties in the current study are a lot narrower in range. The lack of a relationship between tuber Cd concentration and CEC may in part be related to the method used to measure CEC. Cation exchange capacity measured using neutral ammonium acetate opposed to the extracting the soil at its field pH, may have overestimated CEC, particularly in the variable charged soils in this study (i.e. Allophanic, Organic). It is also possible that site specific management (e.g. irrigation and fertiliser (quantity, type) application) that has been shown to influence Cd uptake in other crops such as wheat and flax (Grant et al. Citation1996; Jiao et al. Citation2004; Li et al. Citation2011) had some effect on Cd uptake between sites. Another factor that may have confounded results was differences in crop yield between sites. An increase in yield for example for any given cultivar may result in a decrease in that cultivar's Cd concentration. Although requested, yield data was not consistently provided by growers to allow testing of a crop yield effect.
Management of Cd concentrations in potatoes
To provide an approximation of the total soil Cd concentrations above which food standards might be exceeded, nCdfood standard values were derived at individual sites. The mean and 95th percentile range were 0.7 mg kg−1 (0.31–1.4) in Canterbury, 2 mg kg−1 (0.4–3.54) in Pukekohe, 2 mg kg−1 (0.7–7.04) in Manawatū-Whanganui and 4.7 mg kg−1 (1.19–16.7) in the Waikato. There was large variability in values, both within and between regions. This large variability has been noted in other studies. For example, De Vries and McLaughlin (Citation2013) reported critical limits for potatoes in Australia between 0.147 and 0.959 mg kg−1, reflecting the effect of soil pH and soil texture on Cd uptake. Despite the variability, and with the exception of Canterbury, potatoes grown in soils within the upper acceptable limit of the TFMS may be expected to remain within food standards.
In regions such as Canterbury where Cd uptake is high at relatively low soil Cd concentrations, and there is an absence of relationships with soil properties, cultivar management is potentially the best option for ensuring Cd concentrations in potatoes remain compliant with food standards if soil Cd concentrations continue to increase over time. Further, while there is no immediate urgency to identify low-Cd-accumulating cultivars as tuber concentrations are generally much lower than the FSANZ food standard, it would be prudent that potato breeding and selection trials should include Cd uptake as a plant trait to ensure that if high Cd accumulating cultivars are identified across a range of sites, that they do not become widely grown.
Conclusions
This study indicates there is variability in Cd concentrations in potatoes throughout New Zealand, and generally concentrations are much lower than the FSANZ ML. There were significant differences in Cd concentrations between potato cultivars. There were no significant relationships between soil properties such as pH and total Cd which have been previously shown to be important for predicting Cd concentrations in potatoes. With the exception of Canterbury, the derived soil Cd concentrations at which ML for Cd in potatoes might be reached are greater than the upper acceptable limit of the TFMS. Management of Cd in potatoes is likely to be most effective through the use of low-Cd-accumulating cultivars or at least avoiding the wide-spread growing of high-Cd-accumulating cultivars if they are identified from further screening studies. Further studies to determine if other management factors such as irrigation or fertiliser type and rate on Cd concentrations in potatoes are needed.
Acknowledgements
Chikako van Koten provided statistical advice and analysis. Two anonymous referees provided constructive comment that improved the manuscript.
Disclosure statement
No potential conflict of interest was reported by the authors.
ORCID
Colin W. Gray http://orcid.org/0000-0002-5397-8243
Niklas J. Lehto http://orcid.org/0000-0001-8563-2469
Brett H. Robinson http://orcid.org/0000-0003-0322-0255
Kiran Munir http://orcid.org/0000-0001-6600-5734
Jo-Anne E. Cavanagh http://orcid.org/0000-0003-3476-7472
Additional information
Funding
References
- Alloway BJ. 1990. Cadmium. In: Alloway BJ, editor. Heavy metals in soils. Glasgow: Blackie; p. 100–124.
- Al Mamun S, Lehto NJ, Cavanagh J, McDowell R, Aktar M, Benyas E, Robinson BH. 2017. Effects of lime and organic amendments derived from varied source materials on cadmium uptake by potato. Journal of Environmental Quality. 46:836–844. doi: 10.2134/jeq2017.02.0059
- Ashrafzadeh S, Gaw S, Genet R, Glover C, Leung DWM. 2017. Natural variation in correlations between cadmium and micronutrients in potato tubers. Journal of Food Composition and Analysis. 59:55–60. doi: 10.1016/j.jfca.2017.02.008
- Baldantoni D, Morra L, Zaccardelli M, Alfani A. 2016. Cadmium accumulation in leaves of leafy vegetables. Ecotoxicology and Environmental Safety. 123:89–94. doi: 10.1016/j.ecoenv.2015.05.019
- Blakemore LC, Searle PL, Daly BK. 1987. Methods for chemical analysis of soils. Lower Hutt: New Zealand Soil Bureau.
- [CAC] Codex Alimentarius Commission. 2009. Codex general standard for contaminants and toxins in foods, CODEX STAN 193–1995. Rev. 5–2009.
- Cavanagh J. 2014. Status of cadmium in New Zealand soils. Report to the Fertiliser Association of New Zealand.
- Chaney RL, Hornick SB. 1978. Accumulation and effects of cadmium on crops. Proceedings of the first International cadmium Conference. San Francisco, London: Metals Bulletin Ltd. p. 125–140.
- Cindrić IJ, Zeiner M, Pozgaj M, Silic T, Stingeder G. 2015. Elemental characterisation of the medical plant Alchemilla velebitica. Journal of Trace Elements in Medicine and Biology. 31:274–278. doi: 10.1016/j.jtemb.2014.09.008
- Claydon JJ. 1989. Determination of particle size in fine grained soils – pipette method. Lower Hutt: DSIR Division of Land & Soil Sciences Technical Record LH5.
- Clemens S, Aarts MGM, Thomine S, Verbruggen N. 2013. Plant science: the key to preventing slow cadmium poisoning. Trends in Plant Science. 18:92–99. doi: 10.1016/j.tplants.2012.08.003
- Corguinha APB, Gonçalves VC, de Souza GA, de Lima WEA, Penido ES, Pinto CABP, Francisco EAB, Guilherme LRG. 2012. Cadmium in potato and soybeans: Do phosphate fertilization and soil management systems play a role? Journal of Food Composition and Analysis. 27:32–37. doi: 10.1016/j.jfca.2012.05.001
- De Vries W, McLaughlin MJ. 2013. Modelling the cadmium balance in Australian agricultural systems in view of potential impacts on food and water quality. Science of the Total Environment. 461–462:240–257. doi: 10.1016/j.scitotenv.2013.04.069
- Dunbar KR, McLaughlin MJ, Reid RJ. 2003. The uptake and partitioning of cadmium in two cultivars of potato (Solanum tuberosum L.). Journal of Experimental Botany. 54(381):349–354. doi: 10.1093/jxb/erg016
- Fan JL, Ziadi N, Belanger G, Parent LE, Cambouris A, Hu ZY. 2009. Cadmium accumulation in potato tubers produced in Quebec. Canadian Journal of Soil Science. 89:435–443. doi: 10.4141/cjss08069
- Grant CA, Bailey LD, Therrien MC. 1996. The effect of N, P, and KCl fertilisers on grain yield and Cd concentration of malting barley. Fertiliser Research. 45:153–161. doi: 10.1007/BF00790665
- Gray CW, McLaren RG, Roberts AHC. 2001. Cadmium concentrations in some New Zealand wheat grain. New Zealand Journal of Crop Horticultural Science. 29:125–136. doi: 10.1080/01140671.2001.9514170
- Gray CW, McLaren RG, Roberts AHC, Condron LM. 1999. The effect of long-term phosphatic fertiliser applications on the amounts and forms of cadmium in soils under pasture in New Zealand. Nutrient Cycling in Agroecosystems. 54:267–277. doi: 10.1023/A:1009883010490
- Hewitt AE. 2010. New Zealand soil classification, 3rd ed. Lincoln: Manaaki Whenua Press, Landcare Research.
- Jiao Y, Grant CA, Bailey LD. 2004. Effects of phosphorus and zinc fertilizers on cadmium uptake and distribution in flax and durum wheat. Journal of the Science of Food and Agriculture. 84:777–785. doi: 10.1002/jsfa.1648
- Johnston AE, Symon CJ, Jones KC. 1987. Retrospective analysis of an archived soil collection. II. Cadmium. Science of the Total Environment. 67:75–89. doi: 10.1016/0048-9697(87)90067-2
- Jönsson LEH, Asp H. 2011. Influence of nitrogen supply on cadmium accumulation in potato tubers. Journal of Plant Nutrition. 34(3):345–360. doi: 10.1080/01904167.2011.536877
- Karavoltsos S, Sakellari A, Dimopoulos M, Dassenakis M, Scoullos M. 2002. Cadmium content in foodstuffs from the Greek market. Food Additives and Contaminants. 19:954–962. doi: 10.1080/02652030210136973
- Kim N. 2005. Cadmium accumulation in Waikato soils. Environment Waikato Technical Report 2005/51. Hamilton, New Zealand, Environment Waikato.
- Li X, Ziadi N, Belanger G, Cai Z, Xu H. 2011. Cadmium accumulation in wheat grain as affected by mineral N fertilizer and soil characteristics. Canadian Journal of Soil Science. 91:521–531. doi: 10.4141/cjss10061
- Lin YW, Liu TS, Guo HY, Chiang CM, Tang HJ, Chen HT, Chen JH. 2015. Relationships between Cd concentrations in different vegetables and those in arable soils, and food safety evaluation of vegetables in Taiwan. Soil Science and Plant Nutrition. 61:983–998. doi: 10.1080/00380768.2015.1078219
- Luis G, Rubio C, Luisoport ETA. 2014. Evaluation of content and estimation of daily intake of cadmium and lead in several varieties of potatoes (Solanum tuberosum L.) cultivated in the Canary Islands (Spain). Journal of Food Protection. 77:659–664. doi: 10.4315/0362-028X.JFP-13-337
- MAF. 2011. Cadmium and New Zealand agriculture and horticulture: a strategy for long term risk management. Technical Paper No: 2011/03. Wellington, New Zealand: Ministry of Agriculture and Forestry. [accessed 2019 March]. https://www.mpi.govt.nz/protection-and-response/environment-and-natural-resources/land-and-soil/cadmium/.
- Maier N, McLaughlin MJ, Heap M, Butt M, Smart M. 2002. Effect of nitrogen source and calcitic lime on soil pH and potato yield, leaf chemical composition, and tuber cadmium concentrations. Journal of Plant Nutrition. 25:523–544. doi: 10.1081/PLN-120003380
- McGrath SP. 1986. The range of metal concentrations in topsoils of England Wales in relation to soil protection guidelines. Trace Substances in Environmental Health. 20:242–252.
- McLaughlin MJ, Maier NA, Rayment GE, Sparrow LA, Berg G, McKay A, Milham P, Merry RH, Smart MK. 1997. Cadmium in Australian potato tubers and soils. Journal of Environmental Quality. 26:1644–1649. doi: 10.2134/jeq1997.00472425002600060026x
- McLaughlin MJ, Palmer LT, Tiller KG, Beech TA, Smart MK. 1994. Increased soil salinity causes elevated cadmium concentrations in field-grown potato tubers. Journal of Environmental Quality. 23:1013–1018. doi: 10.2134/jeq1994.00472425002300050023x
- McLaughlin MJ, Tiller KG, Naidu R, Stevens DP. 1996. Review: the behaviour and environmental impact of contaminants in fertilizers. Australian Journal of Soil Research. 34:1–54. doi: 10.1071/SR9960001
- Mengist MF, Milbourne D, Alves S, McLaughlin MJ, Jones PW, Griffin D. 2018. Roles of shoots and roots in cadmium uptake and distribution in tubers of potato (Solanum tuberosum L). Plant Soil. 430:139–149. doi: 10.1007/s11104-018-3717-3
- Mengist MF, Milbourne D, Griffin D, Mike J, McLaughlin MJ, Creedon J, Jones PW, Alves S. 2017. Cadmium uptake and partitioning in potato (Solanum tuberosum L.) cultivars with different tuber-Cd concentration. Environmental Science and Pollution Research. 24:27384–27391. doi: 10.1007/s11356-017-0325-3
- Norton GJ, Deacon CM, Mestrot A, Feldmann J, Jenkins P, Baskaran C, Meharg AA. 2015. Cadmium and lead in vegetable and fruit produce selected from specific regional areas of the UK. Science of the Total Environment. 533:520–527. doi: 10.1016/j.scitotenv.2015.06.130
- Oborn I, Jansson G, Johnsson L. 1995. A field study on the influence of soil pH on trace element levels in spring wheat (Triticum aestivum), potatoes (Solanum tuberosum) and carrots (Daucus carota). Water Air Soil Pollution. 85:835–840. doi: 10.1007/BF00476933
- Olsen SR, Cole CV, Watanabe FS, Dean LA. 1954. Estimation of available phosphorus in soils by extraction with sodium bicarbonate. USDA Circular 939. Washington, DC: U.S. Government Printing Office.
- Oporto C, Vandecasteele C, Smolders E. 2007. Elevated cadmium concentrations in potato tubers due to irrigation with river water contaminated by mining in Potosi, Bolivia. Journal of Environmental Quality. 36:1181–1186. doi: 10.2134/jeq2006.0401
- Ozturk E, Atsan E, Polat T, Kara K. 2011. Variation in heavy metal concentrations of potato (Solanum tuberosum L. cultivars. The Journal of Animal and Plant Science. 21:235–239.
- Pearson A, Gibbs M, Lau K, Edmonds J, Alexander D, Nicolas J. 2018. 2016 New Zealand total diet study. Wellington: Ministry of Primary Industries.
- Plant and Food Research. 2017. Fresh facts. [accessed 2018 July 4]. http://www.freshfacts.co.nz/files/freshfacts-2017.pdf.
- Radwan MA, Salama AK. 2006. Market basket survey for some heavy metals in Egyptian fruits and vegetables. Food and Chemical Toxicology. 44:1273–1278. doi: 10.1016/j.fct.2006.02.004
- Rietra RPJJ, Mol G, Rietjens IMCM, Romkens PFAM. 2017. Cadmium in soil, crops and resultant dietary exposure. Wageningen Environmental Research, Report 2784, p. 40.
- Roberts AHC, Longhurst RD, Brown MW. 1994. Cadmium status of soils, plants, and grazing animals in New Zealand. New Zealand Journal of Agricultural Research. 37:119–129. doi: 10.1080/00288233.1994.9513048
- Roberts AHC, Longhurst RD, Brown MW. 1995. Cadmium survey of South Auckland market gardens and Mid Canterbury wheat farms. Report to the New Zealand Fertiliser Manufacturers Research Association.
- Schroeder HA, Balassa JJ. 1963. Cadmium: uptake by vegetables from superphosphate in soil. Science. 140:819–820. doi: 10.1126/science.140.3568.819
- Simmler ML, Ciadamidaro R, Schulin P, Madejón R, Reiser R, Clucas L, Weber P, Robinson B. 2013. Lignite reduces the solubility and plant uptake of cadmium in pasturelands. Environmental Science and Technology. 47:4497–4504. doi: 10.1021/es303118a
- Šrek P, Heicmanl M, Kunzova E. 2012. Effect of long-term cattle slurry and mineral N, P and K application on concentrations of N, P, K, Ca, Mg, As, Cd, Cr, Cu, Mn, Ni, Pb and Zn in peeled potato tubers and peels. Plant Soil and Environment. 58:167–173. doi: 10.17221/610/2011-PSE
- Subramanian NK, White PJ, Broadley MR, Ramsay G. 2011. The three-dimensional distribution of minerals in potato tubers. Annals of Botany. 107:681–691. doi: 10.1093/aob/mcr009
- Tack FMG. 2014. Trace elements in potato. Potato Research. 57:311–325. doi: 10.1007/s11540-014-9268-y
- Thomas B, Roughan JA, Watters ED. 1972. Lead and cadmium content of some vegetable foodstuffs. Journal Science Food and Agriculture. 23:1493–1498. doi: 10.1002/jsfa.2740231215
- Tiller KG, Oliver DP, McLaughlin MJ, Merry RH, Naidu R. 1994. Managing cadmium contamination of agricultural land. In ‘Advances in Environmental Science. Biogeochemistry of Trace Metals 2’.
- Warne M. 2011. Review of, and recommendations for, the proposed New Zealand Cadmium Management Strategy and Tiered Fertiliser Management System for Ministry of Agriculture and Forestry, p. 46. MAF Technical Paper No: 2011/03. [accessed 2019 March]. https://www.mpi.govt.nz.
- Williams CH, David DJ. 1973. The effect of superphosphate on the cadmium content of soils and plants. Australian Journal of Soil Research. 11:43–56. doi: 10.1071/SR9730043
- Wolnik KA, Wolnik FL, Fricke SG, Capar GL, Braude MW, Meyer RD, Satzger E, Bonnin E. 1983. Elements in major raw agricultural crops in the United States. 1. Cadmium and lead in lettuce, peanuts, potatoes, soybeans, sweet corn and wheat. Journal of Agriculture and Food Chemistry. 31:1240–1244. doi: 10.1021/jf00120a024
- Zhao F, Ma Y, Zhu Y, Tang Z, McGrath SP. 2015. Soil contamination in China: current status and mitigation strategies. Environmental Science and Technology. 49:750–759. doi: 10.1021/es5047099
- Zurera G, Estrada B, Rincon F, Pozo R. 1987. Lead and cadmium contamination levels in edible vegetables. Bulletin of Environmental Contamination and Toxicology. 38:805–812. doi: 10.1007/BF01616705