
ABSTRACT
Deep Learning has been applied for the crop yield prediction problem, however, there is a lack of systematic analysis of the studies. Therefore, this study aims to provide an overview of the state-of-the-art application of Deep Learning in crop yield prediction. We performed a Systematic Literature Review (SLR) to identify and analyze the most relevant papers. We retrieved 456 relevant studies of which we selected 44 primary studies for further analysis after applying selection and quality assessment criteria to the relevant studies. A thorough analysis and synthesis of the primary studies were performed with respect to the key motivations, the target crops, the algorithms applied, the features used, and the data sources used. We observed that Convolutional Neural Network (CNN) is the most common algorithm and it has the best performance in terms of Root Mean Square Error (RMSE). One of the most important challenges is the lack of a large training dataset and thus, the risk of overfitting and as a result, lower model performance in practice. For researchers in this field, it is valuable to indicate the current challenges and the possibility for further research, because they tend to focus on the importance of missing research topics.
Introduction
The crop yield depends on multiple factors such as the weather and soil conditions, the crop, the use of fertiliser, and the seed variety (Xu et al. Citation2019; van Klompenburg et al. Citation2020). Various crop simulation and yield estimation models have been used for reasonable results on crop yield estimation (Filippi et al. Citation2019; van Klompenburg et al. Citation2020). There is a tendency among researchers to apply the methods of Deep Learning for crop yield estimations based on the aforementioned factors.
Although Deep Learning algorithms can provide a better performance, challenges of using Deep Learning techniques for crop yield prediction are lacking in the literature. They both depend on the crop type, the kind of data, the sources, and the implementation framework. In this study, we perform a Systematic Literature Review (SLR) to get an overview of the literature on these topics.
Our observations regarding this study are beneficial not only for researchers in this field but also for practitioners who would like to develop novel crop yield prediction models for their own usage. For researchers in this field, the challenges are important since they will be aware of these issues before they develop their own models. For practitioners, the development of new crop yield prediction models involves several challenging steps that are addressed in this SLR paper. For instance, the selection of model parameters and the algorithms require critical thinking using the literature. For this reason, we retrieved 456 relevant studies to perform a systematic review. Also, we defined 10 Research Questions (RQs) in this research that are explained in Section 4.1. Our responses to these questions will help both researchers and practitioners in the field.
The remaining parts of this report are organised as follows: Section 2 provides the related work. Section 3 describes the adopted research methodology followed. Section 4 presents the results of the SLR for the defined research questions. Section 5 presents the discussion and finally, section 6 discusses the conclusions and future work.
Related work
To the best of our knowledge, no systematic literature review has been published regarding the application of Deep Learning in crop yield prediction. While there are some traditional review papers on crop yield prediction and some SLR papers that do not focus on the application of deep learning in crop yield prediction (e.g. traditional machine learning in crop yield prediction. Here, we must distinguish shallow learning from deep learning), there is no SLR paper that focuses on the use of deep learning in crop yield prediction yet. In this respect, a pioneering effort has been made in the present study representing the way for systematically reviewing the state-of-the-art knowledge on the development of Deep Learning-based methods for crop yield prediction.
van Klompenburg et al. (Citation2020) performed an SLR on crop yield prediction using Machine Learning. They concluded that neural networks, especially CNN, LSTM, and DNN are mostly applied for crop yield prediction. Also, they stated that the number of features depends on the study. There are cases where the yield prediction depends on object counting and detection rather than tabular data. Regarding the usage of Deep Learning in image processing, Hani et al. (Citation2020) compared semi-supervised methods with Deep Learning-based methods for fruit detection and counting in apple orchards. They showed that for yield mapping the former methods, such as Gaussian Mixture Models, outperform the latter, based on U-Net, Faster R-CNN, and CNN. Koirala et al. (Citation2019) reviewed the use of Deep Learning methods for fruit counting and estimating yield. They revealed the ability of Deep Learning methods to extract important features while recommending approaches such as CNN detectors, deep regression, and LSTM for estimating the fruit load. Lee et al. (Citation2019) conducted experiments using Deep Learning methods to build a self-predictable crop yield platform based on crop diseases. For the crop disease diagnosis module, they stated that the CNN algorithm outperformed R-CNN and YOLO algorithms. Also, using a ReLU activation function of the artificial neural network showed the highest accuracy for the CYP module. Zhang et al. (Citation2020) reviewed the Deep Learning applications in dense agriculture scenes, including recognition and classification, detection, counting, and yield estimation. The results of their survey showed that Deep Learning outperforms in dense scenes.
Concerning the use of Deep Learning methods with tabular data, Chlingaryan et al. (Citation2018) performed a review for predicting crop yield and estimating nitrogen status with Machine Learning techniques. They concluded that Machine Learning technological improvements, including the Deep Learning subfield of Machine Learning, will have an impact on providing cost-effective and comprehensive solutions. Moreover, they mentioned that the hybrid systems of Machine Learning techniques will play a role in the near future.
The review of Dharani et al. (Citation2021) on crop yield prediction with the use of Deep Learning, showed that hybrid networks and the RNN-LSTM networks outperform all other networks. The reason for the high performance of RNN and LSTM stands on their storage and feedback loop. They resulted that those networks are more capable of making accurate predictions since they can deal with time-series data of crop yield.
In , the main differences between the related studies are presented. The literature appears to contain little on a systematic review analysis on the application of Deep Learning in crop yield prediction. There are not many reviews analyzing and assessing the current work on that topic in an objective way. That means it was up to the reviewers what articles, topics, and methods should be included in their work. Apart from that, the majority of the reviews did not specify or answer technical research questions that would be useful for both the research community and practitioners. As a result, it is still difficult to extract specific information on this topic out of the reviews and thus, it is time-consuming. Also, the current motivation and challenges on this topic are barely mentioned, which does not sound convincing to researchers and practitioners for further research and support. Moreover, there are crops and methods that have not been investigated yet for crop yield prediction. That means future research has to be conducted with no knowledge on the features needed and obstacles that need to be overcome. This can be critically revealed with a systematic literature review. Hence, our aim is to help address these gaps by conducting this SLR and gathering information on the Deep Learning application in crop yield prediction based on the important features and issues.
Table 1. Differences in related work.
Methodology
The SLR process consists of three main steps, each including several sub-steps. In this section, the methodology used for this study is reviewed, including elaborative detailsabout steps of the process and guidelines followed.
The review protocol was developed by initially defining the research questions. The research questions should be addressed by the primary studies and should be answered by data that are extracted and analyzed from those studies. Therefore, a search strategy was set to search for primary studies, including search terms and resources to be searched. Furthermore, both study selection and quality assessment criteria were defined so that to determine which studies should be excluded from the SLR and to assess the individual studies, respectively. Moreover, a data extraction strategy is defined to obtain the information required from each primary study. Last but not least, a synthesis of the extracted data is performed.
Research questions
Defining the right research questions is crucial for the entire SLR methodology (Kitchenham and Charters Citation2007). First of all, we wanted to examine the motivation behind applying Deep Learning for crop yield prediction. It was also important to identify the crops on which the Deep Learning techniques were applied and what features were used for crop yield prediction. Acquiring the data is an important part for every researcher and practitioner. Therefore, identifying data sources was of utmost significance for our study. Moreover, there are various Deep Learning categories, algorithms, and implementation frameworks that are used for several applications of Deep Learning. Thus, we wanted to define them for this SLR by answering the proper research questions. Also, it is good to know which of these algorithms outperforms and how it was evaluated. Lastly, except for the motivation for employing Deep Learning techniques, there are always challenges that researchers and practitioners have to face through the process. For these reasons, the following research questions were defined:
RQ1 – What was the key motivation for applying deep learning for crop yield prediction?
RQ2 – What crops were used for yield estimation with the use of deep learning algorithms?
RQ3 – What data features were used for the crop yield estimation with deep learning algorithms?
RQ4 – What data sources were used?
RQ5 – What deep learning implementation frameworks were used?
RQ6 – What category of deep learning was applied?
RQ7 – What deep learning algorithms were applied?
RQ8 – Which algorithm performed better for crop yield prediction?
RQ9 – What kind of evaluation approaches were used for the models?
RQ10 – What were the challenges and proposed solutions?
Search strategy
The resources that were used for this SLR were digital databases, including the ACM Digital Library, CAB Direct, CABI EBSCOhost, IEEE, IOP Science, MDPI, Science Direct (Elsevier), Scopus, Springer Link, Web of Science, and Wiley. Those scientific databases were selected because they index peer-reviewed journals, compared to Google Scholar search engine that does not have such a constraint and indexes non-peer-reviewed journals or low-quality journals as well.
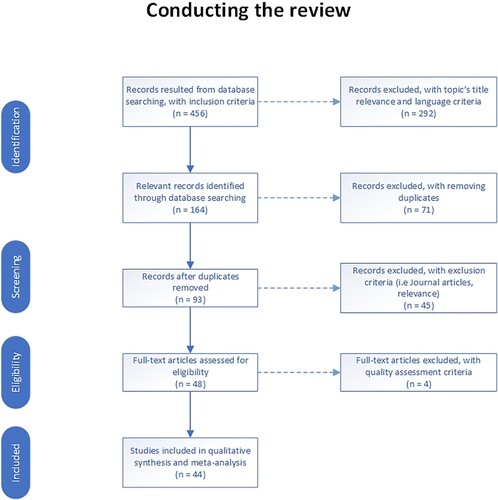
The search strategy for the aforementioned databases was based on the scope of this study as both crop yield prediction and Deep Learning are wide fields. Hence, a specific search string was defined to avoid getting results possibly out of the scope of this study. However, each database follows a different searching method. For this reason, the search string was the same as initially defined, but with some minor adjustments, as shown below. The main search string, i.e (‘yield prediction’ OR ‘yield estimation’) AND ‘deep learning’, was used for searching in Title, Abstract, and Keywords. After employing the search strategy, 456 publication results were retrieved ().
Figure 1. Conducting the review in the SLR process.
ACM Digital Library: The search string used is (‘yield prediction’ OR ‘yield estimation’) AND ‘deep learning’ in the general search bar, searching anywhere. The search was conducted on28/12/2021, providing 12 results.
CAB Direct: The search string used is (‘yield prediction’ OR ‘yield estimation’) AND ‘deep learning’ in the general search bar, searching in Title, Abstract, and Descriptor. The search was conducted on 16/10/2020, providing 6 results.
CABI EBSCOhost: The search string used is (‘yield prediction’ OR ‘yield estimation’) AND ‘deep learning’ in the general search bar, searching in Title, Abstract, and Subjects. The search was conducted on 16/10/2020, providing 25 results.
IEEE: The search string used is (‘yield prediction’ OR ‘yield estimation’) AND ‘deep learning’ in the general search bar, searching anywhere. The search was conducted on28/12/2021, providing 25 results.
IOP Science: The search string used is (‘yield prediction’ OR ‘yield estimation’) AND ‘deep learning’ in the search bar, searching anywhere. The search was conducted on28/12/2021, providing 6 results.
MDPI: The search string used is (‘yield prediction’ OR ‘yield estimation’) AND ‘deep learning’ in the general search bar, searching anywhere. The search was conducted on28/12/2021, providing 16 results.
Science Direct (Elsevier): The search string used is (‘yield prediction’ OR ‘yield estimation’) AND ‘deep learning’ in the general search bar, searching in Title, Abstract, and Keywords. The search was conducted on28/12/2021, providing 26 results.
Scopus: The search string used is (‘yield prediction’ OR ‘yield estimation’) AND ‘deep learning’ in the general search bar, searching by Title, Abstract, and Keywords. The search was conducted on 16/10/2020, providing 118 results.
Springer Link: The search string used is (‘yield prediction’ OR ‘yield estimation’) AND ‘deep learning’ in the general search bar, searching anywhere. The search was conducted on28/12/2021, providing 150 results.
Web of Science: The search string used is (‘yield prediction’ OR ‘yield estimation’) AND ‘deep learning’ in the general search bar, searching in Topic (i.e. Title, Abstract, and Keywords). The search was conducted on 16/10/2020, providing 50 results.
Wiley: The search string used is (‘yield prediction’ OR ‘yield estimation’) AND ‘deep learning’ in the general search bar, searching anywhere. The search was conducted on 16/10/2020, providing 20 results.
Selection criteria
Although we tried to include the most relevant studies by using a well-defined search strategy, there were several studies out of scope. Therefore, some selection criteria were defined to filter those studies and exclude them from the SLR. The exclusion criteria had to do with the relevance of the publication with the use of Deep Learning in crop yield prediction and if the publication was written in English. As already mentioned, multiple databases were used and that led to duplicates of the publications selected. The duplicates were excluded and then the publications were selected based on the availability of their full-text edition. Some publications provided only an abstract instead of full-text and therefore, had to be excluded. Another criterion for exclusion was whether the article was published in a journal or not journals. Lastly, many publications did not include any Deep Learning method for crop yield prediction, although mentioned in the title or abstract. As such, these publications were excluded. After applying the exclusion criteria, 44 publication results remained to be assessed for eligibility ().
Quality assessment
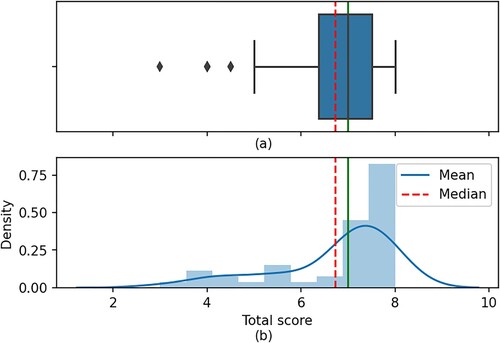
The exclusion criteria were followed by a quality assessment which resulted in 44 publication results for further qualitative data synthesis and meta-data analysis (), by applying the criteria shown in Appendix 1. The criteria we used were defined so that the studies would be assessed based on their clarity, aim, scope and context. In addition to this, the validity and reliability of the variables and proposed solutions in the studies were considered. Lastly, the quality assessment included criteria regarding the research process documentation, the answers to the defined study questions, and the presentation of the main and negative findings. These criteria are adapted by criteria given by Kitchenham and Charters (Citation2007) and other similar systematic reviews. They were also chosen to minimise bias and to maximise both the internal and external validity of the study.’ To provide high-quality data through the next steps, a threshold of a minimum score equal to 4 was set. Therefore, studies with less than 4 points were excluded. The distribution of the quality scores for the selected studies is presented in . It can be seen that the mean value was a score of 7 points, while the median with 6.69 points. Moreover, based on the boxplot the Q1 indicates that 25% of the scores are less than 4.85 points and 75% are greater, while Q2 (the median) shows that 50% of the scores are less than 6.69 points. Lastly, the Q3 presents that 25% of the scores are greater and 75% are less than 7.35 points. The points were given to each of the eight criteria based on the following scale: ‘Yes’ = 1 point, ‘Partially’ = 0.5 points, ‘No’ = 0 points. For instance, 1 point was given for C3 if the proposed solution was clearly explained and validated by an empirical study, mentioned in the expected place (i.e. Methodology and Results). If the proposed solution was vague and validation was not completed approached by an empirical study, then 0.5 points were given. In case the proposed solution was not clearly stated and was not validated by an empirical study, then no points were given.
Figure 2. Quality score distribution of the selected studies. (a): Box plot with quantiles, median, and mean values. (b): Histogram with density, median, and mean values.
Data extraction
The data extraction was conducted with the help of our data extraction excel sheet (Appendix 2). Initially, the citations were used to extract data like Title, Author(s), Document/Journal Title, (Author) Keywords/Descriptors/Index Terms/Subjects, Year, and Publisher. A unique index was given to each paper based on the database retrieved. Afterward, data were extracted with respect to the defined research questions for this study. For higher ease of multiple data use, more excel sheets were made with respect to each data extraction category. When data was recorded as raw from the primary study and the cell of the column with this specific data and raw regarding this study, was filled with a ‘1’.
Data synthesis and reporting
Since we managed to extract data from the selected papers, information regarding meta-data and research questions was derived. Examining the data extraction, there was information overlapping each other and thus, an attempt was made to synthesise synonyms, merge or group them. By this, it was possible to discover trends and variance in the data. In specific, for ‘RQ3: What data features were used for the crop yield estimation with deep learning algorithms?’ features were grouped regarding their relevance (eg. Weather conditions, Vegetation Indices, Satellite and Aerial data). Furthermore, regarding ‘RQ10: What were the challenges and possible solutions?’ it was observed that some challenges had several proposed solutions. However, a bunch of solutions was proposed for various challenges. For this reason, similar challenges were merged using synonyms and proposed solutions for a single challenge were merged in one cell of the excel sheet for data extraction. The data synthesis and reporting were conducted in the Anaconda environment (Oliphant Citation2012) using the Jupyter Notebook framework (Perez Citation2014) with Python (Rossoum Citation1989). The libraries used to synthesise data frames and figures were Pandas, Collections, Matplotlib, Numpy, Seaborn, Itertools, and JSON.
Results
In this section, general statistics from the included primary studies are discussed and results corresponding to the research questions are presented in the following sections. The 44 primary studies included in this SLR are listed in Appendix 3.
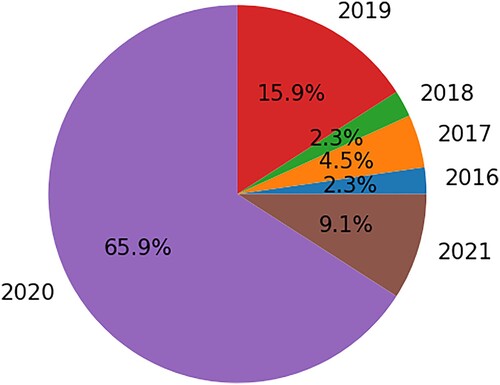
It was observed through this SLR that most of the primary studies were published in 2020 (). The year-wise occurrence of the primary studies indicates the significance of Deep Learning methods in crop yield prediction through the last five years. Especially, they presented an almost 30-fold increase since 2016.
Figure 3. The year-wise distribution of papers.
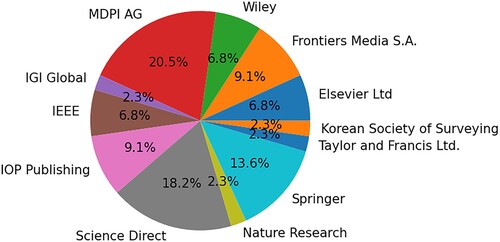
The occurrence of each publisher () revealed that the majority of primary studies were published by ‘MDPI AG’ (8 primary studies). Both ‘Science Direct’ and ‘Springer’ followed with a value of 8 and 6 studies, respectively. Publishers such as ‘Korean Society of Surveying’, ‘Taylor and Francis Ltd.’, ‘IGI Global’ and ‘Nature Research’ ranked with the least publications.
Figure 4. The distribution of papers per publisher.
Each primary study used a number of keywords. Those keywords were imported in the data extraction form and were separated. Measuring the top-5 values per keyword occurrence () indicated that ‘Deep learning’ was the most common keyword, followed by ‘Machine learning’ and ‘Yield prediction’. Also, keywords like ‘Yield estimation’, ‘Crop yield prediction’, ‘Crop yield’, ‘Yield’ and ‘Neural network’ ranked lower than expected.
Table 2. Top-5 values of keywords occurrence.
RQ-1: what was the key motivation for applying deep learning for crop yield prediction?
The first research question is on the key motivation for applying a Deep Learning technique for crop yield estimation. We retrieved 10 key motivations, as Deep Learning has lots of advantages making it an ideal method for crop yield prediction. However, the motivation behind this option might differ regarding each primary study’s needs and challenges. In , the top-5 values of key motivations are displayed, indicating that the main reason for applying Deep Learning is ‘To process multiple arrays format in non-linear modules’. The distribution of primary studies per key motivation is shown in .
Figure 5. The distribution of papers per key motivation.
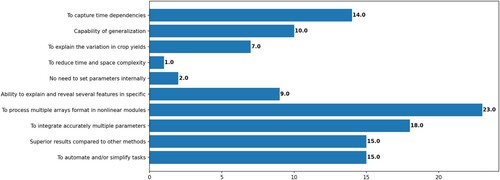
Table 3. Top-5 values of occurrence for key motivation.
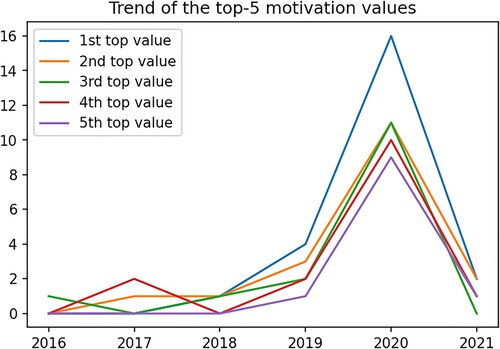
It can be observed that since 2016, processing multiple arrays formats in nonlinear modules showed a high trending increase compared to the next top two key motivations for applying the Deep Learning method in crop yield prediction (). Specifically, in 2020 a 3-fold increase took place.
Figure 6. The trend of the top-3 values for the key motivation behind applying deep learning.
RQ-2: what crops were used for yield estimation?
During data extraction, we realised Deep Learning has been applied in various crops, but mainly maize, as indicated in . The maize is the leading crop with a slight difference from the following crops of wheat, soybean, rice and apple orchards. In total 22 crops were retrieved. The distribution of crops used for crop yield prediction with Deep Learning techniques is presented in showing that the application is broad but not evenly distributed.
Figure 7. The distribution of papers per crop.
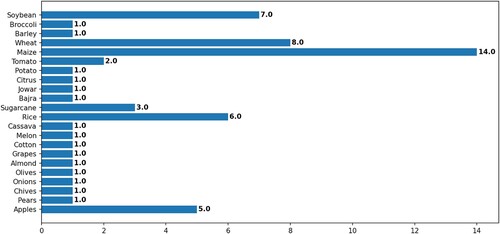
Table 4. Top-5 values of occurrence for crops.
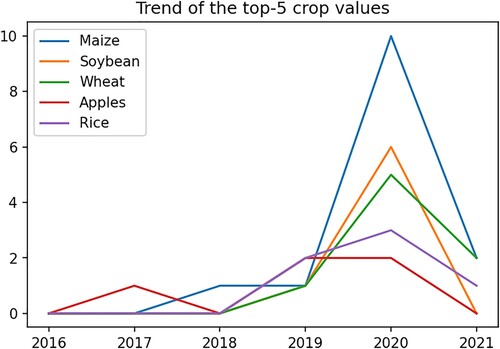
It is obvious that there is a trend of employing the Deep Learning method for crop yield estimation in more crops (). Especially in 2019, crops such as maize, soybean, wheat, and rice started being investigated on this topic. Maize still remains the leading crop on this field.
Figure 8. The trend of the top-5 crop values for applying deep learning in crop yield estimation.
RQ-3: what data features were used for the crop yield estimation?
Features of the models varied a lot and were used in different combinations through the primary studies (Appendix 4). As it is viewed in , images with a value of 27 papers, followed by precipitation with 25 papers, were by far the leading data features used for crop yield prediction methods in more than half of the papers reviewed in this study. The total results showed 114 features.
Table 5. Top-5 values of occurrence for data features.
Due to the enormous amount of data features used, we made 9 groups including data features relevant to each other per group. For instance, all data features regarding vegetation indices were gathered in one group, while all data features related to water were added to a group with water conditions. Their distribution is shown in , while in the data features related to yield, water, and weather conditions were the leading group used in primary studies.
Figure 9. The distribution of papers per group of data features.
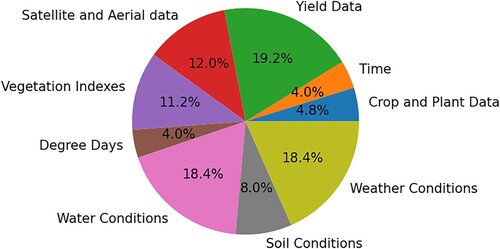
Table 6. Values of occurrence for data features groups.
RQ-4: what data sources were used?
All the aforementioned data features are derived from multiple data sources (Appendix 5). The leading dataset came by far from images, while 6.25% of the primary studies did not mention whether their datasets were publicly available or not (). In some primary studies, multiple datasets were used coming from different sources, which made their distribution uneven. 56 data sources were noted in total.
Table 7. Values of occurrence for datasets.
RQ-5: what deep learning implementation frameworks were used?
As every method is implemented in a framework, the same applies to Deep Learning methods, as stated in . Although most of the primary studies did not mention if they used any implementation framework (i.e 33.33%), 56.86% of them used TensorFlow and/or Keras. All the implementation frameworks (6 in total) are distributed as shown in .
Figure 10. The distribution of papers per implementation framework.
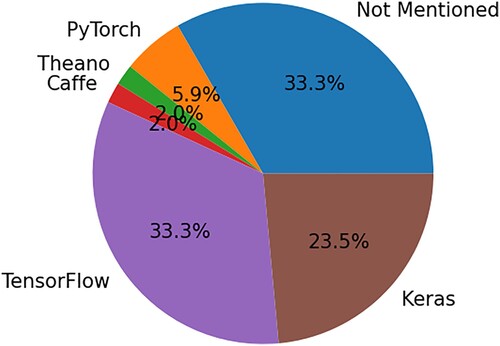
Table 8. Values of occurrence for all implementation frameworks.
RQ-6: what category of deep learning was applied?
Deep Learning methods are divided into 4 categories, namely ‘Supervised’, ‘Semi-supervised’, ‘Unsupervised’ and ‘Reinforcement learning’ (). The category that was mostly used in primary studies of this SLR was the ‘Supervised’ category, while the least used was by far the ‘Reinforcement learning’. Their distribution through the primary studies is presented in .
Figure 11. The distribution of papers per category.
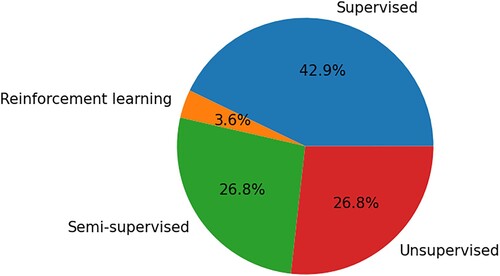
Table 9. Values of occurrence for all categories.
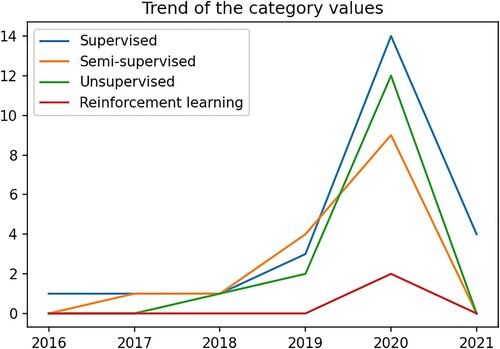
It is obvious that since 2019 there is a remarkable trend in the categories of supervised and unsupervised learning (). Also, reinforcement learning made its appearance for crop yield prediction in 2020.
Figure 12. The trend of the category values in estimating crop yield with deep learning.
RQ-7: what deep learning algorithms were applied?
Deep Learning techniques provide highly accurate results in many different problems. This can be done by either using a Deep Learning algorithm separately as originally defined or by making adjustments or even by combining several algorithms together, as shown in . However, in is obvious that Deep Learning algorithms haven’t been used that much in combinations together, with CNN being the leading method, followed by Long-Short Term Memory network (LSTM). In total, 39 algorithms were noted.
Figure 13. The distribution of papers per algorithm.
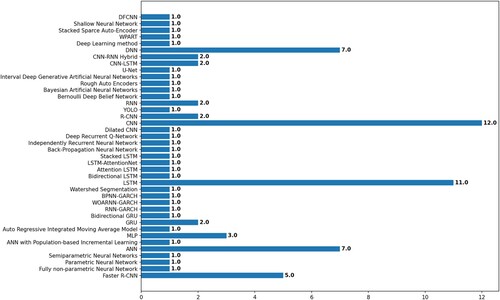
Table 10. Top-5 values of occurrence for algorithms.
RQ-8: which algorithm performed better for crop yield prediction?
When selecting a Deep Learning algorithm, most of the time one or more algorithms or even the same algorithm with adjustments are selected to perform the same task. By this, the performance of the algorithms is compared and the best algorithm is derived. Although in this SLR some primary studies only mentioned their approach as the best performance for the crop yield prediction, the algorithm with the best performance was the CNN (). However, 23 algorithms in total showed the best performance. The studies that used image processing for object counting or extracting features from images to forecast the crop yield mainly applied the following algorithms: Faster R-CNN, CNN, DNN, and LSTM. Most of these studies applied either a CNN or LSTM model to perform the regression task of crop yield prediction. As for the publications that used tabular data, they mainly applied a CNN, DNN, LSTM, RNN, or a hybrid model combining these algorithms. The distribution of the algorithms with the best performance can be viewed in .
Figure 14. The distribution of papers per algorithm’s performance.
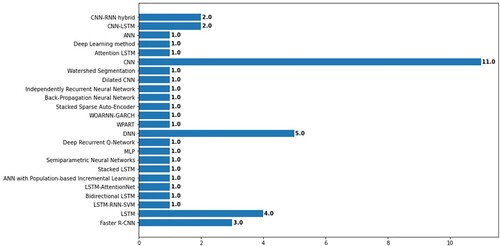
Table 11. Values of occurrence for algorithms’ performance.
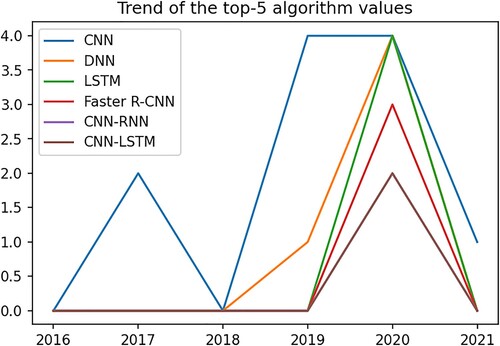
The trend of the best-performing algorithms indicated that CNN outperforms other algorithms since 2017, with a high peak in 2019 (). However, in 2020 LSTM and DNN showed a high increase in their performance for crop yield prediction.
Figure 15. The trend of the top-3 values of best performing algorithm crop yield estimation.
RQ-9: what kind of evaluation approaches were used for the models?
The performance of Deep Learning algorithms is evaluated using different approaches. Amongst others, the evaluation metrics used in the primary studies in this SLR are shown in . The evaluation approach that was used the most was the RMSE (). Most of the time more than one evaluation approach were used in the primary studies. The total evaluation approaches considered in this SLR were 29.
Figure 16. The distribution of papers per evaluation approach.
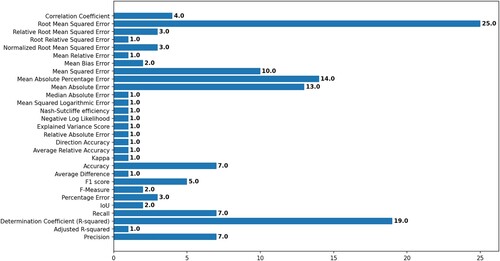
Table 12. Values of occurrence for evaluation approaches.
RQ-10: what were the challenges and proposed solutions?
Challenges and possible solutions were derived from data during data extraction of the primary studies (Appendix 6). In the most occurred challenges are presented, including their possible solutions. It seemed that the ‘Limitation of the large training dataset to avoid overfitting and achieve higher model performance’ was the biggest challenge. The primary studies faced this challenge by employing ‘Data augmentation with random cropping, rotation, fancy principal analysis, changing colour channels, adding filters, random increase in scale, random rotations, vertical and horizontal inversion (mirroring), and colour distortion’. Alternatively, by ‘Employing Transfer Learning between similar tasks’, or by ‘Collecting and recording data digitally’. In total, 158 challenges and their proposed solutions were recognised in this SLR.
Table 13. Values of occurrence for challenges and proposed solutions reported in primary studies.
Discussion
In this section, we present the discussion related to each research question (Section 6.1), and also, we present the potential threats to validity (Section 6.2).
General discussion
It became undoubtedly obvious that the application of Deep Learning in the field of agriculture, especially for crop yield prediction, has been rapidly expanded since 2019, showing a four-fold increase (). This was combined with the prioritisation of the 2030 Agenda for Sustainable Development of the United Nations in respect to a fight against hunger and to an improvement in food security (Desa Citation2016). Following the aforementioned prioritisation, ‘MDPI AG’ was the leading publisher of the primary studies used (). A possible reason for this would be the fact that open access is provided in Remote Sensing journals. According to Fountas et al. (Citation2020); Zheng et al. (Citation2019), the availability of representative data for close-view and real-time prediction tasks is becoming less and less vague. Remote sensing data were used as an alternative, as indicated from (), representing one of the leading keywords of the primary studies regarding data used. However, the keyword ‘Deep learning’ was mostly occurred in the primary studies, followed by ‘Yield prediction’, ‘Machine learning’, ‘Yield estimation’, ‘Agriculture’ and ‘Crop yield prediction’. Those keywords () proved to be some of the keywords expected for this SLR. The remaining discussion in respect to each research question is presented as follows:
RQ1-related: As it becomes more and more clear that as there is a requirement for more data, the complexity of the features increases as well, making linear processing more difficult. Neural networks of Deep Learning are ideal for handling huge amounts and complex data in a non-linear way. That’s the reason why the key motivation for applying Deep Learning was ‘To process multiple arrays format in non-linear modules’ (). Moreover, the other following key motivations had almost the same occurrence as the leading one (), representing a big part of the total occurrences and indicating the undoubtedly big advantages of Deep Learning methods. It seems that all those key motivations correspond to future technological and labour trends of using more complex data, while reducing labour expenses, respectively (Hani et al. Citation2020).
RQ2-related: According to (Food and Agriculture Organization of the United Nations Citation2019), wheat and maize are the most cultivated crops (ha units) in the world, while the highest product quantity comes from sugar cane. However, there are many more crops that Deep Learning techniques could be applied to, such as grapes, almonds, fruits, and many other crops being ranked lower in lists of production or cultivation, but higher-ranked in nutritional and financial values.
RQ3-related: Multiple features were used as inputs in Deep Learning algorithms, boosting the non-linear approach for crop yield prediction. Images and precipitation played a key role as features because the former includes precious information that can be recognised by a Deep Learning algorithm (eg. Ground-truth, phenological, spatial, and temporal data). The latter is recognised as one of the key parameters for the high quality and quantity of the crop (Lobell et al. Citation2007). Moreover, other climatic, soil, yield, and vegetation data were used, but not at the same level. Hence, groups of relevant categories of data were made to get a better insight into which kind of features are used in Deep Learning algorithms for crop yield prediction (). As indicated by Jiang et al. (Citation2020); Khaki and Wang (Citation2019); Khaki et al. (Citation2020); Maimaitijiang et al. (Citation2020), features related to water and weather conditions were mostly used along with yield data. Through this SLR it was observed that most of the time yield data were used as ground truth for the prediction of regression tasks (Apolo-Apolo, Martínez-Guanter, et al. Citation2020). Satellite and aerial data were also used as ground-truth, especially when yield maps were created in classification tasks (Apolo-Apolo, Pérez-Ruiz, et al. Citation2020; Hani et al. Citation2020).
RQ4-related: It was previously mentioned that images were the most used data features. This fact stands on Deep Learning methods’ ability to extract important features from images, such as CNNs. Except for being used as raw inputs in algorithms for crop yield forecasting, images may also represent a source from which other features are derived, such as vegetation indices, and soil conditions. Furthermore, not all publications provided or mentioned their datasets and/or data sources publicly available. Digital sources, like ImageNet, and sources originating from the United States of America (USA), such as USDA-NASS, were used. Last but not least, some primary studies were manually built or provided datasets available upon request, making the research process even more difficult.
RQ5-related: Each implementation framework has its own advantages and as a result, the decision should be based on the needs of the study. This is also shown in () wherein TensorFlow and Keras were the most used implementation framework, being employed either individually or combines. On the other hand, almost half of the primary studies did not provide any information about their implementation framework. A possible reason might be the fact that not all implementation frameworks are known or helpful, and using only a certain implementation framework is taken for granted.
RQ6-related: As previously mentioned, ground-truth data were used for predictions, indicating that most Deep Learning techniques applied in the primary studies belong to the ‘Supervised’ category using predictions based on historical data. However, more than half of the primary studies let the algorithms explore and learn themselves to predict future crop yield, while two cases belonged to the ‘Reinforcement learning’ category.
Based on the the definition given by Sutton and Barto (Citation1998) for Reinforcement learning, it might be much more difficult to use such a category of Deep Learning. That’s because there are many spatial and temporal data changing dynamically and constantly values and so, it would be impossible to provide high accuracy.
RQ7-related: Many different Deep Learning algorithms were applied in the primary studies, as indicated in (), possibly because there were various kinds of features requiring exploration and more alternative efficient handling techniques. However, on the basis of mostly spatial and time-series data, ANN, CNN, DNN, RNN, LSTM, MLP, R-CNN, and Faster R-CNN were used either individually or in different combinations. Some of those networks were used as they are originally built, while others were adjusted to meet several studies ‘ requirements. For example, might ANN, DNN, and MLP represent simpler forms of Deep Learning networks, but they still perform better than other Machine Learning techniques (Kim and Lee Citation2016). The rest networks are capable of building even more complex networks and handling high-level data.
RQ8-related: As expected through RQ7, the Deep Learning methods outperformed other Machine Learning methods. Moreover, as CNN are capable of learning features without any feature design prior, and spatial data were the features mostly used, CNNs were the most common Deep Learning algorithm with the best performance. However, when time-series data were used, the LSTM networks showed the best performance because their architecture consists of memory cells, and thus, is much easier to deal with such data. In primary studies related to fruit counting, algorithms appropriate for segmentation tasks performed the best, such as Faster R-CNN. Each algorithm serves a different approach for several tasks.
RQ9-related: The evaluation approaches used for the performance of the Deep Learning algorithms were more than one in each primary study, while a big variety was used. Those mentioned in () are mainly used for providing correct accuracy for the model’s outcomes. It is worth to be mentioned that Determination Coefficient (R2) and Correlation Coefficient (R) was used as an evaluation approach for relating the regression task of yield prediction to classification tasks, such as fruit counting.
RQ10-related: The ‘Limitation of the large training dataset to avoid overfitting and achieve higher model performance’ as the leading challenge of the primary studies comes to support the problem of fewer data available in public. Despite this big challenge, there are several solutions to allocate this challenge with data augmentation, Transfer Learning, or collecting and recording data digitally. At this point, it should be mentioned that some solutions, such as Transfer Learning, increasing training data, using LSTM or CNN were employed for several challenges. Although most primary studies clearly described their challenges and proposed a solution, there were three cases where no challenges were clearly mentioned and/or no possible solutions were provided.
In addition to RQ-10, one of the biggest challenges for the application of Deep Learning is its black box property. A possible solution for this limitation would be the identification of research opportunities in Explainable Artificial Intelligence (XAI), focusing on the visualisation perspectives in the context of crop yield prediction with the use of Deep Learning. This could be achieved by describing a broader research community with cross-disciplinary collaboration, including Computer Science and Machine Learning, with a particular focus on visualisation and visual analytics for XAI. The area of XAI is rapidly growing and should be followed by visualisation researchers and practitioners for the application of Deep Learning in crop yield prediction to overcome the challenge of black-box property and provide transparency and reliability to the applicant.
Potential threats to validity
Although we tried to provide high quality in this SLR, several validity considerations should be taken into account. There was an overlap between primary studies’ occurrence per database. Hence, it played a significant role in what database was used first. Also, the search string used in the search strategy was very inclusive in terms of this SLR’s topic. However, synonyms of some words made it impossible to include more publications with these synonyms. A typical example is the word ‘forecasting’ for the words ‘prediction’ and ‘estimation’ that we used. In this study, we did not differentiate by crop, meaning that biomass crop yield prediction and fruit crop yield prediction have been considered similarly because the current literature focuses on understanding the cumulative effects of several factors such as pests, diseases, and water deficiencies for all types of crops similarly. Apart from that, we mentioned the specific date (i.e. 16/10/2020) that the results from databases were obtained so that we keep validity amongst this study. Possibly, more journals might have been published, as this study was conducted a few months before its publication. For this reason, four more primary studies were added on 28/12/2021 to keep track of some of the latest progress in this topic. However, it should be kept in mind that due to the small number of papers added in 2021, the trends in trend figures (, , , ) show a decrease, which might not represent the reality. Furthermore, the selection and assessment of the primary studies were based on certain criteria, the final results remained objective-leveled though. The same applies to data extraction and grouping data after data extraction so that they could be handled much easier. At this point, it is worth mentioning that there were primary studies in which data were not mentioned at all, or might have been missed or were misinterpreted. That stands on the fact that the data extraction is objective too. For example, there might be ‘crop yield prediction’ in the Title and Abstract of the publication, fulfilling the selection criteria, but in the Text of the specific publication were not mentioned as a regression task but only as a classification task instead. Another example could be the fact that algorithms or evaluation approaches were not properly defined by their names. Furthermore, in most of the studies, the scale of work was on a region rather than a block or greenhouse compartment. The reason for that difference could potentially be the challenge of data publicly available. That means, more data are available from governments or organisations for whole regions. In order to acquire data for specific land parts, greenhouses, or farms, then individual measurements need to be taken, which require human labour and resources. Another potential threat to the validity of our work would be that the majority of the works used only one dataset and split it into training and validation set for their work. That should be taken into consideration for the validity of real-world performance. Last but not least, there were a few cases where challenges were not clearly stated. It was up to us to consider them as challenges or not. The same applied to proposed solutions for those challenges.
Conclusion and future work
In our study, a variety of parameters was presented to play a role in the application of Deep Learning in crop yield prediction. Based on the selected studies, the motivation behind using Deep Learning may be similar, but there is a multitude of challenges with many possible solutions. Processing multiple arrays format in nonlinear modules alone is not sufficient to avoid overfitting and achieve higher model performance. Data augmentation and transfer learning overcome the limitation of large training datasets. Therefore, it’s no longer vague that crop yield prediction with Deep Learning methods depends on the kind of data used, as much as on the type of crop. Most publications worked with images of maize to use features related to water condition data, making images the most demanded source of data. However, when it comes to the implementation of Deep Learning methods, TensorFlow is used, although the framework is almost never mentioned. Various algorithms and Deep Learning methods were used in different studies. Based on our results, the majority of the publications worked with supervised learning. This result came with the wide usage of CNN for crop yield prediction, outperforming other Deep Learning algorithms such as DNN, LSTM, Faster R-CNN, or hybrid models. The RMSE was the most employed evaluation performance metric in the selected studies, followed by R2, MAPE, MAE, and MSE.
It is undoubtedly obvious that each case is unique for crop yield prediction when applying Deep Learning. Especially when considering the challenges with the possible solutions per case study. Future research could aim in overcoming data limitations and explaining the results of Deep Learning so that it won’t be a ‘black box’. Availability of the data is crucial for training the models so that higher performance can be reached. As for the ‘black box’ property of Deep Learning, it’s important to ‘dig’ deep and realise how the model came up with specific results. Another future research with a high impact on this topic would be to improve the process of tuning hyperparameters and labelling. Processes that always take place in all case studies, requiring a lot of time and labour costs. We are dedicated that our study will set the blueprint for further research on developing the application of Deep Learning for crop yield prediction.
In our future work, we aim to build on the outcomes of this SLR study. Specifically, our focus is on developing a novel Deep Learning-based crop yield prediction algorithm, while XAI should be taken into consideration for ‘pulling’ Deep Learning out of its black-box property. This is a fast-moving field, therefore, we believe that this article will be a continual review and updated once new articles are published in this field.
Supplemental material - Appendices
Download MS Word (59.1 KB)Acknowledgements
Open Access funding provided by the Qatar National Library.
Disclosure statement
No potential conflict of interest was reported by the author(s).
References
- Apolo-Apolo OE, Martínez-Guanter J, Egea G, Raja P, Pérez-Ruiz M. 2020. Deep learning techniques for estimation of the yield and size of citrus fruits using a UAV. European Journal of Agronomy. 115. doi:10.1016/j.eja.2020.126030.
- Apolo-Apolo OE, Pérez-Ruiz M, Martínez-Guanter J, Valente J. 2020. A cloud-based environment for generating yield estimation maps from apple orchards using UAV imagery and a deep learning technique. Frontiers in Plant Science. 11. doi:10.3389/fpls.2020.01086.
- Chlingaryan A, Sukkarieh S, Whelan B. 2018. Machine learning approaches for crop yield prediction and nitrogen status estimation in precision agriculture: A review. Computers and Electronics in Agriculture. 151:61–69. doi:10.1016/j.compag.2018.05.012.
- Desa U. 2016. Transforming our world: the 2030 agenda for sustainable development. doi:10.1891/9780826190123.ap02.
- Dharani M, Thamilselvan R, Natesan P, Kalaivaani P, Santhoshkumar S. 2021. Review on crop prediction using deep learning techniques. Paper presented at the Journal of Physics: Conference Series.
- Filippi P, Jones EJ, Wimalathunge NS, Somarathna PDSN, Pozza LE, Ugbaje SU, Jephcott TG, Paterson SE, Whelan BM, Bishop TFA. 2019. An approach to forecast grain crop yield using multi-layered, multi-farm data sets and machine learning. Precision Agriculture. 20(5):1015–1029. doi:10.1007/s11119-018-09628-4.
- Food and Agriculture Organization of the United Nations 2019. Crops. FAO FAOSTAT; [Accessed 2020 Dec]. http://www.fao.org/faostat/en/#data/QC.
- Fountas S, Mylonas N, Malounas I, Rodias E, Hellmann Santos C, Pekkeriet E. 2020. Agricultural robotics for field operations. Sensors. 20(9):2672. doi:10.3390/s20092672.
- Hani N, Roy P, Isler V. 2020. A comparative study of fruit detection and counting methods for yield mapping in apple orchards. Journal of Field Robotics. 37(2):263–282. doi:10.1002/rob.21902.
- Jiang H, Hu H, Zhong R, Xu J, Xu J, Huang J, Wang S, Ying Y, Lin T. 2020. A deep learning approach to conflating heterogeneous geospatial data for corn yield estimation: a case study of the US corn belt at the county level. Global Change Biology. 26(3):1754–1766. http://search.ebscohost.com/login.aspx?direct=true&db=lah&AN=20203137107&site=ehost-live.
- Khaki S, Wang L. 2019. Crop yield prediction using deep neural networks. Frontiers in Plant Science. 10. doi:10.3389/fpls.2019.00621.
- Khaki S, Wang L, Archontoulis SV. 2020. A CNN-RNN framework for crop yield prediction. Frontiers in Plant Science. 11. https://www.frontiersin.org/articles/10.3389/fpls.2019.01750/full.
- Kim N, Lee YW. 2016. Machine learning approaches to corn yield estimation using satellite images and climate data: a case of Iowa State. Journal of the Korean Society of Surveying, Geodesy, Photogrammetry and Cartography. 34(4):383–390. doi:10.7848/ksgpc.2016.34.4.383.
- Kitchenham B, Charters S. 2007. Guidelines for performing systematic literature reviews in software engineering.
- Koirala A, Walsh KB, Wang Z, McCarthy C. 2019. Deep learning–method overview and review of use for fruit detection and yield estimation. Computers and Electronics in Agriculture. 162:219–234.
- Lee S, Jeong Y, Son S, Lee B. 2019. A self-predictable crop yield platform (SCYP) based on crop diseases using deep learning. Sustainability. 11(13):3637.
- Lobell DB, Cahill KN, Field CB. 2007. Historical effects of temperature and precipitation on California crop yields. Climatic Change. 81(2):187–203. doi:10.1007/s10584-006-9141-3.
- Maimaitijiang M, Sagan V, Sidike P, Hartling S, Esposito F, Fritschi FB. 2020. Soybean yield prediction from UAV using multimodal data fusion and deep learning. Remote Sensing of Environment. 237:111599. doi:https://doi.org/10.1016/j.rse.2019.111599.
- Oliphant PWT. 2012. Anaconda (Version 4.9.2): Anaconda Inc. https://www.anaconda.com/.
- Perez F. 2014. Jupyter Notebook (Version 6.1.5): Project Jupyter. https://jupyter.org/index.html.
- Rossoum Gv. 1989. Python Language Reference (Version 3.7.9): Research Center Centrum Wiskunde & Informatica (CWI). https://www.python.org/.
- Sutton RS, Barto AG. 1998. Introduction to reinforcement learning (Vol. 135). Cambridge, MA: MIT Press.
- van Klompenburg T, Kassahun A, Catal C. 2020. Crop yield prediction using machine learning: a systematic literature review. Computers and Electronics in Agriculture. 177:105709. doi:10.1016/j.compag.2020.105709.
- Xu X, Gao P, Zhu X, Guo W, Ding J, Li C, Zhu M, Wu X. 2019. Design of an integrated climatic assessment indicator (ICAI) for wheat production: a case study in Jiangsu Province, China. Ecological Indicators. 101:943–953. doi:10.1016/j.ecolind.2019.01.059.
- Zhang Q, Liu Y, Gong C, Chen Y, Yu H. 2020. Applications of deep learning for dense scenes analysis in agriculture: a review. Sensors. 20(5):1520.
- Zheng YY, Kong JL, Jin XB, Wang XY, Zuo M. 2019. Crop deep: the crop vision dataset for deep-learning-based classification and detection in precision agriculture. Sensors (Basel). 19(5). doi:10.3390/s19051058.