
ABSTRACT
Strawberry (Fragaria x ananassa) is a popular fruit consumed for its desirable flavour, aroma and colour and is considered a functional food due to its antioxidant properties. Noting the need for farmers to increase productivity to meet increasing consumer demands, this study aimed to explore the potential of biostimulants to enhance strawberry cultivation. Herein, a field trial was conducted on a commercial strawberry farm, wherein 1944 strawberry plants received fertigation supplementation with either a control solution (nutrients only) or nutrients combined with one of two biostimulant complexes (BCs). Biostimulant complex 1 (BC1) was composed of molasses, Aloe vera extract and fish-hydrolysate, and biostimulant complex 2 (BC2) was composed of potassium silicate and potassium phosphite. Results indicated that BC1 maintained total yields but increased the sellable proportion and decreased the proportion of waste. In contrast, BC2 increased total yields with both sellable yields and waste increased. No significant changes were observed for indicators of consumer preference (flavour, aroma and fruit colour), however, on-average large increases were observed to indicators of fruit antioxidant properties (phenolic and flavonoid content). Accordingly, these results support the utilisation of biostimulants as a strategy to improve strawberry on-farm productivity without compromising consumer quality measures.
Introduction
Strawberries are a highly valued functional food, beloved by consumers for their vibrant colour, sweet taste and health-promoting properties (Miller et al. Citation2019). Consumer interest in strawberries has consistently grown year-to-year (FAOSTAT Citation2023), leading to pressures to increase crop cultivation area and crop productivity of strawberry farms. A concurrent challenge for strawberry farmers is the increasing volume of food production being relegated to waste (Canali et al. Citation2016), wherein one third of food produced is lost or wasted (Makhal et al. Citation2021). Accordingly, there is a desire by strawberry farmers for strategies to increase yield and reduce grading loss to increase crop productivity and the proportion of yields that reach the endpoint customer.
One such strategy is the implementation of biostimulants during fertigation of crops, which are non-nutritive products that enhance the quality or quantity of yields and are often used alongside synthetic fertilisers and pesticides (Noroozlo et al. Citation2019; Souri and Hatamian Citation2019; Ebrahimi et al. Citation2021). Recently, a complex of molasses, Aloe vera extract and fish-hydrolysate (herein referred to as ‘biostimulant complex 1’, BC1) was shown to enhance the yield of strawberry (Wise, Selby-Pham, Simovich et al. Citation2024) and tomato (Wise and Selby-Pham Citation2024) under controlled conditions. Additionally, a component of BC1, molasses, has been observed to induce plant endogenous stress and defence responses in cannabis (Wise, Williams et al. Citation2024), indicating a potential contribution to the mode of effect of BC1. Similarly, application of silicate and phosphite to hemp was shown to increase yield under controlled conditions (Wise, Simovich et al. Citation2024), and both silicate and phosphite biostimulant benefits are associated with induction of endogenous plant stress responses resulting in increased antioxidant production (Gómez-Merino and Trejo-Téllez Citation2015; Savvas and Ntatsi Citation2015). However, the benefits of these biostimulant complexes have not been demonstrated under field conditions, which would be representative of associated commercial benefits from utilisation. Accordingly, the work herein explored the impact of these two biostimulant complexes to strawberry quantity and quality when applied within the context of a field trial.
Materials and methods
Biostimulant solution
Two biostimulant aqueous solutions were utilised herein: BC1, composed of molasses (10% w/v), Aloe vera extract (2.5% v/v) and fish-hydrolysate (5% v/v), and biostimulant complex 2 (BC2), composed of potassium silicate and monopotassium phosphite, which achieved 7.4% w/v Si, 8.1% w/v phosphite (Phi) and 17.3% w/v K. Both BC1 and BC2 were generously provided by Nutrifield Pty Ltd.
Strawberry growth and sample collection
Strawberry plants (Fragaria x ananassa ‘Albion’) were grown at Sunny Ridge Strawberry Farm Pty Ltd. (Boneo, VIC, Australia) during the December 2019 to January 2020 growing season in Boneo, Victoria, Australia. The farm set up consisted of metal gutters (‘lines’ of plants) holding the strawberry plants, which were grown in 10 L coir slabs (Besgrow, Hokitika, NZ). The lines of plants were grown under polytunnel shade and provided with standard fertigation via dripper (170 L/hr) that drained to waste and received otherwise the farm-standard cultivation conditions and practises.
For this experiment, three neighbouring lines of plants were utilised. All farm fertigation and cultivation practises continued uninterrupted, however, beginning at the start of December, the three lines of plants received an additional fertigation treatment, once weekly with either control, BC1 or BC2 solutions. The additional fertigation was provided through the main feed line and drippers, by manually connecting reservoirs containing the solutions and pumping (5 min × 18.5 L/min pump) the fertigation solutions from their respective reservoirs.
The line receiving the control treatment consisted of 600 plants (n = 600), and the solution consisted of 3 mL/L of Coco A&B nutrients (Nutrifield Pty Ltd., Melbourne VIC), with the pH corrected to 5.8 using pH Up (Nutrifield Pty Ltd., Melbourne VIC) and pH Down (Nutrifield Pty Ltd., Melbourne VIC). The line receiving BC1 treatment consisted of 600 plants (n = 600), and the solution consisted of 3 mL/L of Coco A&B nutrients and 2 mL/L of BC1, with the pH corrected to 5.8 using pH Up and pH Down. The line receiving BC2 treatment consisted of 744 plants (n = 744), and the solution consisted of 3 mL/L of Coco A&B nutrients and 0.2 mL/L of BC2, with the pH corrected to 5.8 using pH Up and pH Down.
Following 1 month of treatment (four fertigation solution applications), the harvested fruits were collected and measured. Ripe fruits were collected by farm staff every 3 days throughout the growth period as per standard practise, wherein ‘ripe fruit’ were defined by complete red colour at development stage BBCH 87 (Wise et al. Citation2022). However, following the treatments over a span of 17 days, six harvests were performed, wherein the harvested fruits from the three experimental lines were kept separate for subsequent measuring.
Yield data collection
Initially, harvested fruit per plant were counted and separated into ‘waste’ (W) and ‘Class 1 and 2’ (C1,2), based on Sunny Ridge Strawberry Farm (Citation2019) practises. Categorisation as W was performed by farm staff, based on their standard visual assessment of substantial defects or deformities, or measurement of fruit diameter of less than 28 mm. The total count and total weight of W were measured (per plant). For C1,2, individual fruit weight, length and diameter were measured. Fruit length was measured using digital callipers (Digital Vernier Calliper 150 mm, Kincrome, Scoresby, VIC), and fruit diameter was categorised using a fruit diameter measuring gauge as ‘28 cm’ (28–30 cm), ‘30 cm’ (30–35 cm), ‘35 cm’ (35–40 cm) or ‘40 cm’ (>40 cm). Average yield per plant was calculated as the total count of C1,2 and W per line divided by the plants per line.
Sensory analyses
Fruits harvested on the second-last day of harvesting were utilised for sensory analyses. A blinded test, adapted from Wise, Selby-Pham, Simovich et al. (Citation2024), was conducted to explore if the biostimulant treatments were associated with changes to the sensory perception of fruits. The panellists (n = 24) were farm staff who volunteered to participate in the trial, wherein each panellist completed a questionnaire for 1 fruit (C1,2) per treatment, which scored the fruit (on a 9-point scale) based on their taste, aroma and mouthfeel (Figure S1).
Fruit chemical measures
Class 1 and Class 2 fruits harvested on the final day of measurements were utilised for chemical analyses. This composed of fruit extract pH (1000-fold diluted), Brix, total phenolic content (TPC) measured as gallic acid equivalent (GAE) and flavonoid content measured as quercetin equivalent, using the methods described in Wise, Selby-Pham, Simovich et al. (Citation2024). Based on Sunny Ridge Strawberry Farm (Citation2019) practises, fruit Brix of less than 6 °Bx is considered as ‘nonconforming’, which was the associated acceptability threshold utilised herein.
Fruit image collection, and colour, size and shape analyses
On the final day of harvesting, individual strawberry fruit (C1,2) were photographed and analysed for their colour profiles via an adaptation of the method presented in Wise et al. (Citation2022). The adaptation involved image pre-processing in Microsoft Paint (Microsoft Corporation, Richmond, WA) to remove the background (using the background removal tool), followed by ‘filling’ the background with the colour cyan (r, g, b: 0, 255, 255), which was a colour that was otherwise not present in the fruit images. The image colour was then analysed as previously described, and cyan was then not considered during quantification of colour contributions to strawberry fruit in images. Perceivability of colour changes were explored via transformation of fruit colour to RGB as per Wise et al. (Citation2023), followed by comparison using the online Adobe ‘color contrast checker analyzer’ (https://color.adobe.com/create/color-contrast-analyzer) to quantify the distinguishability of the fruit colours as defined by the ‘WCAG Accessibility Criteria’ (Acosta-Vargas et al. Citation2019; Kumar et al. Citation2021).
Fruit size analyses
Based on Sunny Ridge Strawberry Farm (Citation2019) practises, fruit size was categorised based on the measured diameter, length and weight, according to the specifications in . Fruit were determined to be ‘Class 2’ if they were S or TL for any measure.
Table 1. Specifications for fruit size categorisation.
Fruit shape analyses
As per the class categorisations presented in Oo and Aung (Citation2018) and Htet et al. (Citation2020), fruits were categorised as ‘taper’ shape (i.e. ‘conforming’) for L/D ≥ 1 or ‘nonconforming’ for L/D < 1. The ratio of fruit length and diameter (L/D) was explored as an indicator of fruit shape and fruit shape uniformity as per Jamieson (Citation2016) and Li et al. (Citation2020). Fruits were determined to be ‘Class 2’ if they were nonconforming to the ‘taper’ shape categorisation. Additionally, fruit linear and geometric features were measured (from fruit images) quantitatively as per Feldmann et al. (Citation2020) using the online tool ImageJ (v1.53 m, https://imagej.net/ij/) to quantify the shape descriptors: circularity, aspect ratio, roundness, solidity and Feret aspect ratio.
Data analyses
Statistical analyses of data were performed in the Minitab 21 statistical software package (Minitab Inc., State College, PA). Fruit measures were assessed by general linear model (GLM) followed by Dunnett’s Test (using adjusted P), with the exception of sensory data that was analysed by paired t-test on a per-panellist basis, and fruit categorisation data that was analysed using 2-proportion tests. Similarly, differences in measure variabilities were assessed by equal variance test.
Results
Impact to fruit yield, size and shape
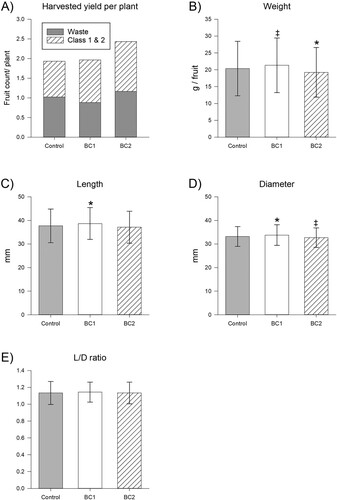
The BC treatments were assessed for their impacts to usable yield (C1,2), waste (W, i.e. non-usable yield) and total (C1,2 + W) yield (A, Table S1). Across the six collection days, control plants on-average yielded a total of 1.93 fruit per plant (1159 fruit from 600 plants), whilst BC1 plants yielded 1.02-fold more with 1.97 fruit per plant (1179 fruit from 600 plants) and BC2 plants yielded 1.26-fold more with 2.43 fruits per plant (1808 fruit from 744 plants) (A). The BC1 treatment resulted in on-average improvements to fruit size, with fruit weight (1.05-fold increased, p = 0.056), length (1.03-fold increased, p = 0.029) and diameter (1.02-fold increased, p = 0.024) all on-average increased (Table S2). In contrast, the BC2 treatment resulted in on-average losses to fruit size, with fruit weight (0.95-fold decreased, p = 0.014), length (0.98-fold decreased, p = 0.193) and diameter (0.99-fold decreased, p = 0.061) all on-average decreased (B-D). The average of the fruit shape indicator (L/D ratio, E) was not significantly impacted by either treatment (BC1 p = 0.322, BC2 p = 1.000). However, variance of L/D (standard deviation, Table S2) was reduced by the BC1 treatment (0.86-fold reduced variation, p < 0.001) but not the BC2 (p = 0.131) treatment, indicating an improvement to fruit shape uniformity.
Figure 1. Impact of biostimulant treatments to fruit yield, size and shape. Impact of biostimulant treatments to A, harvested yield per plant, B, fruit weight, C, fruit length, D, fruit diameter and E, the ratio of fruit length-to-diameter, i.e. the fruit shape indicator. Yield (A) is presented as the total fruit harvested across 6 days per treatment divided by the number of plants per treatment (n = 600 for control and BC1, and n = 744 for BC2), with fruits distinguished between waste (majorly defective) and Class 1 (sellable as fresh produce) or Class 2 (sellable as processed goods). Individual fruit measures (B–E) are presented as the average ± SD from all fruits harvested from that treatment (n = 547 for control, n = 651 for BC1 and n = 943 for BC2), with statistical significance (compared to control) indicated by * for p < 0.05, and marginal significant differences (compared to control) indicated by ‡ for 0.05 ≤ p < 0.1.
Impact to fruit QC conformity and categorisation as ‘Class 1’ or ‘Class 2’
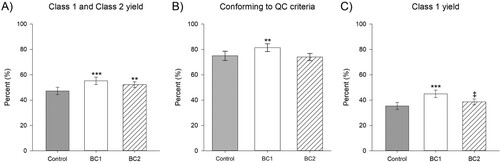
Following fruit visual assessment and grading to meet QC criteria, the proportion of fruit sellable as fresh produce (Class 1; C1) for control plants was 35.4%, while BC1 had significantly increased proportions of C1 fruit of 45.0% (p < 0.001) and BC2 plants had marginally significantly increased proportions of C1 fruit of 38.6% (p = 0.075) (C, Table S3). During harvest 47.2% of control fruit were C1,2, which was significantly less than both the 55.2% C1,2 of BC1 fruit (p < 0.001) and also the 52.2% C1,2 of BC2 fruit (p = 0.008) (A). Regarding conformity to all the QC measures of fruit size (weight, length and diameter) and shape (L/D ratio), control and BC2 fruit conformity rates were not statistically distinct (p = 0.689) at 75.0% and 74.0%, respectively, however, the BC1 treatment fruit had 81.4% conformity, which was 1.09-fold significantly (p = 0.007) increased above control (B). Accordingly, overall the control fruit yields were 52.8% waste, 11.8% Class 2 fruit and 35.4% Class 1 fruit, whilst BC1 yielded 44.8% waste, 10.3% Class 2 fruit and 45.0% Class 1 fruit, and BC2 yielded 47.8% waste, 13.6% Class 2 fruit and 38.6% Class 1 fruit.
Figure 2. Impact of biostimulants to quality control criteria conformity. Impact of the biostimulant treatments to A, proportion of harvested fruit categorised as either Class 1 (sellable as fresh produce) or Class 2 (sellable as processed goods) but not as majorly defective (waste), B, the proportion of Class 1 or Class 2 fruit conforming to size and shape quality control (QC) criteria (i.e. categorised as Class 1) and C, the proportion of harvested fruit categorised as Class 1. Data presented as proportions of counts ± 95% CI with statistical significance (compared to control) indicated by *** for p < 0.001, ** for p < 0.01 and * for p < 0.05 and marginally significant differences (compared to control) indicated by ‡ for 0.05 ≤ p < 0.1.
Impact to fruit composition
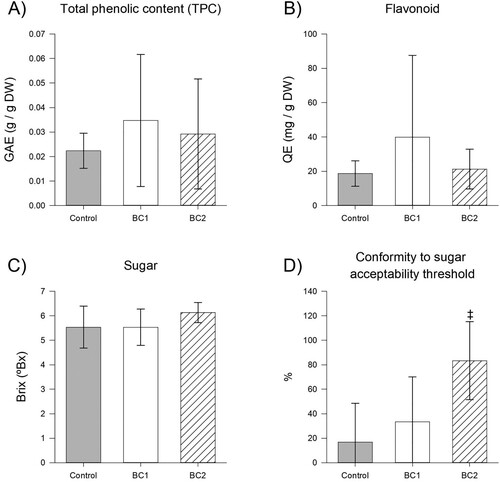
The BC treatments were assessed in terms of their impact to fruit chemical measures (, Table S4). Both biostimulant treatments resulted in large on-average increases to TPC and total flavonoids, with BC1 fruit having on-average 1.55-fold increase in TPC (p = 0.319) (A) and 2.13-fold increase to flavonoids (p = 0.191), and BC2 fruit having on-average 1.31-fold increase to TPC (p = 0.682) and 1.14-fold increase to flavonoid (p = 0.970) (B). Whilst BC1 did not appear to impact Brix (p = 1.000) or pH (p = 0.918), BC2 had a very minimal impact to fruit pH (1.01-fold increase, p = 0.476) and a larger, on-average 1.11-fold increase to Brix (p = 0.263) (C). Fruit Brix was compared to the industry standard acceptability criteria of 6 °Bx (Table S5), which indicated that acceptability for control fruit was relatively low (16.7%, for n = 6). The proportion of fruit meeting this acceptability threshold was not significantly changed by the BC1 treatment with 33.3% (p = 1.000, n = 6) acceptability but was improved with marginal significance (p = 0.080, n = 6) from the BC2 treatment with 83.3% acceptability (D).
Figure 3. Impact of biostimulants to fruit composition. Impact of biostimulants to A, TPC (n = 10), B, flavonoid content (n = 10), C, sugar content (n = 6) and D, conformity to the 6 °Bx sugar content acceptability threshold (n = 6). Data presented as means ± SD, with marginally significant differences indicated by ‡ for 0.05 ≤ p < 0.1.
Impact to fruit colour
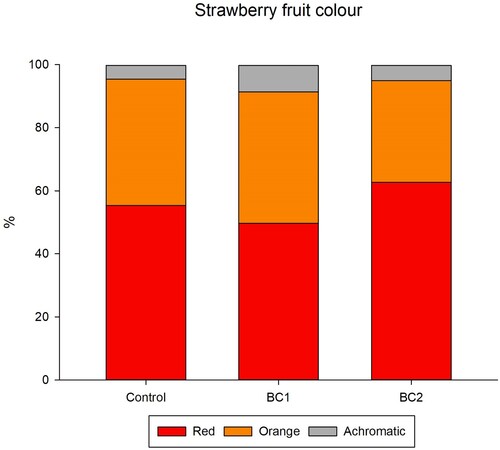
The BC treatments were assessed in terms of their impact to fruit colour (, Table S6). Across all fruits analysed, orange, red and achromatic accounted for 99.7% ± 0.2% of assigned pixels, while blue, green, pink, purple, white and yellow were on-average ≤ 0.1% each. The BC1 treatment fruits had an on-average 0.90-fold reduction in red (p = 0.340), 1.04-fold increase in orange (p = 0.889) and 1.95-fold increase in achromatic (p ≤ 0.001), resulting in images of BC1 fruit having on-average 6% less red, 2% more orange and 4% more achromatic. The BC2 treatment fruits had an on-average 1.13-fold increase in red (p = 0.170), 0.80-fold reduction in orange (p = 0.090) and 1.13-fold increase in achromatic (p = 0.696), resulting in images of BC2 fruit having on-average 7% more red, 8% less orange and 1% more achromatic. The contrast ratios (compared to control) from the BC1 and BC2 colour changes were 1.02:1 and 1.03:1, respectively, which were below the distinguishability threshold of 3:1.
Figure 4. Impact of biostimulants to fruit composition to fruit colour. Impact of biostimulants to fruit colour. Data presented as the average colour profile from 10 fruit per treatment (n = 10). The colours achromatic, orange, and red are presented, which account for 99.7% of the measured fruit colour, of which the remaining 0.3% (not present) is accounted by the colours blue, green, pink, purple, white and yellow.
Impact to sensory profile
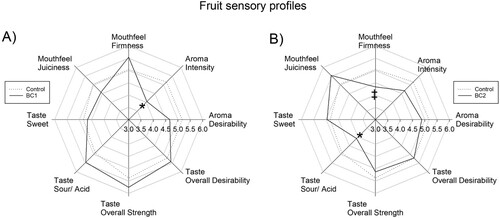
The BC treatments were assessed in terms of their impact to fruit sensory profiles (, Table S5). The BC treatments did not significantly impact desirability of flavour or aroma, which were on-average unchanged from ‘Ok’ (average score of 5) for all fruits. The BC1 (p = 0.009) treatment resulted in a significant reduction of aroma intensity from an average score of 5 (described as ‘moderate’) for control to an average score of 4 for BC1 fruit, while BC2 aroma intensity scores were unchanged as compared to control (p = 0.252). Additionally, whilst both BC1 and BC2 taste intensity scores were not significantly different to control (p = 0.322 and p = 0.552, respectively), the on-average score for BC1 fruits was increased to 6, as compared to control which had an on-average score of 5 (described as ‘moderate’). Furthermore, the BC2 treatment fruits were scored significantly lower (p = 0.020) than control fruits for sour taste, with a score of 4 for BC2 as compared to a score of 5 (described as ‘moderate’) for control. Similarly, the mouthfeel firmness was also reduced from 5 for control to 4 for BC2 fruits, with marginal significance (p = 0.070). In contrast, for BC1 fruits, both sour taste (p = 0.125) and mouthfeel firmness (p = 0.270) were not significantly changed as compared to control fruits.
Figure 5. Impact of biostimulants to fruit sensory profile. Impacts of A, BC1 and B, BC2 to the sensory profiles (mouthfeel, taste and aroma) of strawberry fruit, as compared to control fruit. Data presented as the average scores from 24 panellists (n = 24), with * for p < 0.05, and marginally significant differences indicated by ‡ for 0.05 ≤ p < 0.1, as determined by paired t-test per panellist.
Discussion
Both BC treatments were observed to positively affect strawberry fruit yield, however, they impacted different aspects of strawberry production. BC1 did not impact overall fruit yield harvested per plant, but it did significantly (p < 0.001) increase (1.17-fold) the proportion of C1,2, which conversely reduced (0.85-fold) the proportion of fruit that were rejected as waste (W). These changes represent both a positive change to the farm’s usable yield and a positive reduction in the farm’s waste. By contrast, BC2 plants yielded on-average 1.26-fold more fruit, which corresponded in increases to both the C1,2 fruit and W fruit, which were 1.39-fold and 1.14-fold increased, respectively (A). However, as the proportion of C1,2 fruit was significantly (p = 0.008) increased (1.11-fold) as compared to the control, this increase in usable yield (despite a comparatively small increase in waste) represents an overall positive change to farm productivity (). Accordingly, the results herein indicate that BC1, which comprised molasses, Aloe vera extract and fish-hydrolysate, increased productivity by increasing the proportion of usable produce without impacting total fruit produced per plant, whilst the biostimulant complex of silica and phosphite (BC2) increased productivity by increasing total fruit (W and C1,2) produced per plant. The increases to usable yield (C1,2) are consistent with previous works, which demonstrated that application of a complex of molasses, Aloe vera and fish-hydrolysate (as per BC1) increased the quantity of tomato (Wise and Selby-Pham Citation2024) and strawberry (Wise, Selby-Pham, Simovich et al. Citation2024) yields, and the work of Estrada-Ortiz et al. (Citation2013) that demonstrated that application of phosphite (a component of BC2) to strawberry increased yield. Noting that ‘food grading’ loss – which is the rejection of nonconforming fruit – is a major driver of on-farm waste (Lewis et al. Citation2017), the results herein indicate that BC1 may be an effective strategy to substantially reduce the burdensome opportunity costs associated with generation of non-usable produce. Considering that strawberry production increased 37% in the decade from 2012 to 2022 (FAOSTAT Citation2023), the 39% increase in crop productivity of BC2 may provide a much-needed tool to farmers to match the increasing customer demands for strawberry. Nonetheless, BC1 treatment may be more appealing to farmer’s preferencing increases to process efficiency of farm activities, whilst BC2 treatment may be more appealing to farmer’s preferencing increases to process productivity.
Strawberry fruit consumers tend to prefer larger sized fruits (Lewers et al. Citation2020) and fruits that ‘taper’ in shape, which has become the typical shape expected by customers (Bhat et al. Citation2015; Tohidloo et al. Citation2018). Accordingly, strawberry fruit shape and size criteria are both included in on-farm QC assessments and supermarket incoming QC criteria to ensure on-shelf fruits meet customer preferences and thereby minimise transport and handling of unsellable fruits. The observed tendency of BC1 fruit towards increased size (weight, length and diameter) is consistent with the increase in strawberry fruit length observed by Wise, Selby-Pham, Simovich et al. (Citation2024) from BC1 application under controlled conditions. In contrast, the tendency of BC2 to decrease strawberry fruit size differs from previous works that identified a small positive impact of phosphite to strawberry fruit size (Estrada-Ortiz et al. Citation2013), highlighting potential differences from co-application of silicate with phosphite herein. The impact of these size changes was explored by comparison to the control group fruit, which had 77.9% conformity to size (weight, length and diameter) QC criteria (A). The reduced size of BC2 fruit did not result in a significant change in size QC conformity (p = 0.835), as whilst 2% fewer BC2 fruit were nonconforming as ‘too large’, this was proportionate with 2% more BC2 fruit nonconforming as ‘small’. However, the increased size of BC1 fruit did result in a significant (p = 0.006) increase in conformity to size QC criteria, as 84.1% fulfilled size QC criteria, driven by 6% fewer fruit classified as ‘small’. The strawberry size measure most strongly correlating with consumer preference is fruit diameter (Lewers et al. Citation2020), accordingly, the significant increase to BC1 fruit diameter may be expected to promote consumer preference. In contrast, BC2 fruit diameter was reduced with marginal significance (p = 0.061), however, the effect size of this change was very minimal (0.99-fold) and so is expected to be below perceptive thresholds and therefore not impact consumer preference. Accordingly, whilst BC2 had a neutral impact, the results highlight that BC1 contributed to crop productivity and reduction in on-farm waste through increases to berry QC conformity, with increases to fruit dimensions potentially also promoting consumer preference.
The shape of the ‘Albion’ strawberry fruit is described as ‘conical’ or ‘taper’ (Tudor et al. Citation2014), which is defined using the length-to-diameter ratio (L/D) as a fruit shape indicator (Jamieson Citation2016), wherein a L/D ratio of at least 1 is required for categorisation of strawberry fruit as ‘taper’ (Oo and Aung Citation2018; Htet et al. Citation2020). The average L/D of fruit from all treatments was 1.1 (1.13 for control and BC2, and 1.14 for BC1, E), indicating that fruit from all treatments had on-average a ‘taper’ shape. This result is consistent with the findings of Jamieson (Citation2016), which identified that within-genotype variance of L/D was low (3–6%), while greater variation is observed between genotypes. However, the 3% increase to length (p = 0.029, C), as compared to the 2% increase to diameter (p = 0.024, D) for BC1 treatment fruits, likely contributed to the significant (p = 0.011) increase in the proportion of BC1 fruit conforming to ‘taper’ shape QC requirements (93.9% for BC1 compared to 89.8% for control, Table S3). Whilst BC2 fruits were smaller than control, the changes to length and diameter were equivalent, leading to no change in the proportion of fruit conforming to ‘taper’ shape (L/D) QC requirements of BC2 fruit (90.1%, p = 0.817, Table S3). Variance in L/D has been previously identified as an indicator of fruit shape uniformity (Li et al. Citation2020). Whilst BC2 treatment did not significantly impact shape uniformity, the BC1 treatment was associated with a significant (p < 0.001) 0.86-fold reduction (improvement) in shape variation. Noting that fruit uniformity is perceived by customers as a quality indicator (Osei et al. Citation2018), these results suggest that the BC1 treatment may improve consumer visual assessment of strawberry fruit via reductions in variation of shape. Additionally, QC criteria limit within-punnet variance of fruits, suggesting that the BC1 treatment would ease fulfillment in the sorting of fruit during packaging to achieve within-package fruit uniformity.
The proportion of fruit conforming to fruit size and shape QC criteria were explored (Table S3) to indicate the overall impacts of the BC treatments to the proportion of strawberry fruit yields sellable as fresh produce (Class 1, C1). Compared to the 35.4% C1 for control (47.2% C1,2, of which 75.0% were C1), BC1 had 45.0% C1 fruit (55.2% C1,2, of which 81.4% were C1) and BC2 had 38.6% C1 fruit (52.2% C1,2, of which 74.0% were C1), were sellable as fresh produce. Whilst strawberries failing to meet QC criteria are not able to be sold into their primary market as fresh produce (aka ‘Class 1’ fruit), they may be utilised as ‘Class 2’ fruit and processed into jams or juices for sale (Sheane et al. Citation2017). Accordingly, ‘Class 1’ fruits are of substantially higher value to farmers than the QC nonconforming fruit (‘Class 2’), due to their higher sales value (Sheane et al. Citation2017). Overall, the increases in C1,2 fruit observed from either of the two BC treatments represent positive changes to farm yields, however, the larger proportion of C1 fruits observed from the BC1 treatment is likely to be considered preferable by farmers due to the higher value of this Class of fruit. Accordingly, these increases highlight the value of biostimulants to increase the profitability of strawberry farms by increasing the proportion of strawberry fruit sellable as fresh produce.
A major driver of the enjoyment of strawberry fruit is their sweet taste (Porter et al. Citation2023), largely driven by fruit sugar (aka ‘soluble solids’) content, measured as Brix. The BC1 treatment did not impact fruit Brix or pH, however, BC2 treatment was associated with on-average a 1.11-fold increase to fruit Brix (p = 0.263) and a 1.01-fold increase to the pH of 1000-fold diluted extract (p = 0.476) (Table S4). A consequence of this tendency towards increased sugar content in BC2 fruit was that whilst only 16.7% of control fruit met the 6 °Bx acceptability threshold, 83.3% of BC2 fruit (p = 0.080) were acceptable (Table S5). The observed impact of BC2 to Brix is consistent with previous results, wherein application of Phi to strawberry increased fruit sugar content (Estrada-Ortiz et al. Citation2011). Whilst sugar content has been shown to correlate with sweet taste perception (Saranwong et al. Citation2003; Jouquand et al. Citation2008), the tendency of BC2 fruit towards higher sugar content, whilst associated with a tendency towards higher scores in ‘sweet taste’ (1.03-fold increase, p = 0.792 compared to control), was not of a substantial enough effect size to deviate the categorisation of BC2 fruit (on-average 5.0) from those of control (on-average 4.8) or BC1 fruit (on-average 4.7), which were all categorised as ‘moderate’ (approximately 5) (Table S7). Accordingly, whilst the results indicate that BC2 impacted strawberry fruit sugar levels, the effect size appears insufficient to impact consumer preferences.
With consumers becoming more health-conscious, an attractive attribute of strawberry fruit is their functional food value, which is most notably their antioxidant potential (Fan et al. Citation2021). Herein, whilst not statistically significant, the BC treatments were associated with large on-average increases to the antioxidant capacity measures, TPC and total flavonoids (Table S4). The direction of this change to on-average increases in antioxidant capacity is similar to previous works applying BC1 to strawberry (Wise, Selby-Pham, Simovich et al. Citation2024) and fish emulsion (a component of BC1) to tomato (Wise and Selby-Pham Citation2023), which demonstrated significant increases to TPC but not flavonoid contents. However, the results differ from previous works applying BC1 to tomato wherein antioxidant capacity reduced, as demonstrated by unchanged TPC and decreased flavonoid content (Wise and Selby-Pham Citation2024). Noting that both TPC and flavonoids are associated with antioxidant potential, the results herein suggest that the BC treatments had a tendency to increase the functional food value of strawberry fruit by increasing concentrations of functional phytochemicals. Noting that phenolics are involved in plant defence mechanisms (Kumar et al. Citation2020) and fish-hydrolysate (a component of BC1) has been demonstrated to induce molecular mechanisms associated with plant defence (Wise, Selby-Pham, Chai et al. Citation2024), these trends in antioxidant capacity changes suggest that BC1 may be increasing functional food value via induction of plant defence mechanisms. Furthermore, application of silica has been shown to increase phenolics in tomato (Pinedo-Guerrero et al. Citation2020), apple (Karagiannis et al. Citation2021) and strawberry (Hajiboland et al. Citation2018), which was attributed to impacting molecular mechanisms associated with mediation of abiotic stress. Similarly, application of phosphite has been shown to increase phenolics in bean (Costa et al. Citation2018) and potato (Han et al. Citation2021), which is attributed to induction of plant defence responses. Accordingly, the results herein indicate that BC2 (combination of Si and Phi) may benefit strawberry fruit antioxidant potential, through induction of plant defence or stress mediation responses.
Conclusion
Strawberry on-farm fertigation regimens were supplemented with complexes of biostimulants, including a complex of molasses, Aloe vera extract and fish-hydrolysate (BC1) or a complex of potassium silicate and potassium phosphite (BC2). BC1 was observed to increase the proportion of yields that would be sellable as fresh produce (Class 1) by decreasing the proportion of waste as well as decreasing the proportion of yields only sellable as processed goods (Class 2). In contrast, BC2 increased overall yields, which included increases to Class 1, Class 2 and waste. Sensory profiling indicated that the BC treatments were not found to significantly impact consumer preference of goods. However, large on-average increases were observed for antioxidant contents, suggesting enhanced functional food properties of the strawberry fruit resulting from the BC treatments. Accordingly, BC1 inclusion is recommended for farms preferencing increased production efficiency, whilst BC2 is recommended for farms preferencing yield maximisation. Future research could involve application of both BC1 and BC2 to explore the potential to enhance both efficiency and productivity of farm activities in parallel.
Author contributions
KW carried out experiments, constructed figures and drafted the manuscript. JSP assisted with experiments and manuscript drafting, editing and revision.
Supplemental data.docx
Download MS Word (38.9 KB)Acknowledgements
The authors would also like to acknowledge Nutrified Pty Ltd for the industry scholarship, which supported this work. The authors would also like to acknowledge Joanna Picerni, Jasmine Du and Tony Tran for their assistance and support during experiments, and Orlin Antanasov and Daniel Rolek from Sunny Ridge Strawberry Farm for providing access farm facilities and support during activities.
Disclosure statement
No potential conflict of interest was reported by the author(s).
References
- Acosta-Vargas P, Salvador-Ullauri LA, Luján-Mora S. 2019. A heuristic method to evaluate web accessibility for users with low vision. IEEE Access. 7:125634–125648.
- Bhat R, Geppert J, Funken E, Stamminger R. 2015. Consumers perceptions and preference for strawberries-a case study from Germany. International Journal of Fruit Science. 15:405–424. doi:10.1080/15538362.2015.1021408.
- Canali M, Amani P, Aramyan L, Gheoldus M, Moates G, Östergren K, Silvennoinen K, Waldron K, Vittuari M. 2016. Food waste drivers in Europe, from identification to possible interventions. Sustainability. 9:37. doi:10.3390/su9010037.
- Costa BHG, de Resende MLV, Monteiro ACA, Ribeiro Júnior PM, Botelho DMdS, Silva BMd. 2018. Potassium phosphites in the protection of common bean plants against anthracnose and biochemical defence responses. Journal of Phytopathology. 166:95–102. doi:10.1111/jph.12665.
- Ebrahimi M, Souri MK, Mousavi A, Sahebani N. 2021. Biochar and vermicompost improve growth and physiological traits of eggplant (Solanum melongena L.) under deficit irrigation. Chemical and Biological Technologies in Agriculture. 8:1–14. doi:10.1186/s40538-021-00216-9.
- Estrada-Ortiz E, Trejo-Téllez L, Gómez-Merino F, Núñez-Escobar R, Sandoval-Villa M. 2011. Phosphite on growth and fruit quality in strawberry. II International Symposium on Soilless Culture and Hydroponics. 947:277–282.
- Estrada-Ortiz E, Trejo-Téllez L, Gómez-Merino F, Núñez-Escobar R, Sandoval-Villa M. 2013. The effects of phosphite on strawberry yield and fruit quality. Journal of Soil Science and Plant Nutrition. 13:612–620.
- Fan Z, Hasing T, Johnson TS, Garner DM, Schwieterman ML, Barbey CR, Colquhoun TA, Sims CA, Resende MF, Whitaker VM. 2021. Strawberry sweetness and consumer preference are enhanced by specific volatile compounds. Horticulture Research. 8:66.
- FAOSTAT. 2023. Crops and livestock products: strawberries; [accessed 2024 Mar 01]. https://www.fao.org/faostat/.
- Feldmann MJ, Hardigan MA, Famula RA, Lopez CM, Tabb A, Cole GS, Knapp SJ. 2020. Multi-dimensional machine learning approaches for fruit shape phenotyping in strawberry. GigaScience. 9:giaa030. doi:10.1093/gigascience/giaa030.
- Gómez-Merino FC, Trejo-Téllez LI. 2015. Biostimulant activity of phosphite in horticulture. Scientia Horticulturae. 196:82–90. doi:10.1016/j.scienta.2015.09.035.
- Hajiboland R, Moradtalab N, Eshaghi Z, Feizy J. 2018. Effect of silicon supplementation on growth and metabolism of strawberry plants at three developmental stages. New Zealand Journal of Crop and Horticultural Science. 46:144–161. doi:10.1080/01140671.2017.1373680.
- Han X, Xi Y, Zhang Z, Mohammadi MA, Joshi J, Borza T, Wang-Pruski G. 2021. Effects of phosphite as a plant biostimulant on metabolism and stress response for better plant performance in Solanum tuberosum. Ecotoxicology and Environmental Safety. 210:111873. doi:10.1016/j.ecoenv.2020.111873.
- Htet HTM, Thu TT, Win AK, Shibata Y. 2020. Vision-based automatic strawberry shape and size estimation and classification using Raspberry Pi. 2020 59th Annual Conference of the Society of Instrument and Control Engineers of Japan (SICE). IEEE, pp. 360–365.
- Jamieson A. 2016. Strawberry shape: phenotypic variation in length and width. VIII International Strawberry Symposium 1156, pp. 135–140.
- Jouquand C, Chandler C, Plotto A, Goodner K. 2008. A sensory and chemical analysis of fresh strawberries over harvest dates and seasons reveals factors that affect eating quality. Journal of the American Society for Horticultural Science. 133:859–867. doi:10.21273/JASHS.133.6.859.
- Karagiannis E, Michailidis M, Skodra C, Molassiotis A, Tanou G. 2021. Silicon influenced ripening metabolism and improved fruit quality traits in apples. Plant Physiology and Biochemistry. 166:270–277. doi:10.1016/j.plaphy.2021.05.037.
- Kumar S, Abedin MM, Singh AK, Das S. 2020. Role of phenolic compounds in plant-defensive mechanisms. Plant Phenolics in Sustainable Agriculture. 1:517–532. doi:10.1007/978-981-15-4890-1_22.
- Kumar S, Jeevithashree DV, Biswas P. 2021. Comparing ten WCAG tools for accessibility evaluation of websites. Technology and Disability. 33:163–185.
- Lewers KS, Newell MJ, Park E, Luo Y. 2020. Consumer preference and physiochemical analyses of fresh strawberries from ten cultivars. International Journal of Fruit Science. 20:733–756. doi:10.1080/15538362.2020.1768617.
- Lewis H, Downes J, Verghese K, Young G. 2017. Food waste opportunities within the food wholesale and retail sectors. Institute for Sustainable Futures (ISF), Sydney, Australia.
- Li B, Cockerton HM, Johnson AW, Karlström A, Stavridou E, Deakin G, Harrison RJ. 2020. Defining strawberry shape uniformity using 3D imaging and genetic mapping. Horticulture Research. 7.
- Makhal A, Robertson K, Thyne M, Mirosa M. 2021. Normalising the “ugly” to reduce food waste: exploring the socialisations that form appearance preferences for fresh fruits and vegetables. Journal of Consumer Behaviour. 20:1025–1039. doi:10.1002/cb.1908.
- Miller K, Feucht W, Schmid M. 2019. Bioactive compounds of strawberry and blueberry and their potential health effects based on human intervention studies: a brief overview. Nutrients. 11:1510. doi:10.3390/nu11071510.
- Noroozlo YA, Souri MK, Delshad M. 2019. Stimulation effects of foliar applied glycine and glutamine amino acids on lettuce growth. Open Agriculture. 4:164–172. doi:10.1515/opag-2019-0016.
- Oo LM, Aung NZ. 2018. A simple and efficient method for automatic strawberry shape and size estimation and classification. Biosystems Engineering. 170:96–107. doi:10.1016/j.biosystemseng.2018.04.004.
- Osei MK, Danquah A, Blay E, Danquah E, Adu-Dapaah H. 2018. Stakeholders’ perception and preferences of post-harvest quality traits of tomato in Ghana. Sustainable Agriculture Research. 7:93–109. doi:10.5539/sar.v7n3p93.
- Pinedo-Guerrero ZH, Cadenas-Pliego G, Ortega-Ortiz H, González-Morales S, Benavides-Mendoza A, Valdés-Reyna J, Juárez-Maldonado A. 2020. Form of silica improves yield, fruit quality and antioxidant defense system of tomato plants under salt stress. Agriculture. 10:367. doi:10.3390/agriculture10090367.
- Porter M, Fan Z, Lee S, Whitaker VM. 2023. Strawberry breeding for improved flavor. Crop Science. 63:1949–1963. doi:10.1002/csc2.21012.
- Saranwong I, Sornsrivichai J, Kawano S. 2003. Performance of a portable near infrared instrument for brix value determination of intact mango fruit. Journal of Near Infrared Spectroscopy. 11:175–181. doi:10.1255/jnirs.364.
- Savvas D, Ntatsi G. 2015. Biostimulant activity of silicon in horticulture. Scientia Horticulturae. 196:66–81. doi:10.1016/j.scienta.2015.09.010.
- Sheane R, McCosker C, Lillywhite R. 2017. Food waste in primary production-a preliminary study on strawberries and lettuces. Banbury: The Waste and Resources Action Programme.
- Souri MK, Hatamian M. 2019. Aminochelates in plant nutrition: a review. Journal of Plant Nutrition. 42:67–78. doi:10.1080/01904167.2018.1549671.
- Sunny Ridge Strawberry Farm. 2019. Finished Product Specification: SunnyRidge (Black) - Strawberries (250 g) – Tumble Pack, Sunny Ridge Strawberry Farm Quality System Controlled Document.
- Tohidloo G, Souri MK, Eskandarpour S. 2018. Growth and fruit biochemical characteristics of three strawberry genotypes under different potassium concentrations of nutrient solution. Open Agriculture. 3:356–362. doi:10.1515/opag-2018-0039.
- Tudor V, Asănică A, Neagu T. 2014. First results of some day-neutral strawberry cultivars behavior in the Bucharest area conditions. Scientific Papers. Series B, Horticulture. LVIII:101–106.
- Wise K, Selby-Pham J. 2023. Enhancement of tomato functional food value through nutrient supplementation with fish emulsion biostimulant. Journal of Horticultural Sciences. 18:351–356. doi:10.24154/jhs.v18i2.2136.
- Wise K, Selby-Pham J. 2024. Enhancement of tomato hedonic quality through fertiliser supplementation with a biostimulant complex comprising molasses, Aloe vera extract, and fish-hydrolysate. New Zealand Journal of Crop & Horticultural Science. 1–10. doi:10.1080/01140671.2024.2318493.
- Wise K, Selby-Pham J, Chai X, Simovich T, Gupta S, Gill H. 2024. Fertiliser supplementation with a biostimulant complex of fish hydrolysate, Aloe vera extract, and kelp alters cannabis root architecture to enhance nutrient uptake. Scientia Horticulturae. 323:112483. doi:10.1016/j.scienta.2023.112483.
- Wise K, Selby-Pham J, Simovich T, Gill H. 2023. Enhancement of capsicum (Capsicum annuum L.) functional food value through nutrient supplementation with a biostimulant complex comprising triacontanol, phosphate, and potassium. New Zealand Journal of Crop and Horticultural Science. 1–12. doi:10.1080/01140671.2023.2278799.
- Wise K, Selby-Pham J, Simovich T, Gill H. 2024. A biostimulant complex comprising molasses, Aloe vera extract, and fish-hydrolysate enhances yield, aroma, and functional food value of strawberry fruit. Advances in Horticultural Science. 38:47–62. doi:10.36253/ahsc-15033.
- Wise K, Simovich T, Gill H, Selby-Pham J. 2024. Bioaccumulation of silicon and enhancement of cannabis inflorescence yield from fertiliser supplementation with the biostimulants silicate and phosphite. New Zealand Journal of Crop and Horticultural Science. 1–13. doi:10.1080/01140671.2024.2339494.
- Wise K, Wedding T, Selby-Pham J. 2022. Application of automated image colour analyses for the early-prediction of strawberry development and quality. Scientia Horticulturae. 304:111316. doi:10.1016/j.scienta.2022.111316.
- Wise K, Williams LB, Selby-Pham S, Wright PF, Simovich T, Gill H, Gupta A, Puri M, Selby-Pham J. 2024. Supplementation of fertiliser with the biostimulant molasses enhances hemp (Cannabis sativa) seed functional food antioxidant capacity by induction of stress responses. Scientia Horticulturae. 334:113299. doi:10.1016/j.scienta.2024.113299.