
Abstract
Since the beginning of the COVID-19 epidemic, governments across Europe have attempted to prevent the spread of the disease by limiting the movement of their citizens. In this article, we analyse whether the level of compliance with social distancing measures is associated with political, economic, and demographic factors. In particular, our interests lie in two areas. First, as lockdowns have dragged on, many countries see some political resistance, often, though not always, from populist movements: are localities that support populist movements more likely to ignore social distancing measures? Secondly, economic security: do localities with higher levels of income and wealth have higher levels of social distancing? We combine anonymised movement data from people’s mobile phones drawn from the Google Community Mobility surveys with subnational economic and demographic data to answer these questions. It is found that across Europe, social distancing patterns correlate strongly with populist attitudes and economic security.
Supplemental data for this article can be accessed online at: http://doi.org/10.1080/01402382.2021.1917154
The COVID-19 pandemic has had an unexpected and severe impact on every aspect of global life. In the absence of vaccines and specific treatment during the first phase of the pandemic, preventive measures have been essential policy tools in the fight against rising numbers of infections and deaths. Social distancing has been prescribed as the most critical non-pharmaceutical, preventive intervention to slow the spread of COVID-19. Most governments have recommended – or in some cases, firmly required – their citizens to work from home, avoid gathering in large groups, and cancel or postpone celebrations at varying levels of strictness. Yet, voluntary compliance with these measures and the perceptions of their necessity have differed immensely across localities and individuals. While some individuals took to the street to protest the draconian lockdown measures, others have criticised their governments, claiming the ongoing restrictions were not enough to slow the spread of the virus.
Why do some citizens comply with public health advisories from governments while others believe such measures are unnecessary and harm both themselves and others by non-compliance? The emerging literature on compliance with social distancing orders has focussed extensively on partisanship and political trust to explain differences in personal responses to the pandemic. Scholars find that individuals and counties that predominantly voted for Donald Trump in the 2016 presidential election comply less with social distancing practices in the United States (Allcott et al. Citation2020; Gollwitzer et al. Citation2020; Kushner Gadarian et al. Citation2020; Painter and Qiu Citation2020). In Europe, high levels of political trust increase adherence to social distancing guidelines and limit non-essential activities (Bargain and Aminjonov Citation2020). Existing work, however, largely examines self-reported attitudes and behaviours in surveys, and where actual behaviour is analysed, it is in single-case studies, typically of the USA.
Although understanding the factors that drive non-compliance with public health orders is essential, we know remarkably little about how demographic, economic, and political factors actually determine the level of local compliance. Are citizens who have populist sentiments more likely to ignore social distancing measures? How do economic factors, such as wealth or economic development, affect compliance levels? How do local characteristics, such as population density, affect adherence to public health guidelines? And how does the stringency of policies affect the role of these factors in shaping social distancing? This article will answer these questions.
We argue that areas with more populist attitudes or higher support for populist movements will engage in less social distancing. We also take seriously the physical and economic constraints that individuals face. People in wealthier areas – measured by income, house prices, or occupational structure – will find it easier to work from home and thus engage in more social distancing. Furthermore, we argue that patterns of social distancing depend on both the stringency of government lockdown policies and the political, economic, and demographic characteristics. Where lockdowns were complete and fully enforced, we expect little difference across regions. However, in those countries or time periods where lockdowns were looser or loosened, we expect substantial variation in social distancing and for this variation to be driven by local political attitudes as well as economic and demographic factors.
Our empirical analysis tests these arguments using social distancing data from the first wave of the pandemic drawn from Google’s Community Mobility surveys, which use anonymised mobility data from cellular phones. This data provides measures of activity in various locations (workplace, home, retail) since the end of February 2020 for subnational geographical units across Europe and beyond. This enables us to go dramatically beyond existing single-country studies.
First, we focus on subnational analysis of the UK, Sweden, and Denmark. Using generalised difference–indifferences models we show that in the UK, social distancing patterns correlate strongly with the local Brexit vote. In Sweden, we find that workplace activity was significantly higher in localities that predominantly vote for Sweden Democrats. Finally, in Denmark, we find that localities with higher voting for populist parties, including the Danish People’s Party, experienced more workplace activity. Second, in all three cases, we find that economic conditions determine the level of workplace activity during the pandemic. In the UK and Denmark, localities with higher house prices engaged in more social distancing, while in Sweden places with higher median incomes refrained from going to work to a higher extent during the outbreak. Finally, we show that in all three countries population density has a significant, negative impact on workplace activity.
We then turn to a comparative investigation of the effects of populist attitudes, demographic conditions, and economic security on social distancing practices in Europe. Using subnational data on incomes, house prices, population density, demographic conditions, and political attitudes from 23 countries and 295 regions, we find that populist radical right sentiments are positively correlated with higher workplace activity during the pandemic, while housing wealth and population density are negatively correlated. Our findings confirm that, while political attitudes affect behaviour during public health crises, both economic and physical constraints, such as the ability to forego some income by staying at home or the high probability of a safe commute to the office due to low population density, impact local differences in reaction to precautionary measures advised by governments.
Argument
Since the beginning of the COVID-19 epidemic, governments across Europe and beyond have attempted to prevent the spread of the disease by limiting the movements of their citizens. Much of this has been accomplished through official government lockdowns. These have restricted citizens from leaving their houses except for specific reasons: grocery purchases, medical emergencies, or exercise. Yet, no government can perfectly monitor the movements of its citizens and enforce full compliance with the public health guidelines. Lockdowns and social distancing guidelines require that people voluntarily refrain from leaving their house even in the absence of credible legal sanction. Moreover, because lockdowns cannot be comprehensive, we see substantial variation not only across countries with different lockdown regimes but within them in terms of how much people engage in social distancing. What explains this variation?
A growing body of empirical work that examines the determinants of lockdown compliance during the pandemic focuses on the role of partisanship. A scholarly consensus emerged around the idea that ‘partisanship is the single most consistent factor explaining differences’ in individuals’ health behaviours and attitudes (Allcott et al. Citation2020; Barrios and Hochberg Citation2020; Gollwitzer et al. Citation2020; Kushner Gadarian et al. Citation2020: 1; Painter and Qiu Citation2020). While most of the evidence comes from the US, showing that counties that are traditionally Republican or predominantly voted for Donald Trump in the 2016 presidential election were less likely to reduce physical mobility and wear masks, analyses from other countries such as Italy and Brazil confirm that political attitudes shape compliance with social distancing measures (Ajzenman et al. Citation2020; Barbieri and Bonini Citation2020).
In this article, we focus on the effect of populist attitudes’ prevalence on regional physical activity levels. The appearance and persistence of populist parties on the main stage of European politics have sparked a significant discussion about the social consequences of populist appeal. Although there are many interpretations of the exact definition of populism, existing work generally agrees that deep cynicism and resentment of the establishment – including intellectual elites, scientific experts, and the privileged rich – is one of the defining characteristics of people who support such movements (Inglehart and Norris Citation2016; Mudde Citation2007). Populists view the society deeply divided into two conflicted groups: the ordinary people and the corrupt and self-serving elite, which often results in distrust of and non-compliance with policies and recommendations that are seen as rhetorics of status, privilege, and authority (Ajzenman et al. Citation2020; Hawkins et al. Citation2018; Müller Citation2017).
How do populist attitudes affect preferences over social distancing during the pandemic? We argue there are effects at two levels – one individual-level and one politician-driven. First, by definition, individuals who support populist movements are less likely to trust scientific experts and political institutions. Given that most social distancing guidance, mask mandates, and stay-at-home orders have been advised by scientists and mandated by political institutions, individuals who have populist attitudes will be less likely to take precautionary measures seriously, trust the advice of the establishment and scientists, and, ultimately, comply with the rules. For example, Durante et al. (Citation2021) argue that prevailing levels of civic capital – a commonly used measure of trust – explain variation in social distancing in Italy during the pandemic. In our view, populist voting allows us to better examine more fine-grained local differences in trust than measures of civic capital, such as survey measures and newspaper readership, which are typically collected at a more aggregated level.
Second, research shows that individuals with populist world-views are more likely to believe in conspiracy theories (Eberl et al. Citation2020). As COVID-19 spread worldwide, conspiracy theories about its existence, severity, and prevention followed closely behind. Examples include the belief that COVID-19 is a Bill Gates-led plan to vaccinate the world’s population, coronavirus has killed far fewer people than reported, 5 G mobile technology is to blame for the spread of the virus, or the pandemic is a pseudo-emergency planned by the elite to take away people’s freedoms. Very intuitively, individuals who are more likely to believe in these conspiracies are less likely to comply with containment measures and social distancing because they do not believe that COVID-19 is a real concern or social distancing will not be effective against the conspired origins of the disease. The adverse effect of populist world-view on trusting scientific experts’ advice has also been documented in other types of pressing issues, such as climate change denial (Huber et al. Citation2020) and anti-vaccination movements (Kennedy Citation2019).
Additionally, health crises are particularly vulnerable to elites’ deliberate politicisation and polarisation of available information. In fact, earlier work has shown that politicised information disseminated from media outlets and political elites remains a crucial driver of differences in individuals’ beliefs and behaviour during health emergencies (Ajzenman et al. Citation2020; Fischer Citation2020; Haman Citation2020). Lasco and Curato (Citation2019) argue that moral panics in the time of pandemics generate one of the following responses: (1) ‘a technocratic response which seeks to calm the public by letting experts and institutions of accountability take over’ or (2) ‘a populist response which further spectacularises the crisis and pits “the people” against the failed and untrustworthy establishment’. These two responses co-exist during most public health crises, with different political and institutional figures taking on different stances. Calling the political figures who resort to the latter response ‘medical populists,’ Lasco and Curato (Citation2019) argue that medical populists pit the people against the establishment, accusing medical or political elites’ technocratic response as a corrupt initiative to serve their own needs at the expense of ordinary people. Given that populist attitudes require a social context where the public is triggered to think that the corrupt elite is intentionally acting in ways that benefit themselves at the expense of ordinary people to become active, the medical populists’ response to a moral panic usually serves as a trigger that leads to polarised beliefs about the evaluation of and solutions for the public health emergency (Hawkins et al. Citation2018). Individuals who support populist movements will be more likely to be subject to medical populists’ messages on the mainstream and social media, who have publicly dismissed the pandemic’s risk by claiming that wearing a mask would make one look ridiculous, and described the COVID-19 outbreak as a ‘hoax’ (Ajzenman et al. Citation2020; Bursztyn et al. Citation2020).
While populist attitudes are essential in shaping social distancing compliance, these attitudes and behavioural manifestations are subject to economic and physical constraints. People with abundant economic resources and wealth may find social distancing easier as financial stability allows people to stay at home for their safety. Homeowners, especially in areas with expensive housing and gardens, are likely to find it easier to stay at home than people renting apartments. In the absence of firmly monitored rules and regulations, limited economic resources could force individuals to seek alternative modes of employment or force people to go to work in fear of losing their job, even if an individual firmly believes that social distancing should be exercised to help prevent the spread of COVID-19 (Adams-Prassl et al. Citation2020). Accordingly, we should expect the impact of political beliefs on social distancing behaviour to be stronger in higher-income locations, where people have more material ability to choose whether to socially distance.
The occupational structure of the population will also lead to differences in social distancing. People in managerial or professional occupations will typically find it easier to work from home than those in manual employment. While localities with people who can continue to work from home will experience significant decreases in workplace activity, places with residents who are involved with manual work will still see significant workplace activity even if government guidelines encourage people to stay at home. Finally, the lived environment itself may matter – people in low density communities may have to travel further and more regularly for work or essential purchases. More rural areas may also have stronger populist and anti-lockdown attitudes and lower levels of trust in government and science. People in high density areas may themselves be more concerned about catching the virus and social distance more.
Lockdown policies themselves will shape how this political and socio-economic heterogeneity manifests in different patterns of social distancing. Before a lockdown begins we would expect little difference across regions in mobility from their baseline in January. However, the stringency of the lockdown will affect what kinds of variation in social distancing can emerge. In countries such as France and Spain, where the initial lockdown was near-complete and strongly enforced, all localities should be compelled to behave similarly. In those countries such as the UK and especially Sweden, where lockdown was enforced less vigorously, some localities may socially distance much more than others, and we would expect this variation to be related to the political and socioeconomic factors outlined above. A similar pattern should hold when countries with stringent lockdowns begin to loosen them.
The empirical implications of these theoretical claims are fourfold. First, both the vote share of populist parties or movements, as well as the aggregated local level of populist sentiments, should be negatively connected to adherence to the pandemic’s lockdown measures. Second, we expect that localities with better economic resources – higher house prices or GDP per capita or with more managers and professionals relative to manual workers – should see much higher social distancing levels. Third, in places where population density is higher, individuals will be more likely to stay at home during the pandemic. Finally, the degree to which these factors can explain differences in social distancing across localities will depend on the stringency of the local or national lockdown measures.
Social distancing in Britain, Sweden, and Denmark
How can we study differences within and across countries in social distancing during the COVID-19 epidemic? Broadly, there are two ways of getting at this question. First, we could ask people to self-report their adherence to social distancing guidelines. Kushner Gadarian et al. (Citation2020), for example, look at survey respondents’ claims about hand-washing and self-quarantining early on in the pandemic. The advantage to such a research design is that we obtain information about individual behaviour from individuals themselves. The disadvantage, though, is that such responses are prey to a number of biases, including sampling bias and self-report bias, if people exaggerate their social distancing behaviour for social desirability reasons.Footnote 1
We adopt the second approach to measuring social distancing during the COVID epidemic, which is to examine measures of actual, albeit aggregated, behaviour. In particular we focus on mobility measures collected by Google and which are provided at the regional level on a daily basis. The advantage of this approach is that we avoid self-report bias and attain full coverage of multiple countries (and in many cases of all regions within those countries). The disadvantage is that this data is aggregate so we need to be aware of the propensity for problems of ecological inference in determining whether patterns of association at the regional and local level actually reflect the same patterns at the individual level. Thus our analysis here should be viewed as an important counterpart to that conducted by scholars using survey designs.
The Google Community Mobility Data examines six daily measures of mobility for 135 countries starting in mid-February 2020. In 95 of these countries, Google collects the data at the regional level and in some cases the data is collected at a very disaggregated level (for example, US counties, Swedish municipalities, and Turkish districts). In the next section we use Google Community Mobility Data drawn from regional levels across Europe but in this section we examine data from the United Kingdom, Sweden, and Denmark which have locally quite disaggregated data, with 366 localities in the UK, 271 in Sweden, and 94 in Denmark.
What do the Google mobility indices measure and how are they constructed? Google collects location data from users of Android phones or people logged into their Google accounts with location reporting activated, anonymises this data, and aggregates it to a regional (or national) level. Google has six different measures of where people are located: groceries and pharmacies (essential retail), parks, retail and recreation (nonessential retail, hospitality and recreation), residential, transit stations, and workplaces. Our main interest will be in residential and particularly workplace activity as we highlight the core distinction between staying indoors at home and going to work – that is the capacity or desire to work from home.
For each of these locations on a particular day and in a particular locality, Google compares the amount of activity to a baseline day for that locality drawn as the average day from January 3 to February 6, 2020. In other words, the mobility data compare a day’s activity in a location to an average pre-COVID day in that location. Since that average is drawn from the winter, we need to be aware that mobility patterns will naturally change as the seasons do. Moreover, weekends will always look dissimilar to weekdays since both are being compared to an average baseline day.Footnote 2
We examine the United Kingdom, Sweden, and Denmark for a number of reasons. Firstly, all three countries have disaggregated data in the Google database that allows us to analyse local differences with populations typically in the tens of thousands.Footnote 3
Secondly, the UK, Denmark and Sweden had more limited lockdowns than their European counterparts, which in turn meant more potential variation across regions. Compared to the very strict lockdown regimes in say France or Spain, British, Danish, and especially Swedish citizens were allowed out more times per day and for more reasons.
Following the hypotheses developed in the previous section, we expect a variety of demographic, economic, and political measures to be associated with differences across regions in social distancing behaviour in workplace and residential activity. These vary across the three countries in terms of what we can match to the given local geographies, though the variables are broadly similar.
In the UK for demographics we include controls for the proportion of the local authority under the age of thirty or over seventy, and a measure of population density. For economic controls we include measures of local GDP per capita, the proportion of people employed in high skilled services, the proportion employed in agriculture, fishing or manufacturing (primary/secondary sectors) and the occupational ratio, defined as the proportion of people employed in occupations coded as ISCO 1 or 2 (managers and professionals) divided by the proportion in ISCO 8 or 9 (factory workers and manual workers). As our measure of wealth we use the log of median local house prices in January 2020. For our political variable, we use local voting patterns for ‘Remain’ in the Brexit referendum in 2016.Footnote 4
In Sweden we also use a measure of population density as a demographic control, along with economic measures including the employment rate, median income, and measures of educational attainment (primary, secondary, post-secondary). For house prices we use the average square foot price for houses in the municipality in 2018. Our political variable is the proportion of the vote attained by the Sweden Democrats in the 2018 Election.
In Denmark we include measures of population density and the shares of citizens under eighteen and over sixty-five as demographic controls. For economic variables, we include measures of the occupational structure (employment by sector), average disposable income, and the average house price per square metre in the municipality in the fourth quarter of 2019. The political variable is the combined local vote share of the Danish People’s Party and the two new populist right parties, Stram Kurs and Nye Borgerlige, in the 2019 election.
For each country we begin by examining whether there are bivariate cross-sectional differences in social distancing on given days between localities. We then examine how robust these patterns are to a multivariate cross-sectional model conducted day by day between February and August. Finally, we run pooled models to examine whether changes in the lockdown regulations had differential effects on social distancing across regions as defined by their politics.
Social distancing in the UK
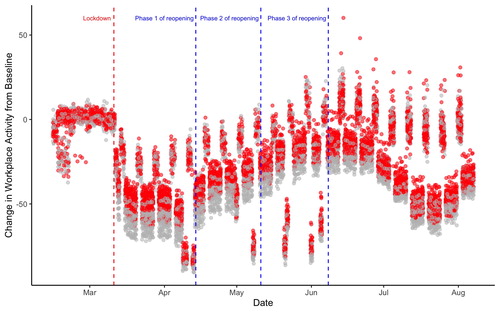
We begin by looking at the overall pattern of workplace activity across 366 UK local authorities between February and August 2020. adds two further pieces of information. First, a set of vertical dashed lines note the dates on which the UK government imposed partial (bars/restaurants) and then full lockdown and later loosened lockdown by permitting first unlimited recreation, then opening non-essential retail, and finally opening pubs (‘Independence Day’). Second, we colour-code local authorities by their vote in the 2016 Brexit Referendum, with yellow denoting fifty percent or above for ‘Remain’ and blue denoting the same for ‘Leave’.
Figure 1. UK workplace activity, government announcements, and the Brexit vote.
Note: Blue: Voted ‘Leave’; Yellow: Voted Remain.
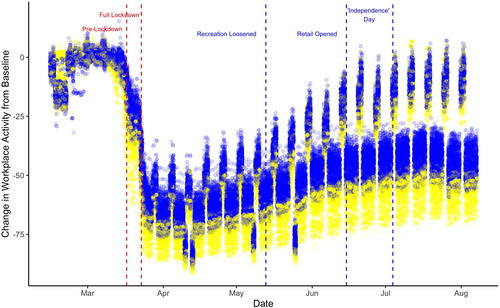
A number of striking associations emerge from this ‘dragon’-shaped graph. We begin with the overall shape. In the head of the dragon on the left we see that, save for a brief drop associated with school half term, workplace activity in late February and early March looked much the same as it had in the five weeks before. However, once the first lockdown warnings had been issued, up to the full lockdown itself, there is a collapse in workday activity by around two-thirds. Workplace activity remains very low into May after which there is a general increase until July, at which point it levels off at around half its baseline level. Thus we see the lockdown broadly ‘worked’ – even before its official beginning – but the loosenings of the lockdown by the government have had weaker effects in reversing this pattern. Finally, the ‘dragon’ also has scales – these are the weekend days where workplace activity is less low than a counterfactual weekend – and legs – these are public holidays (Easter, May bank holidays) that fall on normal weekdays and where activity is thus abnormally low.
The other striking association in is the distinction between ‘Leave’ and ‘Remain’ voting parts of the country. Before late March these areas behave in very similar ways – there are essentially parallel trends. Once lockdown is underway, ‘Leave’ voting areas have substantially higher workplace activity and this pattern continues throughout the time series, weakening slightly towards the middle of the summer. On average the effect is a difference of eight percent points in workplace activity, relative to baseline.
A large literature in British politics reminds us that the Brexit vote was related to a large number of economic and demographic characteristics (Adler and Ansell Citation2020; Carreras et al. Citation2019). Perhaps what we see in just reflects these underlying forces. Moreover, these economic and demographic factors may well be important on their own terms in shaping social distancing. Accordingly, we now move to a multivariate analysis, examining day-by-day regression analyses of the association between social distancing and a variety of economic and demographic factors along with the Brexit vote.
reflects the aggregation of 175 separate daily regressions on 366 British localities, excluding weekends and public holidays. Each is a linear regression of either (a) workplace activity or (b) residential activity on the proportion of people employed in high skilled services, the proportion employed in primary/secondary sectors, population density, population under 30 (not shown), local GDP per capita (not shown), population over 70, median house prices, the vote for ‘Remain’ in 2016, and dummies for each UK region (not shown). We plot the coefficient estimate and its 95 percent confidence interval for each day, for each independent variable.
Figure 2. Day by day estimated coefficients with 95% confidence intervals for UK.
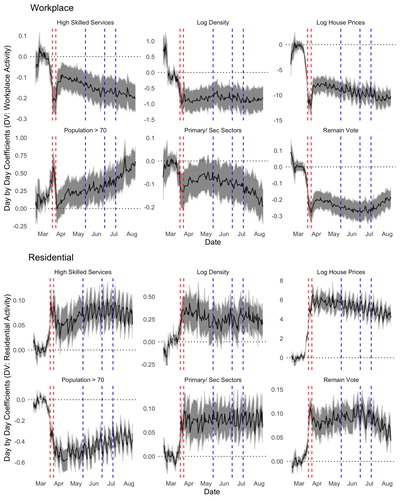
As anticipated, places with more workers in high-skilled service sector occupations, where people can more easily work from home, do see large drops in workplace activity and increases in residential activity. More surprisingly, we also see this pattern, albeit less strongly, with workers in primary and secondary sectors. Population density is strongly negatively associated with workplace activity post lockdown and positively associated with residential activity. Places with elderly populations, by contrast, have relatively higher workplace activity and lower residential activity. Housing wealth operates similarly to density and occupation. Places with more expensive housing had lower workplace activity and higher residential activity. A doubling of local house prices is associated with a ten percent point decline in workplace activity for most of the period. Finally, we see that the vote-share a locality had for ‘Remain’ is strongly negatively correlated with workplace activity (around 0.25 percent points lower per point higher vote for ‘Remain’) and positively associated with residential activity.
The implication cross-sectionally is that higher income and wealth, a more professional occupational profile, a denser population, and more ‘Remain’ support are all correlated with social distancing and that this pattern emerges just as the partial lockdown is announced in mid-March, remaining consistent throughout lockdown. Although income, housing wealth, professional occupations, urban areas and ‘Remain’ voting are indeed correlated they still appear to exert separate predictive power when combined in the same analysis. in the Online Appendix repeats this analysis for non-essential retail and recreation activity and again we find places with more ‘Remain’ voting, higher house prices, and more high skilled service workers have less activity following the lockdown.
In we go a step further and pool the data, focussing on the differential impact of ‘Remain’ voting on workplace activity following the breakpoints of each lockdown or lockdown loosening, while controlling for regions, individual days, and even cross-sectional differences across localities.Footnote 5
Table 1. Workplace activity in the UK (no weekends).
Model 1 includes lagged workplace activity, the cross-sectional variables used above as well as the ISCO occupation measure, dummies for each region, dummies for the period following each of these breakpoints, and the interaction of the locality’s ‘Remain’ vote with those dummies. This model can be written as: yit = γyit −1 +β 1 Xi +β 2 Lnt +β 3 XiLnt +δZi , where yit is the local authority i’s level of mobility on date t, yit −1 is its lagged level, Xi reflects our cross-sectional variable of interest (‘Remain’ vote), Lnt reflects whether a lockdown ‘event’ has previously occurred (where each event is indexed n), XiLnt is the interaction of the local ‘Remain’ vote and these post-lockdown event indicators, and Zi is a matrix of other cross-sectionally varying variables (e.g. house prices and region). Model 2 adds dummies for each date vt , which means that the post-lockdown event variables (but not their interactions) drop out. Models 3 and 4 mirror Models 1 and 2 but add dummies for each location ui , meaning that Xi and Zi (but not their interactions) drop out.
Finally, in Models 5 and 6 we follow the generalised difference-in-difference model adopted by Durante et al. (Citation2021), who perform a similar analysis, examining the heterogeneous impact of different provincial levels of social capital on Italian’s social distancing. This model includes fixed effects for date, location, and the interaction of all the local-level variables with the lockdown-event indicators. These models can be written as: yit = γyit −1 +β(XiLnt )+δ(ZiLnt )+ui +vt , where Model 5 omits the date dummies vt .Footnote 6
We begin by discussing Model 1. The coefficient associated with ‘Remain’ alone reflects the period before March 16 whereas the interactions add the effects of ‘Remain’ after the partial lockdown and each ensuing breakpoint. We see, if anything, ‘Remain’ voting areas had slightly higher workplace activity, relative to baseline, before March 16. Once the lockdowns began this reversed sharply and ‘Remain’ areas had much lower levels of workplace activity. This divergence remained roughly steady after March 16 with later changes cancelling one another out.Footnote 7 Model 2 shows a very similar pattern once date fixed effects are included, albeit with somewhat smaller shifts.
In Models 3 and 4, which add location dummies, and thereby remove any direct cross-sectional relationship with workplace activity, we again see that the effects of lockdown on social distancing appear much larger in ‘Remain’ voting areas. Finally, Models 5 and 6 include all interactions with cross-sectional variables and the lockdown event dummies. Even in this most stringent specification – following Durante et al. (Citation2021) – we see the same pattern as before: a strong divergence between ‘Remain’ and ‘Leave’ voting areas after March 16th which accelerates further until the beginning of July. By that point we expect an area where the vote for ‘Remain’ was sixty percent to have between eleven and thirteen percent lower levels of workplace activity than an area where the ‘Remain’ vote was forty percent.
In the Online Appendix we examine a wide array of extensions to this analysis. We see very similar patterns when we conduct a similar statistical analysis on residential activity in Table A1. As expected residential activity rose in ‘Remain’ voting areas following the lockdown, remaining consistently high through the first wave. We also examine whether the level of COVID cases in each locality in the previous week affects our results in Figure A3. There is no evidence that including case rates alters our conclusions about political and economic differences shaping social distancing. There is some evidence that higher case rates led to more social distancing at the beginning of the first wave, though we should be careful in interpreting this data since testing sorely underestimated actual case rates in the UK’s first wave and there are good reasons to believe case rates are endogenous to social distancing in any case.
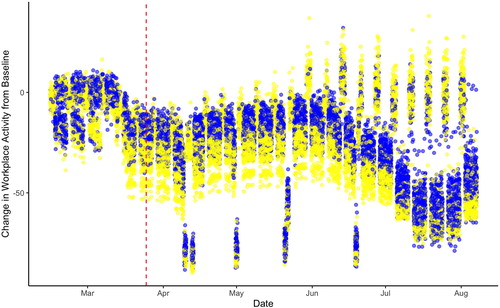
Figure 3. Swedish workplace activity and voting for the Sweden Democrats.
Note: Blue: Above SD Median; Yellow: Bellow SD Median.
Finally, we also examine whether the relationship between ‘Remain’ voting and social distancing differs across areas with different levels of income. One implication of our argument is that political ideology should matter more where people are better able to voluntarily make the decision to self-isolate or work from home, that is, in wealthier areas. In Table A2, we split our sample by median income per local authority and re-analyse Model 4 of . We find, consistent with expectations, that the relationship between ‘Remain’ voting and workplace activity following lockdown is stronger in those areas with higher incomes.
Table 2. Workplace activity in Sweden (no weekends).
Social distancing in Sweden and Denmark
We now turn to see if these patterns hold up in Sweden and Denmark. shows workplace activity over time, splitting the 271 Swedish municipalities into those with above-median support for the Sweden Democrats (blue) and those with below-median support (yellow). In contrast to Britain, the looser lockdown in Sweden meant that workplace activity only dropped around a third in March and remained at that level until the summer holidays began in late June. However, like the UK, we see a sharp difference across localities related to politics, with Sweden Democrat (SD) supporting areas having on average five percentage points higher levels of workplace activity.
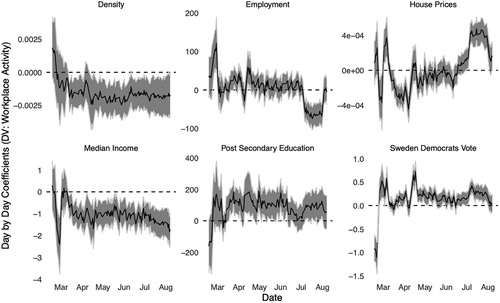
Again, we run a series of day-by-day multivariate regressions of workplace activity. shows the output of these 175 analyses. We see similarities with our analysis of the UK – higher density and richer areas had less workplace mobility from mid-March. House prices are negatively associated with activity for the first month after the spread of the virus but afterwards reverse. We also see that from mid-March through to the summer, on most days municipalities with higher voting for the Sweden Democrats had more workplace activity (i.e. less social distancing).Footnote 8
Figure 4. Day by day estimated coefficients with 95% confidence intervals for Swedish workplace mobility.
As for the UK we also analyse a difference-in-difference model for Sweden. As is well-known, the Swedish government engaged in limited regulation during the first wave and accordingly we have simply one lockdown event – March 25, when the government recommended workplaces to close and that people not leave their homes. In we examine workplace activity in Sweden across 175 municipalities. We use a measure of the proportion of votes received by the Sweden Democrats in that municipality in 2018, interacted with a post-lockdown indicator as before. We also control for lagged workplace activity, median income, employment rate, population density, percent with primary education, and local house prices.
Model 1 includes fixed effects by county, Model 2 adds date fixed effects, Model 3 interacts each municipality level variable with the post-lockdown indicator, and finally Model 4 includes municipality and date fixed effects along with all these interactions. Model 4 thus follows the same logic as the stringent D-i-D design used in Model 6 of and in Durante et al. (Citation2021).
Across all four models we see a strong positive relationship between local Swedish Democrat vote and workplace activity post lockdown. A municipality with twenty percent point higher voting for the Sweden Democrats is associated with a level of workplace activity post lockdown around four to six percent higher.Footnote 9
We see a similar story with Denmark. Here we include 94 municipalities and examine either support for the Danish Peoples Party (DPP) in 2019 (which averaged around nine percent) or support for the DPP and two minor right populist parties (Nye Borgerlige and Stram Kurs). We begin once more with the time series of workplace activity in , in which red dots denote municipalities with above average support for the DPP and grey those with below average support. As in the UK and Sweden we find that locations with more populist support appear to have had less workplace distancing, typically around seven percentage points more activity during April.
Figure 5. Danish workplace activity and voting for the Danish peoples.
Note: Party Red: Above DPP Median; Grey: Below DPP Median.
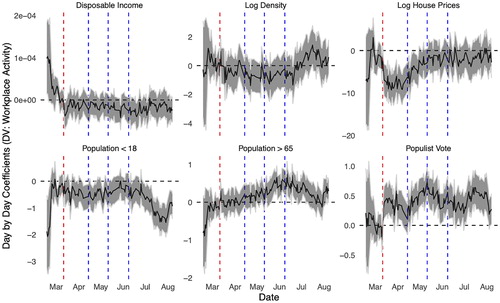
Examining day-by-day regressions in , we see similar patterns to the other cases.Footnote 10 Places with more expensive housing had less workplace activity though that effect weakens after Easter. Similarly, disposable income and density have the expected negative effects on workplace activity for most of the period. Finally, from the beginning of the lockdown in mid-March and onward we see a strong positive effect of support for populist parties on workplace activity, consistent with our findings in the British and Swedish cases.
Figure 6. Day by day estimated coefficients with 95% confidence intervals for Danish workplace mobility.
In , we test whether our results hold up when pooling the data and using the type of difference-indifferences models employed for the UK and Sweden. Model 1 is the simplest and includes region fixed effects and interactions between populist voting and the lockdown and reopening dates. We see that the effect of populist support is significantly stronger after the lockdown started on March 11 and that this effect slightly decreases as we move closer to the summer. Model 2 includes date fixed effect and our results are also robust to this specification. In model 3, we replace the region fixed effects with municipality fixed effects, thereby controlling for all time-consistent differences between Danish municipalities. The effect of populist voting remains, and this is also the case when adding date dummies in model 4. Model 5 is the most restrictive and, in addition to populist voting, interacts all of the control variables with the lockdown and reopening dates. In this very restrictive model, the effect of populism is attenuated, but it remains statistically significant.
Table 3. Workplace activity in Denmark (no weekends or national holidays).
In Online Appendix A, we show that the effect of populist voting is present in both high- and low-income municipalities, but somewhat stronger in the former, which is consistent with the UK results (Table A4). We also show that, as in the UK and Sweden, the results are robust to controlling for local COVID-19 cases (Table A5).
Table 4. Workplace activity in regions of Europe during the first wave of the COVID-19 pandemic.
We will now turn to explore at greater length how variation in lockdown strength and timing helps explain the relative importance of populism in explaining social distancing behaviour across Europe as a whole.
Social distancing in Europe
In order to enable a Europe-wide analysis, we match the Google mobility data with survey data on political attitudes from the European Social Surveys (ESS) and regional economic and demographic data from Eurostat, thereby obtaining a data set with information on 295 regions from the following 23 countries: Austria, Belgium, Bulgaria, Czech Republic, Denmark, Estonia, Finland, France, Germany, Greece, Hungary, Ireland, Italy, Lithuania, Netherlands, Norway, Poland, Portugal, Slovak Republic, Spain, Sweden, Switzerland, and the United Kingdom. In Germany and the UK, the level of aggregation is NUTS1 regions, whereas for the remaining countries, we have data at either the NUTS2 or NUTS3 level.
As our measure of political attitudes, we aim to capture the kinds of sentiments that were partly driving the Brexit vote and are partly driving voting for populist right parties in Denmark and Sweden. Research on the populist radical right, to which the Sweden Democrats, the DPP, and one of the biggest proponents of Brexit – UKIP – belong, has shown that these parties appeal to populist, nativist, and authoritarian sentiments (Mudde Citation2007). We treat populist radical right (PRR) sentiments as a latent construct, which we attempt to measure with an index that consists of 15 survey items, taken from rounds five through nine of the ESS. Seven items ask about trust in politicians, political parties and institutions and capture populist, anti-elitist sentiments. Another seven items related to immigration attitudes and Euroscepticism capture nativist sentiments, and the last item, which asks about support for LGBT rights, relates to conservative-authoritarian values. The index is constructed from answers of about 184,000 respondents and is highly internally consistent (Cronbach’s alpha = .88).
After constructing the index, we use multilevel regression and poststratification (MRP) to estimate regional levels of PRR sentiments. MRP has been described as the ‘gold standard for estimating constituency preferences from national surveys’ (Selb and Munzert Citation2011: 456) and shown to work well even when just a few basic predictors are included in the model (Lax and Phillips Citation2009). MRP has two stages. In the first stage, demographic and geographic information is used to predict individual survey responses using multilevel regression. At this stage, the political preferences of each demographic-geographic type of respondent are predicted. In the second stage, these predictions are poststratified (weighed) by the share of the demographic-geographic types in each region using census-like data. Our MRP model includes gender and age (grouped in six categories: 15–29, 30–39, 40–49, 50–59, 60–69, 70+) as demographic predictors and GDP per capita as a regional-level predictor.Footnote 11 We poststratify the first-stage predictions using regional data from Eurostat on the share of men and women in the different age categories.
In , we display regional variation in PRR sentiments and workplace activity during the first half of 2020. PRR sentiments have been mean centred and standardised, so that values above zero reflect stronger than average sentiments. Panel A displays considerable variation in PRR sentiments across Europe: The Nordic countries have the weakest PRR sentiments, while Southern and Eastern Europe have the strongest. Within countries, metropolitan areas tend to score lower on our sentiment index than more rural areas, and we also observe large regional differences between the former East and West Germany.
Figure 7. Populist radical right sentiments (A) and change in workplace activity during the COVID-19 pandemic (B) in regions of Europe.
Note: Regions and countries with missing data are marked with white.
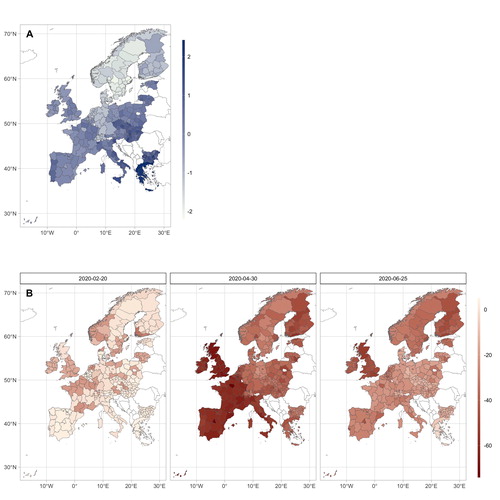
Panel B of shows a strong temporal variation in workplace activity across regions of Europe. In late February, workplace activity was just moderately lower than usual in most regions, but by the end of April activity levels had dropped far below the January/early February normal, especially in the hardest affected areas of Spain, France, Italy, and the United Kingdom. In the early summer, workplace activity was approaching normal, though still markedly below the typical levels.
In order to assess whether the results that we observe in the UK, Denmark and Sweden generalise to regions of Europe, we regress workplace activity on PRR sentiments and regional economic and demographic characteristics. We include population density and the shares of young (<30) and elderly (70<) citizens as demographic variables. Of economic variables, we include the occupational ratio (defined similarly to above), sector of employment, GDP per capita, and median house prices.Footnote 12
Because the level of aggregation is higher, and governments responded differently and at different times to the spread of COVID-19, the regression estimates of this comparative analysis are noisier than those of the country-specific analyses. As is commonly known, noisy estimates are biased downwards, which means that our estimates are on the conservative side, increasing the risk of committing type-II errors. To alleviate this concern, we analyse the data pooled for the entire period, and we account for heterogeneity across space and time with country (or region) and date fixed effects. To more directly model differences in lockdown regimes, we add controls for government responses using the data collected by Hale et al. (Citation2021). These scholars code government responses to the epidemic worldwide, but one limitation is that responses are coded by country, and not by region, so we are not able to capture area-specific restrictions on mobility within countries. This lack of regional data means that we are likely to underestimate the effect of government restrictions on mobility. Finally, we account for temporal dependence in mobility by including the activity level of the last seven days, and as in the country-specific analyses, we omit weekends and (national and regional) public holidays from the sample.
In , we analyse workplace mobility. Model 1 is a simple model that, besides lags of mobility, includes only PRR sentiments and dummies for government responses. The model shows that PRR sentiments are positively correlated with workplace activity across regions of Europe. The size of the effect suggests that a one standard deviation difference in PRR sentiments is associated with 1.3 percent higher workplace activity. The effect of government responses shows that compared to the early phase of the pandemic, when governments had taken no measures to stop the spread of the virus at workplaces, workplace mobility is markedly lower when the closing of workplaces or working from home is either recommended or required by the government. In the later phase, when some governments had lifted their recommendations/requirements to work from home, workplace mobility had increased but remained below the usual level of activity.
In Model 2, we test whether the baseline results hold up when accounting for economic and demographic differences across regions. When adding the economic and demographic variables, the effect of PRR sentiments is reduced to roughly one-third of the bivariate effect size but it remains statistically significant. The coefficients on the demographic variables suggest that regions with denser populations experienced greater drops in workplace activity, while the shares of the regional population over 70 and under 30 have no effect on workplace activity.
The economic variables generally perform as expected. A more professional workforce is associated with lower workplace activity. And although GDP per capita is imprecisely estimated in Model 2, the effect is negative and significant in the more elaborate Model 5, which includes interactions between political attitudes and government responses. Model 3 includes house price data for a subset of the sample.Footnote 13 Here we see that higher house prices are associated with less workplace activity. In Model 4, we include the proportion of the regional workforce employed in different sectors of the economy for another subset of the sample (regional sectoral employment data is unavailable for France and Switzerland). We see that higher rates of employment in finance, real estate, the liberal professions, and construction is associated with greater drops in workplace mobility, while regions with more people employed in the industry, wholesale, retail, transport, accommodation and food services experienced smaller drops. Importantly, while including measures of sectoral employment soaks up some of the effect of the occupational ratio, it does not alter the effect of PRR sentiments. Overall, these results corroborate the results of the country-specific analyses, suggesting that citizens of richer regions with a more professional workforce have faced fewer constraints in social distancing.
In Models 5 and 6, we interact PRR sentiments with government responses to the pandemic. Model 5 resembles our baseline Models 1–4 and includes country and date fixed effects. Model 6, by contrast, includes region and date fixed effects, and thereby mirror the difference-in-differences style models that we employ above. It also includes interactions between government responses and all of our economic and demographic variables.Footnote 14 The two models point to the same conclusion: the effect of populist sentiments is highly conditional on government responses to the pandemic.
In , we graphically illustrate the conditional effects calculated from the most restrictive Model 6. The figure shows that there is no effect of PRR sentiments in times and places where governments in at least part of their country required workplaces to close or citizens to work from home. By contrast, when governments gave citizens discretion in choosing whether to work from home or from the workplace, regions with stronger populist sentiments appeared less willing to social distance by refraining from going to work. Indeed, we only observe an effect of PRR sentiments in times and places where governments issued recommendations to work from home or lifted previous measures to contain the spread of the virus at workplaces. That we do not observe an effect of PRR sentiments when some sectors were required to close or some workers required to work from home raises our confidence that we are observing an effect of populist attitudes, and not some differences in occupational structures across regions that we are not capturing with the occupational controls.
Figure 8. Marginal Effect of PRR Sentiments on Workplace Activity, Conditional on Government Response to the COVID-19 Pandemic.
Note: The graph shows differences in the effect of populist sentiments and left–right ideology on workplace activity (with 95 percent confidence intervals) compared to the ‘pre-treatment’ effect from the period before March 27 when governments had taken no measures to limit workplace activity.
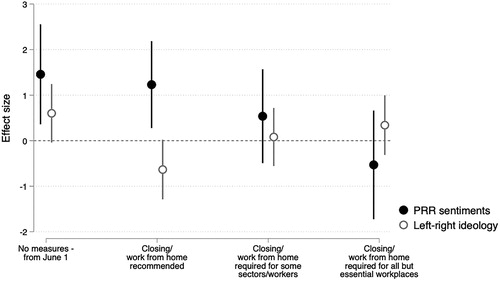
As a placebo test, we also plot the conditional effects of left–right ideology in .Footnote 15 The results of this test show that regardless of the lockdown regime, the effect of left–right ideology is never significantly different from the ‘pre-treatment’ effect from before European governments started imposing restrictions on workplace activity. These results suggest that the effects we observe for PRR sentiments capture something specific about how populism conditions compliance with social distancing measures, rather than some general feature of ideological orientation.
In Online Appendix A, we test whether the effect of PRR sentiments differs across regions with the differing levels of GDP per capita. As in the country-specific analyses, we find that the effect is present in both high and low-income regions, but here the effect seems somewhat stronger in regions with below-median levels of GDP per capita.
We also conduct an equivalent analysis to that of and using residential activity as the dependent variable (Tables A7 and A8 and Figure A6). The results for residential activity broadly mirror those for workplace activity. The effect of PRR sentiments is conditional on government responses and is only present after stay-at-home measures were lifted. In these cases, regions with stronger PRR sentiments appear to engage in less social distancing. As regards the other variables: population density, the share of citizens over 70, and housing wealth do not predict residential activity, while the share of citizens under 30, the share of professionals, and GDP per capita do. Once again, the results point to the importance of political and structural factors in explaining social distancing behaviour.
Conclusion
In this article, we have explored how populist sentiments and local economic and physical conditions affect adherence to the social distancing measures during the COVID-19 outbreak. We have found consistent evidence from the UK, Sweden and Denmark – as well as at the European regional level – that localities that predominantly support populist parties or movements were less likely to reduce their physical mobility during the pandemic. We also found that local wealth and population density increase social distancing.
These findings have important implications for understanding the varied patterns of compliance with COVID-19 measures. While existing work has successfully demonstrated that partisanship shapes behaviour during the epidemic, most of the empirical evidence comes from subnational analysis of a single country. By contrast we demonstrate that populism appears to explain behaviour across Europe as a whole. An additional contribution of this article is what it says about the role of wealth and other physical resources in individuals’ ability to safely stay at home during a public-health crisis. Recent studies have shed light on the political consequences of housing wealth inequality (Ansell Citation2014; Ansell and Adler Citation2019). Our results show that the effects of housing wealth extend beyond political choices or preferences over welfare policies, and impacts life and death decisions.
Finally, the analysis also contributes to a more general debate on the effect of populism on public health outcomes. Our findings can be generalised to identify the conditions under which governments fail to prevent the spread or the re-emergence of diseases. Scholars have noted a worrying reversal of public health trends in Europe in recent years, such as declines in life expectancy and decreases in vaccination rates, which they attribute to the political messages and policies disseminated by populist radical right parties that promote distrust in science (Rinaldi and Bekker Citation2020). One such example involves the relationship between anti-establishment politics and parents’ reluctance to vaccinate their children (Kennedy Citation2019). Given the importance of vaccination and other preventative measures on public health outcomes, understanding the underlying reasons for non-compliance has important policy implications.
Supplemental Material
Download PDF (1.2 MB)Acknowledgements
The paper has been presented at the annual meeting of the American Political Science Association (2020) and workshops at Aalborg University and the UK Home Office. We thank all attendees, particularly Andrea Campbell, along with Laure Bokozba and Jacob Nyrup, for valuable feedback and Robert Hickman for his code suggestions. We would also like to thank the editors of West European Politics and the anonymous reviewers for helpful comments and suggestions.
Disclosure statement
No potential conflict of interest was reported by the author(s).
Additional information
Funding
Notes on contributors
Ben Ansell
Ben Ansell is Professor of Comparative Democratic Institutions at the Department of Political Science and International Relations and Nuffield College, University of Oxford. His work covers a wide array of topics in political economy, including wealth, education, and democratisation. He is Principal Investigator of the European Research Council grant WEALTHPOL. [[email protected]]
Asli Cansunar
Asli Cansunar is a postdoctoral research fellow at the Department of Political Science and International Relations and Nuffield College, University of Oxford. Her work lies at the intersection of comparative political economy, comparative politics, and economic history, focussing on the political consequences of economic inequality. [[email protected]]
Mads Andreas Elkjaer
Mads Andreas Elkjaer is a postdoctoral research fellow at the Department of Political Science and International Relations and Nuffield College, University of Oxford. His research interests include political representation, inequality, and redistribution. [[email protected]]
Notes
1 The problems of sampling bias and self-report bias may be more important in terms of estimating levels of compliance rather than differences across heterogeneous groups, presuming that group differences do not themselves predict differences in self-reporting or being in the sample frame.
2 Residential activity is measured slightly differently from the other activities, which are measured in terms of absolute numbers of people in locations, relative to baseline. Residential is measured as the proportion of time people are in residences.
3 Unfortunately, in Denmark and Sweden, Copenhagen (with the exception of Frederiksberg) and Stockholm, count as single day by day observations.
4 It would be interesting to examine whether voting in the General Election of 2019 that shortly predated the COVID-19 epidemic is related to social distancing. Unfortunately, parliamentary constituencies and local authorities do not map clearly on to one another, complicating such an analysis.
5 We examine only weekdays given the large weekend effects we saw in .
6 To conserve space, we only report the interactions for Remain vote.
7 Figure A2 in the Online Appendix demonstrates the simulated levels of workplace activity using this model and shows how each lockdown event changes predictions. Although there is some evidence in of the gap between ‘Leave’ and ‘Remain’ areas narrowing after July, this is very moderate and likely an effect of summer holidays.
8 These results are robust to controlling for local COVID-19 cases – see Figure A4.
9 Table A3 shows mixed evidence for whether the relationship between Sweden Democrats voting and workplace activity is larger in wealthier locations – this pattern emerges in the less stringent models but disappears in the full D-i-D model.
10 In addition to the variables shown in , all models include region fixed effects and four measures of the share of people employed in different sectors of the economy: (1) financial services, real estate, and the liberal professions, (2) construction, (3) wholesale, retail, transport, hotels, and restaurants, (4) defence, police, fire, education, and health.
11 We would have liked to also include education in the model but this was not possible as there is no readily available data on the educational profiles of men and women of different ages by region, which we would need in the second stage.
12 We compile subnational housing prices using information from national statistical agencies and central banks. Where housing prices for 2020 are not available, we take data from the most recent year. In cases where national agencies report house prices for different types of residential buildings, we take house prices of single-family homes. Lastly, where prices per square meter are disseminated, we assume that a typical home is 90 square meters. Finally, we convert national currencies to Euros.
13 Regional house price data are available for Austria, Belgium, Bulgaria, Czech Republic, Denmark, Estonia, Finland, France, Hungary, Ireland, Norway, Portugal, Spain, Sweden, and the United Kingdom.
14 As we do not have data for the full sample on house prices and sectoral employment, we do not interact government responses with these variables.
15 Regional estimates of left–right ideology have been computed using a similar MRP model as for PRR sentiments. PRR sentiments and left–right ideology are uncorrelated (r = .02) across regions in our sample. The full set of results for left–right ideology is included in the Online Appendix.
References
- Adams-Prassl, Abi , Teodora Boneva , Marta Golin , and Christopher Rauh (2020). ‘Inequality in the Impact of the Coronavirus Shock: Evidence from Real Time Surveys’, Journal of Public Economics , 189, 104245.
- Adler, David , and Ben Ansell (2020). ‘Housing and Populism’, West European Politics , 43:2, 344–65.
- Ajzenman, Nicolas , Tiago Cavalcanti , and Daniel Da Mata (2020). ‘More than Words: Speech and Risky Behavior During a Pandemic’, IZA Discussion Paper No. 14229, available at: https://ssrn.com/abstract=3818639 (accessed April 29, 2021).
- Allcott, Hunt , Levi Boxell , Jacob Conway , Matthew Gentzkow , Michael Thaler , and David Y. Yang (2020). ‘Polarization and Public Health: Partisan Differences in Social Distancing during the Coronavirus Pandemic’, NBER Working Paper 26946, available at: http://www.nber.org/papers/w26946 (accessed April 29, 2021).
- Ansell, Ben (2014). ‘The Political Economy of Ownership: Housing Markets and the Welfare State’, American Political Science Review , 108:2, 383–402.
- Ansell, Ben , and David Adler (2019). ‘Brexit and the Politics of Housing in Britain’, The Political Quarterly , 90:S2, 105–16.
- Barbieri, Paolo , and Beatrice Bonini (2020). ‘Political orientation and adherence to social distancing during the COVID-19 pandemic in Italy,’ Economia Politica, 1–22.
- Bargain, Olivier , and Ulugbek Aminjonov (2020). ‘Trust and Compliance to Public Health Policies in Times of COVID-19’, Journal of Public Economics, 192, 104316.
- Barrios, John M. , and Yael Hochberg (2020). ‘Risk Perception through the Lens of Politics in the Time of the COVID-19 Pandemic’, NBER Working Paper 27008, available at: https://www.nber.org/papers/w27008 (accessed April 29, 2021).
- Bursztyn, Leonardo , Aakaash Rao , Christopher Roth , and David Yanagizawa-Drott (2020). ‘Misinformation During a Pandemic’, University of Chicago, Becker Friedman Institute for Economics Working Paper No. 2020-44, available at: https://ssrn.com/abstract=3580487 (accessed April 29, 2021).
- Carreras, Miguel , Yasemin Irepoglu Carreras , and Shaun Bowler (2019). ‘Long-Term Economic Distress, Cultural Backlash, and Support for Brexit’, Comparative Political Studies , 52:9, 1396–424.
- Durante, Ruben , Luigi Guiso , and Giorgio Gulino (2021). ‘Asocial Capital: Civic Culture and Social Distancing during COVID’, Journal of Public Economics , 194, 104342.
- Eberl, Jakob-Moritz , Robert A. Huber , and Esther Greussing (2020). ‘From Populism to the “Plandemic”: Why Populists Believe in COVID-19 Conspiracies’, SocArXiv, available at: https://osf.io/preprints/socarxiv/ejpw7 (accessed April 29, 2021).
- Fischer, Sean (2020). ‘Local News Availability does not Increase Pro-social Pandemic Response’, OSF Preprints, available at: https://osf.io/ysruw (accessed April 29, 2021).
- Gollwitzer, Anton , Cameron Martel , William J. Brady , Philip Parnamets , Isaac G. Freedman , Eric D. Knowles , and Jay J. Van Bavel . (2020). ‘Partisan Differences in Physical Distancing Are Linked to Health Outcomes during the COVID-19 Pandemic’, Nature Human Behaviour , 4:11, 1186–97.
- Hale, Thomas , Noam Angrist , Rafael Goldszmidt , Beatriz Kira , Anna Petherick , Toby Phillips , Samuel Webster , Emily Cameron-Blake , Laura Hallas , Saptarshi Majumdar , and Helen Tatlows . (2021). ‘A Global Panel Database of Pandemic Policies (Oxford COVID-19 Government Response Tracker)’, Nature Human Behaviour , 5, 529–538. https://doi.org/10.1038/s41562-021-01079-8.
- Haman, Michael (2020). ‘The Use of Twitter by State Leaders and Its Impact on the Public During the COVID-19 Pandemic’, Heliyon, 6:11, e05540, 1–9.
- Hawkins, Kirk A. , Ryan E. Carlin , Levente Littvay , and Cristóbal Rovira Kaltwasser (2018). The Ideational Approach to Populism: Concept, Theory, and Analysis . London: Routledge.
- Huber, Robert A. , Esther Greussing , and Jakob-Moritz Eberl (2020). ‘Populist Attitudes and Climate Scepticism: It’s all about Science and Political Institutions’, SocArXiv, available at: https://osf.io/preprints/socarxiv/m82kg (accessed April 29, 2021).
- Inglehart, Ronald F. , and Pippa Norris (2016). ‘Trump, Brexit, and the Rise of Populism: Economic Have-nots and Cultural Backlash’, HKS Faculty Research Working Paper Series RWP16-026, available at: https://www.hks.harvard.edu/publications/trump-brexit-and-rise-populism-economic-have-nots-and-cultural-backlash (accessed April 29, 2021).
- Kennedy, Jonathan (2019). ‘Populist Politics and Vaccine Hesitancy in Western Europe: An Analysis of National-Level Data’, European Journal of Public Health , 29:3, 512–6.
- Kushner Gadarian, Shana , Sara Wallace Goodman , and Thomas B. Pepinsky (2020). ‘Partisanship, Health Behavior, and Policy Attitudes in the Early Stages of the COVID-19 Pandemic’, unpublished paper.
- Lasco, Gideon , and Nicole Curato . (2019). ‘Medical Populism’, Social Science & Medicine , 221, 1–8.
- Lax, Jeffrey R. , and Justin H. Phillips . (2009). ‘How Should We Estimate Public Opinion in the States?’, American Journal of Political Science , 53:1, 107–21.
- Mudde, Cas (2007). Populist Radical Right Parties in Europe . Cambridge: Cambridge University Press.
- Müller, Jan-Werner (2017). What Is Populism? Philadelphia, PA: University of Pennsylvania Press.
- Painter, Marcus , and Tian Qiu (2020). ‘Political beliefs affect compliance with government mandates,’ Journal of Economic Behavior & Organization, 185, 688–701.
- Rinaldi, Chiara , and Marleen Bekker (2020). ‘A Scoping Review of Populist Radical Right Parties’ Influence on Welfare Policy and Its Implications for Population Health in Europe’, International Journal of Health Policy and Management , 10:3, 141–51.
- Selb, Peter , and Simon Munzert (2011). ‘Estimating Constituency Preferences from Sparse Survey Data Using Auxiliary Geographic Information’, Political Analysis , 19:4, 455–70.