
Abstract
The article explores why women are better represented in municipal councils in Norway than in Denmark. This comparative case study offers a most similar systems design, as these two countries are similar on most relevant institutional variables, such as local government systems, electoral systems, party systems and societal gender equality, but they deviate on the dependent variable of women’s representation. Two unique comparative data sets are analysed: representative voter surveys and register data on all candidates (from the 2019 Norwegian and 2017 Danish municipal elections). The study focuses on demand-side explanations and concludes that institutional explanations do not appear relevant. Instead, the parties’ candidate selection matters: Norwegian parties are more concerned with gender balance than their Danish counterparts. Finally, the article discusses why this is the case and asks whether gender equality plays a more prominent role on the societal agenda in Norway than in Denmark.
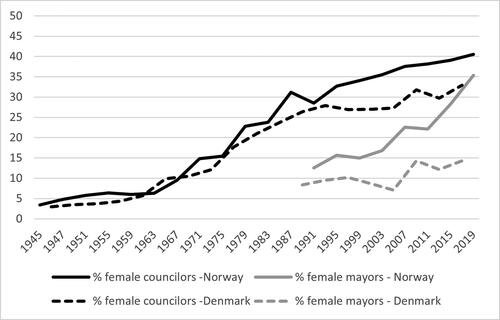
The puzzle of this article originates from a simple empirical observation: In the two neighbouring Scandinavian countries of Norway and Denmark – usually perceived as a pair of countries as similar as they get – the levels of female representation in local government deviate quite substantially. To put it more accurately – and making the situation even more puzzling – the two seemingly similar countries are now on different trajectories: While they used to perform similarly in terms of women in local elected office, they started to deviate some three decades ago. As shows, World War II onwards, the two countries followed almost the same trend in terms of percentage of female councillors, but today they differ with 40.5% women in Norwegian local councils (2019) and 32.9% women amongst Danish councillors (2017). The deviating trends are even more pronounced for mayoral offices. Since the early 1990s, women’s share of mayoral offices increased from 12.5% to 35.4% in Norway, whereas the corresponding increase in Denmark was only from 9.5% to 14.3%.Footnote1
Figure 1. Share of female councillors and mayors (1945–2019) (%), Denmark and Norway.
Source: Norway: Statistics Norway Statbank table 09494 and Berglund (Citation2005); Denmark: Statistics Denmark, Statistiske Efterretninger, various years, and Kjaer and Opstrup (Citation2018).
Why is this picture of women’s descriptive representation at the local level in two Scandinavian countries surprising? First, because the trend in Denmark does not fit into the general perception of women’s political representation being on a rise. Or to put it more specifically: While in some countries, the increase in women’s political representation can be slow in coming, it is generally believed that when the first hard step towards gender equality has been taken, the subsequent ones gradually become easier. This is the idea behind the recruitment reading of Dahlerup’s critical mass theory (Dahlerup Citation1988) – when some progress has been made, the finishing line for gender equality (whether this is 40%, 45% or 50%) will inevitably be crossed (Studlar and McAllister Citation2002: 238).
Second, it is surprising that the two countries – after walking together for a long time – have taken up different routes. The stagnation of female representativeness in Denmark is harder to understand when the Norwegian case clearly points out that the plateauing around 30–35% is no law of nature. Differences in female representation can also occur for historical reasons – such as the length of time since women were granted suffrage (Christmas-Best and Kjaer Citation2007; Rule Citation1987; Siaroff Citation2000) – but in this case the two countries were, again consulting , going through the first phases of increasing female representation at the same speed. Moreover, women were given the local suffrage almost at the same time – in Denmark in 1908 and in Norway in 1910. Finally, the two countries are generally perceived as similar regarding most societal characteristics, including most of the potential explanatory variables traditionally included in analyses of female representation. Although there are some differences between the two countries, these are minor when the two Scandinavian countries are included in broader international comparisons based on international databases under the auspices of, e.g. the OECD (Citation2021 – the Better Life Index) and the World Economic Forum (Citation2021 – the Global Gender Gap Index).
We are not only intellectually intrigued by these deviating trajectories within the ‘Scandinavian family’ of seemingly similar countries both perceived as belonging to the ‘Nordic gender equality model’ and frontrunners in terms of societal women friendliness and gender equality. We are also curious to learn why this deceleration of women’s inclusion in representative democratic institutions can be seen in this part of the world. Globally there is a discussion about where gender equality is stagnating and whether women’s rights in some countries are on a reverse, just as the concept of gender ideology itself has been challenged (Antić and Radačić Citation2020; Sanbonmatsu Citation2008). Some ‘gender fatigue’ – a reluctance to continuously having gender equality on the agenda – can be seen in realms such as business (Kelan Citation2009). Might politics be another?
The comparative case study of Norway and Denmark offers an almost perfect most similar systems design for investigating this question. The two countries are similar on most relevant institutional variables, but they deviate on the dependent variable of women’s representation. So, what explanatory variable can be found where the two otherwise similar countries differ? We focus on demand-side explanations (Norris and Lovenduski Citation1994) and investigate the impact of each of the two players on the demand side of the political recruitment process: the nominating political parties and the voters casting preferential votes. We evaluate the potential demand-side effects by analysing two unique comparative data sets: 1) data on all local candidates of the Norwegian 2019 municipal elections and the Danish 2017 municipal elections, and 2) data from large representative voter surveys in both countries carried out after these two elections.
In the next section, we outline different explanations to women’s descriptive representation, based on previous research. Then we present our two case countries regarding local government systems, electoral systems, party systems, and societal gender equality. After that, we use the unique empirical data from Norway and Denmark to look into a number of the ‘usual suspects’ explanations based on the institutional set-up. But we also visit alternative explanations dealing with different attitudes and actions from the political parties and the voters, respectively. In the final discussion, we will return to the ‘gender fatigue’ discussion and elaborate on more general lessons to be drawn from the Scandinavian cases: To what extent can tools from the ‘electoral engineering’ (Norris Citation1996) toolkit be of use in closing the gender gap in politics, and to what extent should more social engineering be called for?
Explaining women’s descriptive representation
Many explanations have been put forward to explain why women’s descriptive representation varies across polities. For instance, Christmas-Best and Kjaer (Citation2007) list ten different explanations. We have already mentioned one: the time since women as a group were granted suffrage. Their list also includes cultural explanations such as religion and societal gender roles, socio-economic explanations related to welfare state regime such as women’s involvement in the labour market and the educational system, and institutional explanations such as electoral system and the strength of the political left-wing vote. Inglehart and Norris (Citation2003) describe the same groups of variables in terms of barriers for women to enter and gain equal representation. Many studies have empirically tested these explanations on datasets comprising a large number of countries (e.g. Siaroff Citation2000; Thames and Williams Citation2013). A rough review of the findings from these analyses would conclude that protestant religion, women’s share of the labour force and the use of proportional representation (PR) electoral systems are the most consistent determinants of high percentages of female parliamentarians, representing each of the three groups. However, these explanations will not help us in our case. As already stated, we have a most similar systems design, and Norway and Denmark are both protestant countries with high female labour force participation and PR electoral systems.
However, looking for differences between Norway and Denmark that can explain the different outcome of the local political recruitment processes, we will change the level of the search. It should be recalled that the level of women’s representation in the two countries are the aggregates of the level of female representation in each of the municipalities within the countries – which, in turn, are the aggregates of the party groups within the municipal council. And before looking for differences between the countries at the country level, it should be investigated if there are differences between the municipalities and the parties in the two countries. If women’s representation varies between different types of municipalities and different types of parties, and if the municipal structures and/or the party systems of the two countries are different, then this will explain the observed differences in the aggregate. Is the difference in women’s representation a result of the aggregation, i.e. a kind of compositional effect?
Let us take the most used explanatory variable in studies of local governments as an example: the size of the municipality (measured as number of inhabitants). If more women are elected in larger municipalities than in smaller (as claimed by e.g. Smith et al. Citation2012; Trounstine and Valdini Citation2008), the aggregate of women’s representation will be larger in countries with relatively larger municipalities than in countries with relatively smaller municipalities, even though the percentage of women in the council is identical when municipalities of the same size are compared across the two countries. Therefore, before looking into potential explanations at the national level, variables where the composition of the municipalities varies should be examined to rule out mere compositional explanations. Several studies have identified the variables affecting the representation of women across municipalities within the same country (Bullock and MacManus Citation1991; Crowder-Meyer et al. Citation2015; Holman Citation2017; Kjaer and Matland Citation2014). We will especially learn from three studies – one on Scandinavia and two on the US – which have each analysed several different municipal variables. In the US, a study by Smith et al. (Citation2012) points to population size and ideology, while Kjaer et al. (Citation2018) point to the number of seats in the legislature. On Scandinavian data, Kjaer and Matland (Citation2014) point to population density and seats won by the left.
Since the number of inhabitants, the population density, and the number of seats at the council correlate very highly within both countries, we will proceed only with municipal size. By using municipal size, we indirectly account for other relevant factors as municipal size is often considered as a proxy for other institutional factors – e.g. urbanisation, labour market participation and education opportunities – that are relevant for local gender representation (Segaard and Saglie Citation2021).
We also include the composition of political parties. The party level is important in recruitment processes, and party ideology has again and again been demonstrated to affect women’s representation. The potential positive effect of left-wing parties is well known from analyses at the national level (e.g. Pedersen Citation2000). Again, our selection of explanatory variables is based on a usual suspects approach. However, it should be noticed that some variables with well-proven effects, the distinction between PR and majoritarian electoral systems being the most noticeable, have been left out since both Norway and Denmark use PR.
Taking these compositional effects into account is one thing, but to close in on more cultural aspects, the demand side from the traditional supply/demand model can be scrutinised further (Norris and Lovenduski Citation1994). The nomination and electoral phase of a gendered political recruitment process are often seen as a kind of blame game (Kjaer and Krook Citation2019). Here the question is whether, on the one hand, candidate selection within local party branches, or, on the other hand, voter behaviour (i.e. preferential votes) and voter attitudes to gender representation can explain gender imbalance in local councils (Segaard and Saglie Citation2021). Including attitudinal and behavioural factors related to these actors makes it possible to investigate the combined impact of actors and institutional factors in a given cultural context. Indeed, attitudes and behaviour may contribute to explaining the difference between Norway and Denmark as they may reflect social norms and values related to gender equality, both generally and in politics. Again, the two countries might deviate.
We now present the two case countries and our data and method, before we turn to the empirical analyses.
Norway and Denmark – two similar case countries
As pointed out already, our puzzle is why Denmark and Norway differ on our dependent variable – gender balance in municipal councils – when the two countries are generally perceived as being very similar regarding most societal characteristics explaining female representation. In this section, we comment on Danish–Norwegian similarities and differences with regard to: (a) local government systems, (b) electoral systems, (c) party systems and (d) societal gender equality.
The local government institutional framework is largely similar in the two countries, but with some variations (Baldersheim et al. Citation2017). In both countries, the municipalities are ‘local welfare states’, responsible for implementing many national welfare policies and providing public services. In both countries, the municipal council is elected by the voters, and the mayor and the executive committee is elected by and amongst the councillors. However, the number and sizes of municipalities varies between the two countries. Even though the total population size is quite similar, Denmark has 98 municipalities while Norway has 356. Both countries have recently gone through a large-scale municipal amalgamation reform. The Danish reform was implemented from above, whereas the Norwegian counterpart relied more on voluntary local decisions – leaving many small municipalities unmerged. While only seven of the 98 Danish municipalities have less than 20,000 inhabitants, two-thirds of the Norwegian municipalities have less than 10,000, with a median size of 42,989 (Denmark) and 5163 inhabitants (Norway) as of 1 January 2020 (Saglie and Segaard Citation2022). Moreover, even though population size and number of council seats are strongly linked within both countries, this is not the case across countries. Municipalities with a similar population size tend to have more council seats in Norway than in Denmark.
The electoral systems are also basically similar, even though the details differ (see Kjaer Citation2022; Saglie and Segaard Citation2022). Both Denmark and Norway use open-list PR for municipal elections, using the entire municipality as one electoral district. In Denmark, voters can choose to vote for a party/list or cast a preferential vote for a candidate. If the party has chosen an open-list format (which 72% did at the 2017 elections), those candidates with the most preferential votes get the seats obtained by the party. If the party has chosen a semi-open system,Footnote2 both preferential votes and the ranking on the list matter for the distribution of seats within the party. In the Norwegian case, voters can vote for a party/list and cast preferential votes for an unlimited number of candidates on this list, as well as a limited number of candidates on other lists. There is also a closed element in the Norwegian system: Parties can prioritise a limited number of candidates at the top of their lists, and these prioritised candidates get a substantial head start in the intra-party distribution of seats.
Moreover, the party systems are similar. Nine parties were represented in the Norwegian parliament after the 2017 election, and ten parties in the Danish parliament after the 2019 election.Footnote3 Both countries started out with the ‘Nordic five-party model’, comprising a Conservative, a Liberal, an Agrarian, a Social Democratic and a Communist party (Knutsen Citation2017). One early deviation is that agrarian interests were represented by the Liberals in Denmark – giving the country two liberal parties. In both countries, this early model has been supplemented with a Christian Democratic Party and a right-wing populist party, while the communists have been replaced by two left-wing parties. Norway has a Green party, while the Alternative Party plays a somewhat similar role in Danish politics. These national parties also dominate municipal politics in both countries, but local non-partisan lists are also present in several Norwegian and Danish municipalities.
Finally, regarding societal gender equality, the Nordic countries, including Denmark and Norway, are usually ranked at the top of various international indexes measuring gender equality. This is sometimes described as a Nordic model of gender equality, combining high levels of participation in political life and in paid work (Teigen and Skjeie Citation2017). Teigen and Skjeie found that compared with other European countries, the Nordic distinctiveness was more prominent in the democratic than in the economic realm. Even though all Nordic countries stand out with a high share of women in politics, Teigen and Skjeie (Citation2017) identify some differences in policies to promote democratic parity. Neither of the countries have included gender quotas in their electoral laws, but Norway introduced gender quotas for committees elected by the municipal councils – including the executive committee (formannskap) – in the 1992 Local Government Act. Norway has also introduced gender quotas in the economic sphere, for boards of public limited companies. Moreover, gender balance of committees and boards appointed by public bodies is also regulated in Norway. Denmark is a different case in this respect; the legislation regarding boards and committees uses the softest version of quotas, recommending organisations to strive for gender-equal representation when appointing boards and commissions (CitationGender Equality Act 2021). Moreover, political standing committees at municipal level – including the powerful Finance Committee (økonomiudvalg) – are explicitly excluded from these recommendations (Beskaeftigelsesministeriet Citation2021).
Norwegian authorities have also funded several research projects and campaigns to promote gender balance in municipal councils (Halsaa Citation2019). Furthermore, five of the seven largest parties in Norway have voluntarily adopted some form of gender quotas on their electoral lists. In contrast, a few Danish parties, experimenting very briefly with internal quotas, quickly abolished them again in the 1990s (Teigen and Skjeie Citation2017: 142). In this respect, the notion of a common Nordic model is less distinct.Footnote4
Data and method
We use data on both candidates and voters.Footnote5 As for candidate data, we analyse complete datasets for all candidates of the 2019 Norwegian municipal elections and the 2017 Danish municipal elections, produced by Statistics Norway and Statistics Denmark, respectively. These data are used to analyse characteristics of all the municipal election candidates and see the extent to which female candidates are punished or rewarded by preferential votes. The data include information about gender, age, position on the ballot, political party, elected/not elected, municipality, municipal sizes, and the number of elected candidates from the party. A total of 54,256 candidates – 42.9% females and 57.1% males – from the 356 municipalities in Norway were included in the database (where 9336 [17.2%]) were elected), and 9556 candidates – 31.8% female and 68.2% male – from the 98 municipalities in Denmark (where 2432 [25.4%] were elected).
In order to investigate voter attitudes, we use data from the Norwegian Local Election Studies (NLES), carried out by Statistics Norway, immediately after the local elections held 9 September 2019, and the Danish Local Election Survey (DLES) carried out by Gallup Denmark right after the local elections of 21 November 2017. The Norwegian survey was based on a representative sample of 10,000 registered voters drawn from the national registry (overall response rate was 41.2%). This was a disproportionally stratified sample, where citizens of small municipalities were overrepresented. This enables us to study how local democracy works also in the smallest municipalities. The survey used a mixed design with both telephone interviews and a web-based questionnaire. The Danish survey was quite similar to this, with 19,058 invited and 5386 answering the full questionnaire (response rate = 28.3%).
To ensure comparable data, the surveys included almost identical batteries of questions about attitudes towards different types of representation and reasons for casting a personal vote, respectively.Footnote6 The Danish and Norwegian languages are very similar, which makes ensuring comparability easier. However, some minor differences in wording of the battery about reasons for preference voting were necessary due to other considerations.Footnote7 In general, these differences are less important for our research question. The survey questions on gender are identical, and the other items are only used to place the importance of gender representation in a wider context.
Analysis
To throw light on possible explanations for the difference in the gender composition of Norwegian and Danish municipal councils, we start by exploring the effect of municipal size. As already mentioned, the size of the municipalities not only varies between the countries but also has been the usual suspect in most analyses of local representative democracy over the past decades. Therefore, municipal size in terms of number of inhabitants may be an explanation of the difference in gender composition between the two countries.
In , we see how the share of women in municipal councils varied by municipal size. Owing to the large number of small municipalities in Norway, we use a more fine-grained classification in the first row, whereas the categories of Norwegian municipalities with less than 20,000 inhabitants are merged in the lower part of the table, to facilitate comparison with Denmark. clearly demonstrates that this institutional difference – the differences in municipal size between Norway and Denmark – cannot explain the difference in gender composition observed in the two countries: Across all size categories, we find the same pattern, namely the share of women being higher in Norway than in Denmark. Moreover, even the smallest Norwegian municipalities had more women in their councils than the largest category of Danish municipalities (40.6% compared to 37.3%).
Table 1. Per cent women amongst elected councillors, by municipal size (population), Denmark 2017 and Norway 2019.
In general, one would expect a positive effect of size on gender balance. This was indeed the main trend in Norway, but not in Denmark. In fact, the share of women was higher in the smallest Danish municipalities (10,001–20,000) than in the two middle-size categories (20,001–50,000/50,001–100,000). The difference between large and small municipalities in Norway is not very strong, but it gives us reason to believe that the share of female councillors could have been even higher in Norway, if Norwegian municipalities had been as large as the Danish.
As described above, when we compare municipalities of similar size, Danish municipal councils have fewer seats than their Norwegian counterparts. However, this cannot explain the findings in . When we replace municipal size with council size, we still find a more even gender balance in Norway – within all size categories.Footnote8
Another institutional explanation may be related to party system differences. As already pointed out, right-wing parties (and their voters) are in general less focussed on gender balance compared to parties both to the left and in the centre. This is manifested in the share of female candidates. shows the share of female municipal councillors from the political parties represented in the national parliaments and sorted along the left–right dimension. The table clearly shows that the differences in local gender balance did not originate from party system differences: All the Norwegian political parties, except the Progress Party and the Green Party, had a larger share of female local councillors than their corresponding parties in Denmark.
Table 2. Per cent women amongst elected candidates, by party, Denmark 2017 and Norway 2019.
The share of women corresponds with what is expected in both Norway and Denmark, as the right-wing parties in general had the fewest female elected candidates. While the female share of local councillors in both countries can be understood in light of the ideological left–right dimension, the party systems cannot explain the difference between the two countries. This indicates that something country specific influenced the gender balance of all the parties independently of political ideology. But what? It may be features of the electoral system and/or the behaviour of both the parties and the voters.
As described earlier, both countries use open-list electoral systems with some modifications, giving both parties and voters influence over the intra-party distribution of seats. The alternative to such an open-list system is a closed-list system in which voters cannot alter the ranking of the candidates made by the political parties. Since we have information on both the ranking of the candidates made by the parties in the nomination phase of the recruitment process, and the ranking of candidates made by the voters through their preferential votes in the electoral phase, we can evaluate how the parties and the voters, respectively, prioritised candidates of the two sexes – and thereby evaluate the effect of the open-list ballot structure (see also Kjaer and Krook Citation2019; Segaard and Saglie Citation2021). describes both the priorities of the parties and the impact of voter preferences in Norway and Denmark. Party priorities are measured by female representation in a hypothetical, closed-list system. The influence of the voters is seen in the difference between the hypothetical, closed-list outcome, and the actual outcome. A positive difference means that the female candidates in general benefitted from preference voting.
Table 3. Per cent women amongst elected candidates, by ballot structure, Denmark 2017 and Norway 2019.
The analysis in demonstrates that Norwegian parties nominated many more women in the positions on the lists which would lead to a seat, compared with their Danish counterparts: Was it only for the parties to decide, there would have been 44.6% women in Norwegian councils compared to a mere 31.4% in Denmark.
also shows that the consequences of preference voting for local female representation were the opposite in Norway and Denmark: Whereas the Norwegian female candidates suffered from preference votes, Danish female candidates benefitted from them. There would have been 4.1 percentage points more women on Norwegian councils and 1.5 percentage points less on Danish councils if the election had been held under a closed-list system. It may therefore be tempting to interpret this as discrimination against women by the Norwegian voters whereas the Danish voters support them. However, one should have in mind that the point of departure for the voters was, as demonstrated, very different.
In sum, points out that the behaviour of the political parties as well as the voters differed between Norway and Denmark: Norwegian parties clearly prioritised gender balance higher than their Danish counterparts. Voters also behave differently, but in a way that reduced the difference between the two countries. Both the Norwegian positive discrimination and the Danish negative discrimination of women by the political parties were, to some extent, counteracted by the voters. That is also to conclude that the electoral system as an institutional factor is not a valid explanation for why local female representation is higher in Norway than in Denmark. However, the parties’ demand for female candidates clearly varies.
With the general effect of preferential voting in mind (), we do some more detailed analyses in by exploring the extent to which the gendered effect of open-list system was similar in all political parties. With a few exceptions, the share of female elected candidates in all political parties was affected by preference votes. Most Danish and Norwegian parties reflected the general trend found in : In seven of the nine Norwegian parties, the female share decreased as a consequence of preferential voting, whereas the share increased in seven of the nine Danish parties. That indicates that the general effect of the open-list system at national level as shown in cannot be ascribed to one or a few parties, but it reflects a national factor that influenced all the parties in the country in almost the same way. Preference voting had an almost uniform impact in both countries, but with opposite signs.Footnote9 Nevertheless, also shows some nuances: These opposite effects in Denmark and Norway were less clear amongst left-wing parties compared to other parties.
Table 4. Per cent women amongst elected candidates, by party and ballot structure, Denmark 2017 and Norway 2019.
So far, the analyses show that institutional factors such as municipal size, party system and electoral system cannot explain the empirical fact that the share of female local councillors is higher in Norway than in Denmark. We therefore turn to survey data to explore the attitudes of voters and reasons for preferential voting, as these factors – directly or indirectly through the electoral system – may influence the gender balance in the councils.
We start by looking at how important Norwegian and Danish voters thought representativeness in local councils was. Our main focus is gender representation, but to understand how important voters considered this kind of representation, we compare attitudes to gender representation with attitudes to age and geographic representation.Footnote10 clearly shows that Norwegian and Danish voters think alike regarding how important geographic representation is. Even though municipalities are geographically larger in Norway than in Denmark, geographical conflicts within municipalities seemed to be ubiquitous. This kind of representation seems to be the most important, compared to representation based on age and gender. More than 70% of the voters in both countries agreed that geographic representation, i.e. representation of sub-municipal areas, was important.
Figure 2. Per cent who agreed or disagreed that different types of representation are important, Denmark 2017 and Norway 2019.
Notes: Questions asked: ‘It is important that the municipal politicians come from different geographical parts of the municipality; It is important that the age distribution in the municipal council is roughly the same as among the voters; It is important that the distribution of men and women among the local politicians is similar to the distribution among the voters.
Minimum N: Denmark = 5100, Norway = 3703.
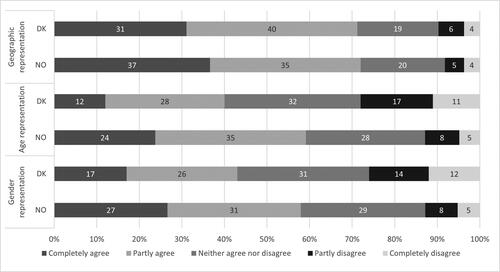
Both amongst Danish and Norwegian voters, age and gender representation in the local council were considered as more or less equally important, but less important than geographic representation. However, Norwegians found these two kinds of sociodemographic representation more important than Danes did. Indeed, slightly more than one-quarter of the Danish voters disagreed with the statements, compared to 13% of the Norwegians. The groups of neutrals (neither agree nor disagree) were about equally large in the two countries, but the share who agreed was lower in Denmark than in Norway (40–43% and 57–58%, respectively).
In we nuance this general picture by exploring how attitudes to representation vary by the gender of the voters. The overall pattern in is very similar in Norway and Denmark regarding the significance of gender for views on the two types of sociodemographic representation – gender and age. In both countries, but particularly in Denmark, women considered these representation types considerably more important than men do. Views on representation were gendered, but Norwegian men and women were more alike in their attitudes than Danish men and women (according to the differences in percentage points). It is not surprising that women were more concerned with gender equality than men were. However, the fact that the same difference is found about age representativeness suggests that the gender difference in attitudes to sociodemographic representativeness is a more general feature. A similar – but weaker – difference was found for geographic representativeness.
Table 5. Per cent who totally or partly agreed that different types of representation are important, by gender, Denmark 2017 and Norway 2019.
In short, Norwegian voters had more positive attitudes to sociodemographic representativeness, including gender representation, than the Danes. This may contribute to explain the difference in gender representation in Norwegian and Danish municipalities. However, this presupposes attitudes manifested in action to have actual impact, which is indeed not always the case (Ajzen and Fishbein Citation1977). For this, we investigate further the survey data. Here, voters who cast a preferential vote were asked how important various candidate characteristics – including gender – were for their vote ().
Figure 3. Per cent who stated that a reason was of great importance/played a large role for the preferential vote, Denmark 2017 and Norway 2019.
Notes: Questions asked: Denmark: ‘How important were the following reasons when you chose to vote for this specific candidate? No importance; Some importance; Great importance; Don’t know’. Norway: ‘There may be many reasons for casting preferential votes. What role did the following reasons play for your preferential vote at the municipal election? Played a large role; Played some role; Played no role’.
Minimum N: Denmark = 3275, Norway = 1567.
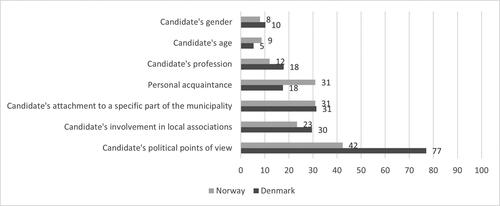
shows that one particular reason for casting a preferential vote seemed to be the far most important in both countries: the political views of the candidate. The analysis thus confirms that policy preference and positions are significant factors for voter behaviour (von Schoultz and Papageorgiou Citation2021). Although it was important in both countries, it seems to be far more important for Danes. Conversely, it seems reasonable that personal acquaintance was more important for voters in Norway, with its many small municipalities. However, we cannot say for certain whether these differences are caused by different question wordings (see note 7) or reflect substantial differences between the countries.
Our main focus, however, is on gender. clearly shows that the candidate’s gender was not an important reason for most voters who cast a preference vote, neither in Denmark nor in Norway. Only 8% in Norway and 10% in Denmark said that gender played a large role for their preference vote. These shares are low compared to the other reasons listed in the figure, except the candidate’s age and, to some extent, profession. However, it is noteworthy and perhaps surprising, considering , that slightly more Danes than Norwegians mentioned that the candidate’s gender played a large role. This difference is statistically significant at the .01-level.
The same pattern is found for both female and male voters (see ), but only the difference between Danish and Norwegian women is statistically significant. Moreover, in both countries, it was – unsurprisingly – women who stressed the candidate’s gender most as a reason for their preference vote.
Table 6. Per cent who stated that a reason was of great importance/played a large role for the preferential vote, by gender, Denmark 2017 and Norway 2019.
Discussion and conclusions
Based on our analyses, we can conclude that structural explanations related to municipal structure, the electoral system and party system do not appear relevant to explain the different levels of women’s representation in Norwegian and Danish local politics. Instead, we conclude that the parties’ candidate selection matters. Norwegian parties prioritised gender balance higher than the Danish ones. This difference was to some extent reduced by the voters. Norwegian voters seem to be most concerned about gender representation as a principle. Nevertheless, the candidate’s gender was less important for Norwegian voters than for Danish voters when they cast a preference vote, and Norwegian female candidates – unlike the Danish – suffered from the effects of preferential voting. The explanation may be that Norwegian voters – unlike the Danish – thought that gender balance already had been taken care of by the parties.
But this answer just raises a new question: Why are Norwegian parties more concerned with gender balance than their Danish counterparts? The answer may touch upon a more fundamental factor that is difficult to catch without having a broader perspective in mind and search for ‘invisible’, but important differences between two countries that in most cases are considered very similar. We believe that there is a pronounced difference between the two countries, regarding the role of gender equality on the political agenda and in the public debate. This is also reflected in the practice of the political parties, including their use of gender quotas.
Active measures to promote gender balance can be said to have achieved ‘taken-for-grantedness’ in Norwegian politics (Inhetveen Citation1999), whereas the opposite seems to be the case in Denmark, where promotion of quota schemes presently is almost non-existing. Quotas can, on the one hand, have an impact beyond the number of elected women. By using quotas, both women and men will be more visible and will get political experience, which is a key factor for a political career. Moreover, over time, quotas (or their absence) may have an impact on voter attitudes and behaviour. On the other hand, we cannot assume a causal impact of quotas. Such institutional rules reflect what is considered as appropriate norms and values in a society, and these norms may be a prior variable that influences both legislation and practice. In any case, rules of gender balance for municipal committees were first implemented in Norwegian legislation during the early 1990s, which coincides with the ‘take-off’ for the different trends in Danish and Norwegian gender representation at local level (). In similar Danish legislation, an explicit exception was made for such municipal committees.
Other studies have pointed at supply-side factors – the willingness to run for office – as a cause of the under-representation of women, also in Danish politics (Dahl and Nyrup Citation2021). We have not included supply-side factors in this study since we lack comparable data. Supply-side factors can certainly be important, but our comparative perspective highlights that they can be counteracted by the demand side. Even though women may be less willing to be candidates for local office, a political culture that emphasises gender equality and is institutionalised by the political parties through formal or informal gender quotas, may encourage (or even pressure) women to run for office.
In sum, the institutional explanations are not convincing, and therefore, we should probably look to more attitudinal explanations reflecting profound social norms and values (some would say political culture). The more insistent Norwegian parties, not being satisfied with a not-so-gender-equal representation at the local councils, might fight more to change the status quo than the less insistent – and sometimes maybe indifferent – Danish parties that tend to be quite satisfied with the situation. In the introduction we mentioned the phenomena of gender fatigue, which might be something Danish parties can relate more to than their Norwegian counterparts. The Danes might see equal gender representation in politics as a ‘closed case’ (Dahlerup Citation2018) where they have reached a point of saturation before they reached equal political representation (Kjaer Citation1999). And therefore, the fight for more women in local politics has been called off before gender equality has been reached. Further measures to support women in local politics might almost be a taboo in the debate – while in Norway the situation is opposite as gender equality has been an issue for decades, institutionalised as a norm in the public debate and in the continuous work of the authorities. We need more research on such differences, but if this mechanism has any truth to it, promoters of gender equality in local politics should reduce their sometimes almost obsessive focus on changing the institutional factors (performing electoral engineering) and start focussing on the political culture and performing social engineering (such as mainstreaming gender equality in a multitude of societal realms) instead. This not only applies to the country lagging behind in the comparison made in this article – Denmark – but also for other countries beyond the Scandinavian context dealing with low female representation in local politics. It is tempting to look for a quick fix and call in the electoral engineers to come up with an instrument. However, the Danish case demonstrates that it is not just a matter of changing electoral systems – patience and the long (cultural) haul may be needed as seen in neighbouring Norway. In this process, political parties seem to be the key, and the Norwegian case illustrates how the parties as intermediates sometimes mix institutional and cultural instruments: The voluntary party quotas introduced by most of the Norwegian parties shows how the continuous focus on gender equality and the political culture in which it is embedded, can also facilitate applications of an instrument from the electoral engineers’ toolbox.
Geolocation information
Denmark and Norway.
Acknowledgements
Previous versions of this article were presented at the IPSA World Congress of Political Science, 10–15 July, 2021, and the Nordic Political Science Association Congress, 10–13 August, 2021. We would like to thank Hilmar Rommetvedt, the panel participants and the reviewers for their valuable comments.
Disclosure statement
No potential conflict of interest was reported by the authors.
Data availability statement
The Norwegian data sets are available at Statistics Norway and Sikt – Norwegian Agency for Shared Services in Education and Research. The Danish data sets are available at Statistics Denmark and the Danish National Archives.
Additional information
Funding
Notes on contributors
Signe Bock Segaard
Signe Bock Segaard is Senior Research Fellow at the Institute for Social Research, Oslo, Norway. Her research focuses on local democracy, election, representation and voter behaviour, and has appeared in journals such as International Political Science Review, Local Government Studies and Journal of Elections, Public Opinion & Parties. She is currently – together with Jo Saglie – the project leader for the Norwegian Local Election Studies of 2019 and 2023. [[email protected]]
Ulrik Kjaer
Ulrik Kjaer is Professor at the Department of Political Science at University of Southern Denmark, Odense, Denmark. His research interests include local democracy, mayoral leadership and local elections. He has published in European Journal of Political Research, Local Government Studies, and Journal of Legislative Studies, amongst others. [[email protected]]
Jo Saglie
Jo Saglie is Research Professor at the Institute for Social Research, Oslo, Norway. His research interests include party organisations, local elections and local democracy, and the politics and representation of indigenous peoples. He is currently directing the Norwegian Local Election Study (with Signe Bock Segaard) and the Norwegian Sámi Parliament Election Study. [[email protected]]
Notes
1 Local elections were held in Denmark on 16 November 2021. Even though the official electoral statistics were not published at the time of writing, women’s representation has increased slightly. The share of women after the 2021 election is 36% amongst the councillors and 20% among the mayors. We use data from the 2017 elections in our analyses since data for 2021 were not available from Statistics Denmark at the time of writing.
2 Some parties, almost exclusively on the left wing, use this option, although the electoral consequences are minor: less than 2% of elected candidates were elected because they ran on a semi-open list and were helped by their ranking by the party.
3 Excluding the representatives from the autonomous territories of Greenland and the Faroe Islands, the municipalities of these territories are not included in the analysis.
4 However, one similarity between the countries is that harassment and hate speech directed towards local councillors in general, and gendered harassment and hate speech in particular, is on the political agenda in both countries. We lack comparative studies of harassment and policies against it, but we have no reason to believe that gender differences regarding harassment vary between the two countries.
5 Research carried out in this study has been assessed and approved by the NSD (Norwegian centre for research data; approval number: 849562) and the University of Southern Denmark Research & Innovation Organisation (approval number: 10.074), respectively, with regard to privacy and protection of participants. The survey respondents have received written information about the project before consenting to participate.
6 For further information about and analyses of the Norwegian data, see Segaard and Rommetvedt (Citation2021).
7 There are substantial differences in question wordings in three cases. (1) The candidate’s profession. The Danish wording, ‘the candidate’s background (education, work)’, is somewhat broader than the Norwegian one, ‘the candidate’s occupational background’. However, since profession is often associated with a person’s education and work, both questions measure the same basic concept. (2) The candidate’s attachment to a specific part of the municipality. This is the Norwegian wording. This will most likely refer to the voter’s own part of the municipality, even though this is not explicitly specified in the Norwegian survey, unlike the Danish where the Danish wording is ‘The candidate comes from my part of the municipality’. (3) The candidate’s political points of view. The Danish question refers to ‘the candidate’s political attitudes’, whereas the Norwegian refers to ‘the candidate’s positions on important issues’. This difference may be of more significance as the Danish question seems broader, but both the Danish and the Norwegian questions are related to substantive representation in politics (von Schoultz and Papageorgiou Citation2021), in contrast to the other items that measure descriptive representation (i.e. socio-demographic and contextual characteristics of the candidate; see Pitkin 1967).
8 The shares of women among elected councillors were: Councils with less than 19 members: 41.0% in Norway, 34.1% in Denmark. 19–27 members: 38.8% in Norway, 33.1% in Denmark. More than 27 members: 41.4% in Norway, 32.5% in Denmark.
9 The effect of preference votes seems especially large in two Danish parties: the Liberal Alliance and the Alternative. However, these are small parties with very few local councillors.
10 It should be noticed, however, that there is a difference in question wording: The geography question does not ask for proportional representation of all groups, just that all groups should be represented.
References
- Ajzen, Icek, and Martin Fishbein (1977). ‘Attitude-Behavior Relations: A Theoretical Analysis and Review of Empirical Research’, Psychological Bulletin, 84:5, 888–918.
- Antić, Marija, and Ivana Radačić (2020). ‘The Evolving Understanding of Gender in International Law and “Gender Ideology” Pushback 25 Years since the Beijing Conference on Women’, Women’s Studies International Forum, 83, 102421.
- Baldersheim, Harald, Lawrence E. Rose, and Siv Sandberg (2017). ‘Local and Regional Government in the Nordic Countries: Co-operative Decentralization’, in Oddbjørn Knutsen (ed.), The Nordic Models in Political Science: Challenged, but Still Viable? Bergen: Fagbokforlaget, 193–218.
- Berglund, Frode (2005). ‘Likestilte politikere? Om rekruttering og frafall i lokalpolitikken’, Report 2005:18. Oslo: NIBR.
- Beskaeftigelsesministeriet (2021). Vejledning om kønssammensaetning af offentlige udvalg, kommissioner og lign., kommunale og regionale udvalg m.v. og besaettelse af visse bestyrelsesposter i den offentlige forvaltning m.v. (ligestillingsloven kap. 4), available at https://bm.dk/media/15635/150907_vejledning_om_ligestillingslovens_kapitel_4.pdf (accessed 10 December 2021).
- Bullock, Charles S. III, and Susan A. MacManus (1991). ‘Municipal Electoral Structure and the Election of Councilwomen’, The Journal of Politics, 53:1, 75–89.
- Christmas-Best, Verona, and Ulrik Kjaer (2007). ‘Why So Few and Why So Slow? Women as Parliamentary Representatives in Europe from a Longitudinal Perspective’, in Maurizio Cotta and Heinrich Best (eds.), Democratic Representation in Europe: Diversity, Change and Convergence. Oxford: Oxford University Press, 77–105.
- Crowder-Meyer, Melody, Shana Kushner Gadarian, and Jessica Trounstine (2015). ‘Electoral Institutions, Gender Stereotypes, and Women’s Local Representation’, Politics, Groups, and Identities, 3:2, 318–34.
- Dahl, Malte, and Jacob Nyrup (2021). ‘Confident and Cautious Candidates: Explaining Under-representation of Women in Danish Municipal Politics’, European Journal of Political Research, 60:1, 199–224.
- Dahlerup, Drude (1988). ‘From a Small to a Large Minority: Women in Scandinavian Politics’, Scandinavian Political Studies, 11:4, 275–98.
- Dahlerup, Drude (2018). ‘Gender Equality as a Closed Case: A Survey among the Members of the 2015 Danish Parliament’, Scandinavian Political Studies, 41:2, 188–209.
- Gender Equality Act (2021). LBK 751 of 26/04/2021 Issued by the Danish Ministry of Labour, available at https://www.retsinformation.dk/eli/lta/2021/751#ida8ccd9fd-bcb3-48fd-a19f-9312cdcbadb2 (accessed 10 December 2021).
- Halsaa, Beatrice (2019). ‘Kampanjer for kvinner i kommunepolitikken’, Tidsskrift for kjønnsforskning, 43:3, 158–76.
- Holman, Mirya R (2017). ‘Women in Local Government: What We Know and Where We Go from Here’, State and Local Government Review, 49:4, 285–96.
- Inglehart, Ronald, and Pippa Norris (2003). Rising Tide: Gender Equality and Cultural Change around the World. Cambridge: Cambridge University Press.
- Inhetveen, Katharina (1999). ‘Can Gender Equality Be Institutionalized? The Role of Launching Values in Institutional Innovation’, International Sociology, 14:4, 403–22.
- Kelan, Elisabeth (2009). ‘Gender Fatigue: The Ideological Dilemma of Gender Neutrality and Discrimination in Organizations’, Canadian Journal of Administrative Sciences/Revue Canadienne des Sciences de l’Administration, 26:3, 197–210.
- Kjaer, Ulrik (1999). ‘Saturation without Parity: The Stagnating Number of Female Councillors in Denmark’, in Erik Beukel, Kurt Klaudi Klausen, and Poul Erik Mouritzen (eds.), Elites, Parties and Democracy – Festschrift for Professor Mogens N. Pedersen. Odense: Odense University Press, 149–68.
- Kjaer, Ulrik (2022). ‘Denmark: How Two and a Half Parties Rule within a Multi-Party System’, in Adam Gendźwiłł, Ulrik Kjaer, and Kristof Steyvers (eds.), The Routledge Handbook of Local Elections and Voting in Europe. London: Routledge, 21–30.
- Kjaer, Ulrik, Kelly Dittmar, and Susan J. Carroll (2018). ‘Council Size Matters: Filling Blanks in Women’s Municipal Representation in New Jersey’, State and Local Government Review, 50:4, 215–29.
- Kjaer, Ulrik, and Mona Lena Krook (2019). ‘The Blame Game: Analyzing Gender Bias in Danish Local Elections’, Politics, Groups, and Identities, 7:2, 444–55.
- Kjaer, Ulrik, and Richard E. Matland (2014). ‘Women’s Representation in Local Politics in the Nordic Countries – Does Geography Matter?’, Urban Affairs Association Annual Meeting, San Antonio, TX, 19–22 March.
- Kjaer, Ulrik, and Niels Opstrup (2018). ‘Danske borgmestre 1970-2018’, Kommunalpolitiske Studier No. 33/2018. Odense: Faculty of Business and Social Sciences, University of Southern Denmark.
- Knutsen, Oddbjørn (2017). ‘Political Parties and Party Systems’, in Oddbjørn Knutsen (ed.), The Nordic Models in Political Science: Challenged, but Still Viable? Bergen: Fagbokforlaget, 48–76.
- Norris, Pippa (1996). Electoral Engineering: Voting Rules and Political Behavior. Cambridge: Cambridge University Press.
- Norris, Pippa, and Joni Lovenduski (1994). Political Recruitment: Gender, Race and Class in the British Parliament. Cambridge: Cambridge University Press.
- OECD (2021). OECD Better Life Index, available at https://www.oecdbetterlifeindex.org/#/11111111111 (accessed 17 December 2021).
- Pedersen, Mogens N (2000). ‘The Incremental Transformation of the Danish Legislative Elite: The Party System as Prime Mover’, in Heinrich Best and Maurizio Cotta (eds.), Parliamentary Representatives in Europe 1848–2000. Oxford: Oxford University Press, 29–49.
- Pitkin, Hanna Fenichel (1967). The Concept of Representation. Berkeley: University of California Press.
- Rule, Wilma (1987). ‘Electoral Systems, Contextual Factors and Women’s Opportunity for Election to Parliament in Twenty-Three Democracies’, The Western Political Quarterly, 40:3, 477–98.
- Saglie, Jo, and Signe Bock Segaard (2022). ‘Norway: Local Democracy by Trial (and Error)’, in Adam Gendźwiłł, Ulrik Kjaer, and Kristof Steyvers (eds.), The Routledge Handbook of Local Elections and Voting in Europe. London: Routledge, 51–61.
- Sanbonmatsu, Kira (2008). ‘Gender Backlash in American Politics?’, Politics & Gender, 4:04, 634–42.
- Segaard, Signe Bock, and Hilmar Rommetvedt (2021). ‘Hvem skal bestemme for oss? Velgernes syn på lokalpolitisk representasjon’, in Jo Saglie, Signe Bock Segaard, and Dag Arne Christensen (eds.), Lokalvalget 2019: Nye kommuner – nye valg? Oslo: Cappelen Damm Akademisk, 171–200.
- Segaard, Signe Bock, and Jo Saglie (2021). ‘A Gender-Generation Gap in Political Representation? The Contingent Impact of Preferential Voting in Norwegian Municipal Elections’, Local Government Studies, 47:1, 145–65.
- Siaroff, Alan (2000). ‘Women’s Representation in Legislatures and Cabinets in Industrial Democracies’, International Political Science Review, 21:2, 197–215.
- Smith, Adrienne R., Beth Reingold, and Michael Leo Owens (2012). ‘The Political Determinants of Women’s Descriptive Representation in Cities’, Political Research Quarterly, 65:2, 315–29.
- Studlar, Donley T., and Ian McAllister (2002). ‘Does a Critical Mass Exist? A Comparative Analysis of Women’s Legislative Representation since 1950’, European Journal of Political Research, 41:2, 233–53.
- Teigen, Mari, and Hege Skjeie (2017). ‘The Nordic Gender Equality Model’, in Oddbjørn Knutsen (ed.), The Nordic Models in Political Science: Challenged, but Still Viable? Bergen: Fagbokforlaget, 125–47.
- Thames, Frank C, and Margaret S. Williams (2013). Contagious Representation – Women’s Political Representation in Democracies around the World. New York: NYU Press.
- Trounstine, Jessica, and Melody E. Valdini (2008). ‘The Context Matters: The Effects of Single-Member versus at-Large Districts on City Council Diversity’, American Journal of Political Science, 52:3, 554–69.
- von Schoultz, Åsa, and Achillefs Papageorgiou (2021). ‘Policy or Person? The Electoral Value of Policy Positions and Personal Attributes in the Finnish Open-List System’, Party Politics, 27:4, 767–78.
- World Economic Forum (2021). ‘Global Gender Gap Report 2021’, Insight Report March 2021. Cologny: World Economic Forum.