Abstract
This study charts reports of nasty or threatening text and email messages received by students in academic years 7 and 8 (11–13 years of age) attending 13 secondary schools in the North of England between 2002 and 2006. Annual surveys were undertaken on behalf of the local education authority to monitor bullying. Results indicated that, over five years, the number of pupils receiving one or more nasty or threatening text messages or emails increased significantly, particularly among girls. However, receipt of frequent nasty or threatening text and email messages remained relatively stable. For boys, being a victim of direct‐physical bullying was associated with receiving nasty or threatening text and email messages; for girls it was being unpopular among peers. Boys received more hate‐related messages and girls were primarily the victims of name‐calling. Findings are discussed with respect to theoretical and policy developments, and recommendations for future research are offered.
Introduction
Technology has transformed the lives of many children and young people and has become integral to their everyday existence. In the UK, the charity now called Action for Children (see NCH, Citation2005) reported that, at the time, over 97% of the young people in their study aged between 12 and 16 years owned mobile/cellular telephones (hereafter referred to as mobile phones). Furthermore, the Office for National Statistics (ONS) reported that 98% of children and young people aged between 5 and 18 years had regular access to a computer (National Grid for Learning, Citation2002). Methods of communication such as text messaging (SMS messaging) via mobile phones and online instant messaging have redefined our understanding of the nature of young people’s social networks and social interactions, and this has come about primarily as result of their increasing popularity and relative inexpense (Bryant et al.,Citation2006). Additionally, according to Campbell (Citation2005), mobile phone handsets have been transformed into fashion accessories, becoming essential to the establishment of social status within peer hierarchies.
Research into the positive benefits of providing young people with mobile phones, particularly with respect to personal safety (Ling, Citation2004), have been overshadowed by those studies concerned primarily with the negative aspects of mobile phone ownership and unrestricted access to the World Wide Web (the Web). For example, Parry (Citation2005) noted that, with the advent of ‘camera phones’, has come the ability of one person to take compromising or inappropriate photographs or make videos of an unwitting individual and distribute those images and videos among peers with the intention of shaming or otherwise embarrassing the target. Further technological advances allowing mobile phones to interface with the Web have meant that those images and videos which once could only be viewed by a limited audience can now be uploaded immediately onto social networking or unrestricted viewing sites (e.g. YouTube) and accessed globally.
Bullying and cyberbullying: an overview of research
Bullying, whether physical, verbal, indirect or relational, represents a systematic abuse of power that is both persistent and intentional (Nansel et al., Citation2001).Various studies of bullying perpetration and victimisation have found an age difference in boys’ and girls’ exposure to bullying, with younger boys opting for direct‐physical forms of aggression (e.g. hitting, kicking, and punching) more readily than girls, who use direct‐verbal (e.g. name‐calling and labelling), and indirect or relational aggression (the spreading of malicious gossip, rumour mongering, and social isolation) (Nansel et al., Citation2001; Besag, Citation2006; Bowie, Citation2007; Murray‐Close et al., Citation2007; Rivers et al., Citation2007; Williams & Guerra, Citation2007). However, more recent longitudinal data gathered by Pepler et al. (Citation2008) have shown that differences between the sexes in terms of exposure to different types of bullying reduce with age.
Cyberbullying is a relatively new phenomenon and, as such, research into it is only now gaining momentum. Principally, cyberbullying can be described as bullying that occurs through media and communication devices such as mobile phones, email, and the Internet (e.g. social networking sites, web pages, and blogs). Unlike other forms of bullying where there has been a long‐standing general agreement among researchers about the repeated nature of the behaviour, studies of cyberbullying have been less restrictive in applying a definition that requires a persistent and meaningful interaction between the perpetrator and the victim, primarily as a result of the anonymity cyberbullying affords the perpetrator (Wolak et al., Citation2007).
Prevalence rates of cyberbullying
Using data collected from the Youth Internet Safety Survey in the United States, Ybarra and Mitchell (Citation2004) found that 19% of their 1501 participants had been involved in some form of online harassment in the previous year as either perpetrators or victims. Kowalski et al. (Citation2008), in their survey of 3767 students, found that 25% of girls and 11% of boys had been electronically bullied at least once in the previous two months. Ybarra and Martin (Citation2008, personal communication) found that 28% of their sample (aged 8–18 years) who used text messages (30% of the total sample of 1306) received harassing messages on more than one occasion. In Canada, Li (Citation2005) found that 24.9% of her sample of 177 grade 7 students had been a victim of cyberbullying; 38.6% of the victims were male and 59.1% were female. Subsequently, in her study of 264 seventh to ninth grade students, Li (Citation2006) found that whilst reports of being a victim of cyberbullying had not only reduced but levelled out between the sexes (25% for boys and 25.6% for girls), reports of perpetration were substantially different (22.3% for boys and 11.6% for girls).
In their online survey of 384 American youth, Patchin and Hinduja (Citation2006) examined the prevalence of different types of cyberbullying. They found that 29.4% of the sample had been victims of cyberbullying. Specifically, 21.9% had been bullied in a chat room, 13.5% had been bullied via computer text message, 12.8% via email, 2.9% via bulletin board, 2.1% via mobile phone text messaging, and 1.6% through a newsgroup. In a follow‐up study of 1378 Internet users under the age of 18 years, Hinduja and Patchin (Citation2008) found that 32% of boys and 36% of girls reported that they had been victims of cyberbullying. In particular, girls were more likely than boys to be bullied by computer text message (19.8% versus 17%), email (13.0% versus 9.7%), and mobile phone text message (4.7% versus 4.0%). In terms of perpetration, boys were more likely than girls to bully in chat rooms (9.6% versus 7.3%) and on bulletin boards (3.4% versus 2.4%). Hinduja and Patchin also explored the offline correlates of cyberbullying. Their data suggested that cyberbullying is predicted by offline problems at school including truancy, cheating in examinations, other forms of victimisation, fighting, and substance abuse (the consumption of alcohol or the smoking of marijuana).
In terms of differences according to age, Williams and Guerra (Citation2007) in their study of 3339 American youth in grades 5, 8, and 11 (2293 of whom were followed up within 12 months), found that Internet bullying is rare in fifth grade (4.5%; 10–11 years of age), peaks in eighth grade (12.9%; 13–14 years of age) and declines marginally by 11th grade (9.9%; 16–17 years of age). While Williams and Guerra could not find any one predictor of Internet bullying, they did find that all three of the types of bullying they surveyed (physical, verbal, and Internet) were related to students’ normative beliefs about bullying (i.e. their approval of it), negative school climate, and negative peer support.
In the UK, while there have been various cross‐sectional studies of cyberbullying, there is yet to be any systematic investigation of this phenomenon. In 2005, the children’s charity now known as Action for Children (formally the National Children’s Home or NCH) surveyed 770 young people about their experiences of cyberbullying. They found that 20% had experienced some form of bullying through technology: 14% through text messaging, 5% in Internet chat rooms, and 4% by email (NCH, Citation2005). Research conducted with 518 youth by MSN found that 11% reported being a victim of cyberbullying, and that girls (14%) thought cyberbullying was worse than other types of bullying. Overall, 22% of those youth surveyed thought the worst thing about cyberbullying was the fact that more people would know about the bullying they had experienced (MSN, Citation2006).
Smith et al. (Citation2008) reported on two studies conducted in the UK focusing on the nature of cyberbullying among secondary school students (aged 11–16 years). In their first study of 92 students, they found that 6.6% were regularly victims of cyberbullying, with no significant gender differences. In their second study of 533 students, they found that rates of cyberbullying increased with age (from 14% in Year 7 to 23% in Year 11) with the most frequently reported types of cyberbullying being instant messaging (9.9%), telephone calls (9.5%), and text messages (6.6.%). From students’ self‐reports, they were also able to determine that victims of cyberbullying were also likely to be victims of offline bullying, and that perpetrators of cyberbullying were also perpetrators of offline bullying.
Methodological issues in the study of cyberbullying
Although the above review illustrates that there have been numerous studies of what has been described as cyberbullying, researchers have been less than consistent in determining what constitutes cyberbullying. For example, in the USA Patchin and Hinduja (Citation2006) defined it as ‘willful and repeated harm inflicted through the medium of electronic text’ (p. 152). By way of contrast, in Canada Li (Citation2007) reported that www.cyberbullying.ca described cyberbullying as:
The use of information and communication technologies such as email, cell phone and pager text messages, instant messaging, defamatory personal Web sites, and defamatory online personal polling Web sites, to support deliberate, repeated, and hostile behavior by an individual or group, that is intended to harm others. (p. 1779)
In the UK, Smith et al. (Citation2008) defined cyberbullying as, ‘an aggressive, intentional act carried out by a group or individual, using electronic forms of contact, repeatedly and over time against a victim who cannot easily defend him or herself’ (p. 376).
While all three definitions stress the repeated nature of the behaviour, the types of electronic devices/media that have been investigated have varied considerably over the years, often as a result of advances in technology (see Table ). For example while the majority have reported incidents of bullying perpetrated via email, SMS/text messages, and instant messages, more recently, others have included verbal abuse conducted via mobile phone (see Smith et al., Citation2008). While most, but not all, have reported bullying that occurred in Internet chat rooms (see Finkelhor et al., Citation2000; NCH, Citation2002; NCH ‘Putting U in the Picture’—Mobile Bullying Survey, Citation2005; Li Citation2005, Citation2006; Fight Crime Pre‐teen, Citation2006; Fight Crime Teen, Citation2006; Kowalski & Witte, Citation2006; Patchin & Hinduja, Citation2006; Smith et al., Citation2006; Kowalski & Limber, Citation2007; Hinduja & Patchin, Citation2008; Smith et al., Citation2008), some have included the uploading of images onto websites, the distribution of images via mobile phones (Fight Crime Pre‐teen, Citation2006; Fight Crime Teen, Citation2006; Smith et al., Citation2006, Citation2008), or the posting of messages on bulletin boards, and newsgroups (Patchin & Hinduja, Citation2006; Hinduja & Patchin, Citation2008). Some researchers have not specified the behaviours that constituted cyberbullying in their studies, or the media they included (see Ybarra & Mitchell, Citation2004; Ybarra et al., Citation2006), and some opted only to provide examples to assist those completing the various survey instruments rather than definitive statements about what cyberbullying is and is not (see Li Citation2005, Citation2007; Kowalksi & Limber, Citation2007). Finally, some researchers have opted to describe the behaviour they measured in terms of Internet bullying, ignoring the role of the mobile phone (Williams & Guerra, Citation2007).
Table 1. Key studies of cyberbullying since 2002
Concomitant with issues surrounding the definition of cyberbullying and the inclusion criteria used in various studies, prevalence rates have also been calculated differently. Indeed, while the majority of researchers have agreed upon definitions that include the repeated nature of the behaviour (see above), in reporting their findings they have often opted to include single as well as multiple incidents. For example, in the USA Kowalksi and Witte (Citation2006) set the benchmark as ever having been cyberbullied, while in the UK Smith et al. (Citation2006, Citation2008) set it at two or three times in the past couple of months. As previously discussed, Hinduja and Patchin (Citation2008) framed their study of cyberbullying in terms of repeated experiences in the last year (see also Patchin & Hindjua, Citation2006). Finally, in Canada, Li (Citation2005, Citation2006) asked students about their experiences of cyberbullying during school (Li, Citation2005, Citation2006). Thus, rates of cyberbullying have been reported as ranging anywhere from 4% (Ybarra & Mitchell, Citation2004) to 36% (in this case for girls, see Hinduja & Patchin, Citation2008).
It has also been difficult to understand the gendered nature of cyberbullying, as so many victims report that they do not know the identity of their aggressor. For example, Wolak et al. (Citation2007) reported that among those youth who reported being harassed online in the Youth Internet Safety Survey, only 43% knew their perpetrator offline. Furthermore, of those who did know the perpetrator, nearly half were female—a finding mirrored by Hinduja and Patchin (Citation2008). Currently, simply knowing who the perpetrator is or was adds little to our understanding of cyberbullying without knowing the content of messages received by victims. As yet few studies have provided enough qualitative examples of cyberbullying to conduct any form of analysis
Finally, one of the inherent methodological weaknesses in many of the studies cited above has been the failure to take into account advances in technology and the impact market increases in mobile phone purchases and Internet connectivity have had upon reports of cyberbullying. The development of new technologies and new methods of communication including 3G phones and social networking sites has undoubtedly had an impact upon cyberbullying. However, to date, researchers have not considered whether changes in the nature of cyberbullying, or rises in prevalence rates can be accounted for by the availability and affordability of new technologies, nor have they been able to chart this over time.
Rationale and aims of the present study
While there have been a number of large‐scale cross‐sectional studies conducted in the USA and UK, as noted above it is unclear whether or not rates of cyberbullying have increased as a function of greater access to mobile and computer technology by young people. In addition, while age‐related differences in being a victim of cyberbullying have been found between groups, there is little evidence of increases within groups. This study plots the emergence of reports of the receipt of nasty or threatening text and email messages among groups of students (11–14 years of age) attending secondary schools in the North of England between 2002 and 2006. From its inception, our overarching aim was to provide researchers, policy makers, educators, and, we hope, parents with an appreciation of text and email aggression as it emerged and became a national policy issue for school education in the UK.
In 2002, at the commencement of the study, the focus of our attention was solely on the receipt of nasty or threatening text and email messages, and we opted to retain this focus throughout. Our decision not to report on other communication devices has been informed by three factors. Firstly, data from the Office for National Statistics (ONS) have shown that, in the UK, growth in mobile phone ownership has been moderate since 2003–4, with 80% of households reporting at least one mobile phone (92% in the highest income bracket and 56% in the lowest; ONS, Citation2008). In terms of access to a computer, while the ONS (see National Grid for Learning, Citation2002) found that 98% of young people had access to a computer, either at home or at school, rates of household ownership have also levelled off, with latest figures suggesting only a 2% growth rate from 2005 to 2006 (65–67%), and only a 10% rise in those homes with an Internet connection between 1998 and 2006 (49–59%; ONS, Citation2008). Secondly, data collected on behalf of the Department for Education and Skills (Hayward et al., Citation2003) indicated that, by the autumn of 2002, 84% of children and young people had access to the Internet (at school or at home, or in another place), and that the greatest increase in access to mobile phones occurred between Key Stage (KS) 2 (7–11 years of age) and KS3 (11–14 years of age) with a moderate increase from KS3 to KS4. Thus, we determined that our target sample should be students in KS3 where the most significant rise in mobile phone purchases by parents was reported. Thirdly, according to Hayward et al. (Citation2003), the number of pupils with access to a WAP/3G phone was very small in 2001 and 2002 (2% and 5% respectively). Similarly access to Palmtop computers was also very low (1%) across both years.
In retrospect we should also acknowledge that during this study there was a rapid series of developments in online gaming, instant messaging (IM), short‐range wireless connectivity, and social networking sites that changed, in a very short time, the way in which young people interacted with one another. It seemed likely our data would be confounded by the rise in popularity and increasing availability of these new ways of communicating. Consequently, the decision to report only those data relating to bullying perpetrated through media that have been available to the majority of young people in the UK since 2002 was seen as a means of reducing the likelihood of making Type 1 errors. Thus, our specific aims in analysing the data from this study were as follows:
| 1. | to chart the development of reports of receiving nasty or threatening text and email messages across five years for victims; | ||||
| 2. | to determine whether there are any consistent sex or age differences in receiving nasty or threatening text and email messages; | ||||
| 3. | to consider whether the incidence of receiving nasty or threatening text and email messages across the five years was related to market uptake in mobile phones and Internet connectivity; | ||||
| 4. | building upon previous studies, to consider whether factors such as age, being a victim of other forms of bullying behaviour, popularity at school, good or poor behaviour at school, enjoyment of school, and being good at school work, were likely to be associated with the likelihood of receiving nasty or threatening text and email messages for boys and for girls separately; and, | ||||
| 5. | to undertake an initial analysis of the content of text and email messages received by the students in our study, and the potential reasons why they were being bullied. | ||||
Method
Participants
From 2002 to 2006 we surveyed 13 schools in a small city in the North of England (approximately 2500 students per calendar year). In years 2002, 2003 and 2006, data were collected from students in KS3 (aged between 11 and 14 years; academic years 7, 8 and 9). In years 2004 and 2005, data were collected from students aged between 11 and 13 years only (academic years 7 and 8). A small number of students from academic year/grade 10 (KS4; 14–15 years of age) also participated in 2002 (see Table ). As noted previously, for the purposes of this study data are drawn from students in Years 7 and 8 only (11–13 years of age).
Table 2. Number of students participating in study by year and by cohort
As our data contained a degree of interdependence with pupils appearing more than once across the five years, our data were also recoded to allow for comparison of reports of receiving nasty or threatening text and email messages from one year to the next. Firstly, data gathered from pupils across the five years were recoded into cohorts representing when they first entered the data set (i.e. Cohort 1 = 2002–3; Cohort 2 = 2003–4, Cohort 3 = 2004–5, and Cohort 4 = 2005–6; see Table ). Secondary coding by age was then undertaken so that data gathered from pupils in Year 7 could be compared to data submitted by members of the same cohort 12 months later in Year 8.
Comparable with the local population, students were primarily white British (98%). Catchment areas for each of the participating schools, and entrance requirements did not vary across the five years, and included faith schools as well as community colleges and high schools. Thus the sample represented a diverse range of pupils with varying socio‐economic status and records of academic achievement. Each of the schools participated in an ongoing series of anti‐bullying initiatives funded by the local education authority, which included city‐wide advertisement campaigns on buses, the distribution of ‘Are You Being Bullied?’ leaflets to all pupils, workshops and theatre productions (in 2002 only to launch the initiatives), and a series of annual surveys.
Measures
Anti‐bullying questionnaire
For this study we used a short version of the Olweus Bully/Victim Questionnaire, which has been shown to have both construct and discriminant validity in terms of prevalence estimation (see Solberg & Olweus, Citation2003). In addition to basic demographic data, we provided students with a definition of bullying comparable to that used by Olweus (Citation1993) and Smith et al. (Citation2008):
We say a pupil is being bullied when another pupil, or a group of pupils, say nasty and unpleasant things to him or her. It is also bullying when a pupil is hit, kicked, threatened, locked inside a room, and things like that. These things may take place frequently and it is difficult for the pupil being bullied to defend himself or herself. It is also bullying when a pupil is teased repeatedly in a negative way. But it is not bullying when two pupils of about the same strength quarrel or fight.
Students were given 12 questions about being bullied at school which included questions about its frequency (0 = I haven’t been bullied in school this term, 5 = Several times a week), the types of bullying they had experienced, with each type scored 0 = No and 1 = Yes (I haven’t been bullied this term, I’ve been called names about my race or colour, I’ve been called names in other ways, I’ve been hit/kicked, rumours have been spread about me, no one will speak to me, I have been frightened when a particular person looked in my direction, I have had my belongings taken, my homework has been destroyed, I have been bullied in other ways), location (classrooms, corridors, school yard, playing field, changing rooms, on the way home, toilets [added in 2004], other), and in 2006 we added a question which asked students to tell us why they were being bullied at school (I haven’t been bullied, because of my weight, size or body shape, because of my appearance, because of my ethnicity/colour, because I am a Traveller, because I am called ‘gay’ or ‘lesbian’, because my school work is good, because my school work is not so good, because I have special needs, because I have a disability, because of who I’m friends with, because I am good at sport, because I am no good at sport, because of my possessions, because of the brand of clothes I wear, and other). Additional questions addressed issues of age, sex, and number of perpetrators, and whether or not a teacher or parent/guardian had been told about the bullying. Ten questions relating to the perpetration of bullying followed which were similar in terms of content and structure to those described above. Students were then asked two questions about witnessing bullying. The first question addressed whether they had witnessed an incident of bullying that had upset them (1 = No, 2 = Yes), which they were then asked to describe qualitatively. The second question addressed whether or not the incident had been resolved (1 = No, 2 = Yes) which they were also asked to describe qualitatively.
Text and email bullying
From 2002 to 2005, students were asked the question: Have you ever received any nasty or threatening text messages or emails? They were coded and labelled as a six‐point scale in keeping with other studies of bullying (0 = Not bullied, 1 = Once only, 2 = Occasionally this term, 3 = Sometimes, 4 = Regularly, once a week, 5 = Frequently, several times a week). In 2006, the question was split into two with pupils being asked to report incidents of text and email harassment/bullying separately (using the above scale), and to provide qualitative examples of the email and text messages they had received.
Enjoyment of school
In addition to questions concerning bullying, two questions were included that asked student to rate their behaviour at school (I am well behaved at school), and liking school (I like going to school) using a 1–5 scale (1 = Always, 2 = Usually, 3 = Sometimes, 4 = Not usually, and 5 = Never). One question asked them to rate their level of achievement in terms of schoolwork (How is your school work?), which was scored on a 1–5 scale (1 = Always good, 5 = Always poor), and another question addressed their enjoyment of break times/recess (1 = Like very much, 7 = Dislike very much).
Being unpopular/popular at school
Four items were combined to provide a measure of unpopularity/popularity at school. The items included in this scale included the questions: Do you feel lonely at school? scored on a 1–6 scale (1 = Never, 6 = Always); Do you feel that you are less well liked than other pupils in your class? (1 = Never, 6 = Always); How many good friends do you have in your class? (1 = Many, 5 = None); and How often does it happen that other pupils don’t want to spend break times alone with you? (1 = It hasn’t happened, 5 = Several times a week). The alpha coefficient for this measure ranged from .73 to .80 across the five years.
Procedure
Each calendar year from 2002 to 2006 questionnaires were distributed to schools by members of the local education authority’s (LEA) administrative staff during the summer term (June/July). Pupils completed the questionnaires in class, supervised by a teacher. They were asked not to identify themselves by name, but simply to circle the response corresponding to their year group and sex on the questionnaires. They were then reminded of the definition of bullying used in the study, and also to whom at school they could refer questions or concerns about bullying. On completion, the questionnaires were then collected and collated by year group, and returned to the LEA where they were input into electronic spreadsheets which were then analysed by the researchers.
Following analysis of the data, the head teachers of participating schools received customised summary reports providing them each with a breakdown of the findings for their own school comparing rates of bullying to the aggregated data from the other 12 schools, and those data collected from previous years. The reports assisted teaching staff in monitoring the effectiveness of the anti‐bullying measures in their schools. The LEA received a summary report, which included a breakdown of the findings by school, by year group, and by year of participation which could then be used to monitor the effectiveness of the anti‐bullying measures on a city‐wide basis.
Ethical considerations
Approval for this study was granted by the appropriate institutional ethics committee, and an assistant director within the LEA. The head teachers of participating schools sent letters to parents and/or guardians of students informing them of the anti‐bullying initiatives taking place, and the monitoring being undertaken by the researchers. During data collection, students were informed that their participation was voluntary and they could choose not to answer any or all of the questions in the survey. They were also informed of the appropriate member of staff in each school from whom they could seek advice or guidance on issues raised by the survey.
Results
Reports of text and email bullying across five years for victims
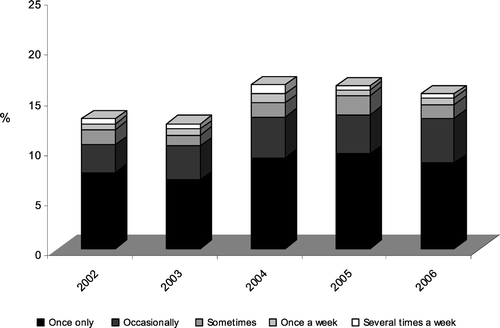
Figure illustrates the rise in reports of text and email bullying across five years for pupils in Years 7 and 8 with an average of 13% of pupils receiving one or more nasty or threatening text or email messages a term in 2002 rising to 16.4% in 2004 before gradually beginning to decline in 2005–6.
Figure 1 Receipt of nasty or threatening text messages and email by year of survey
Sex differences in reports of being bullied at least once this term
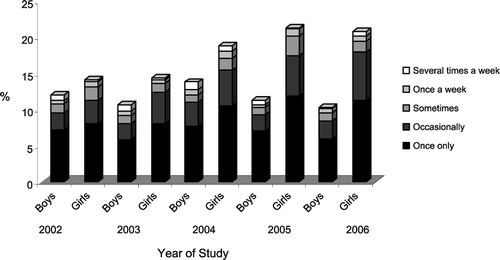
Contingency table analyses indicated that across all years girls were significantly more likely to receive nasty or threatening text and email messages at least once a term than boys (p = .05) and that the differences in sexes continued to grow, with reports of text and email bullying rising from 18.8% to 20.8% for girls, whilst they dropped from 13.8% to 10.3% for boys (see Figure ). However, reports of frequent receipt of nasty or threatening text and email messages (once a week or more) remained stable across the five years, ranging from 1.0–1.8% (0.8%–1.8% for boys, 0.7%–1.7% for girls) with no significant associations being found between boys and girls.
Figure 2 Receipt of nasty or threatening text messages and email by year of survey (Years 7 and 8 only)
Sex and age differences by cohort
As students appeared in our data twice across the five years (firstly in Year 7 and then again in Year 8), the data were recoded to allow for comparison of reports of nasty or threatening text messages and email a year apart (i.e. Year 7 versus Year 8), and also by cohort (i.e. 2002–3, 2003–4, 2004–5 and 2005–6).
A series of 2 × 4 analyses of variance (ANOVAs) was then conducted to determine the impact of age (Year 7 versus Year 8) and cohort on the reports of receiving nasty or threatening text messages and email (scored using the 0–5 scale) for the whole sample, and then split by sex. Given the size of the data set and the number of observations, we opted to reduce Type 1 errors by using a Bonferroni adjusted alpha level of .006 (8/.05).
Overall, we found a statistically significant main effect for cohort (F (3, 11127) =1.04, p = .004, η2 = .001), suggesting that significant changes in the pattern of receiving nasty or threatening text and email messages across time occurred. Post hoc comparisons using Tukey HSD indicated that the mean frequency for receiving nasty or threatening text messages and email that term for the 2002–3 cohort (M = 0.08, SD = 0.41) was significantly lower than that reported by the 2003–4 cohort (M = 0.13, SD = 0.54). All other post hoc comparisons were not found to be significant. The main effect for age was not significant, indicating that students’ reports of receiving nasty or threatening text and email messages between Year 7 and Year 8 for each cohort did not differ substantively. The interaction effect was also not significant.
When the data were split by sex, among girls we did not find statistically significant main effects for cohort (F (3, 5632) = 2.77, ns), or age (F (1, 5632) = 1.49, ns). The interaction effect was also not significant (F (3, 5632) = 2.38, ns). Among boys, however, we found a statistically significant main effect for cohort (F (3, 5487) = 5.51, p = .001, η2 = .003), again suggesting that significant changes in the pattern of receiving nasty or threatening text and email messages occurred across time. Post hoc comparisons using Tukey HSD indicated that the mean frequency for receiving nasty or threatening text messages and email that term for the 2002–3 cohort (M = 0.07, SD = 0.41) was significantly lower than that reported by the 2003–4 cohort (M = 0.13, SD = 0.58). Also, the mean score for the 2003–4 cohort (M = 0.13, SD = 0.58) was significantly higher than that reported by the 2005–6 cohort (M = 0.07, SD = 0.40). All other post hoc comparisons were not found to be significant. The main effect for age among boys and the interaction effect were not significant at p = .006.
Receipt of nasty or threatening text and email messages, mobile phone purchases, and uptake in Internet connectivity
The data in Figure indicated that there was a slight drop in the number of reports of receiving nasty or threatening text messages and emails in 2003 which could not, at the time, be explained. In addition, our analysis indicated that mean frequencies for receiving nasty or threatening text and email messages declined between 2002 and 2003, and then subsequently rose. Again, we had no explanation of this finding. Therefore we opted to incorporate into our analyses data drawn from Communications Market report (Section 3: Telecommunications) produced by the Office of Communications (Ofcom) in Citation2006 (see Figure and Table ). Ofcom’s report provided details of the household uptake of mobile phone ownership and Internet connectivity from 2002 to 2006. Figure and Table show that in 2003 there was a 3% market downturn in mobile phone purchases and a 2% downturn in household Internet connectivity. This was mirrored in our study by a downturn in reports of receiving nasty or threatening text messages and email by 1.4% among boys, but interestingly not among girls (there was in fact a 0.2% increase). However, other than 2003, girls’ reports of receiving nasty or threatening text messages and email did reflect the rise in mobile phone and Internet uptake reported by Ofcom. Consequently, we conducted a series of Pearson Product–Moment Correlations to determine the degree of relationship between our data and that provided by Ofcom. The results indicated that among girls only, across the five years of this study, receipt of nasty or threatening text and email messages was significantly and positively related to the pattern of household Internet connectivity, r = .88, n = 5, p = .04, and household mobile phone ownership, r = .96, n = 5, p = .01.
Figure 3 Receipt of nasty or threatening text messages and email and association with household uptake in mobile phone ownership and Internet connectivity
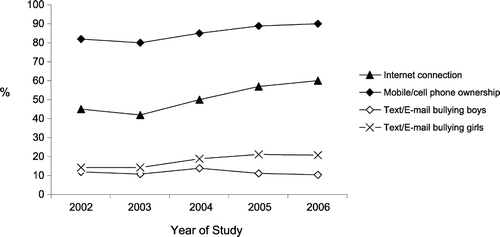
Table 3. Receipt of nasty or threatening text messages and email and association with household uptake in mobile/cell phone ownership and Internet connectivity
Factors associated with the receipt of nasty of threatening text messages and email
To date, only two of the studies we have reviewed have explored the predictors of cyberbullying (Hinduja & Patchin, Citation2008), and Internet bullying (Williams & Guerra, Citation2007). According to Hinduja and Patchin (Citation2008), in their study of cyberbullying they found that age, truancy, problems with schoolwork (poorer grades), offline bullying (victimisation and perpetration), and fighting were associated with victimisation. By way of contrast, while Williams and Guerra (Citation2007) could not find any one single predictor of Internet bullying, they did find that all three types of bullying they surveyed (physical, verbal, and Internet) were associated with students’ normative beliefs about the acceptability of bullying, negative school climate, and a lack of peer support.
Building upon these studies, we wished to explore whether the factors identified above (i.e. age, being a victim of other forms of bullying behaviour, being a perpetrator, popularity at school, good or poor behaviour at school, enjoyment of school, and being good or not so good at schoolwork) were associated with the likelihood of receiving nasty or threatening text and email messages more than once. Furthermore, as neither of the previous studies had looked in detail at sex differences in cyberbullying or Internet bullying, we wished to determine whether or not variables differed for boys and for girls.
For the purposes of analysis we chose to use the most recent survey data collected in 2006, with responses collected from those pupils in Year 9 removed (102 boys, 122 girls) as well as those containing missing/confounding data (84 boys, 56 girls). Our final data set contained 1323 boys and 1334 girls. There was no interdependence in this data.
To determine whether the findings from previous studies were applicable to this study, we opted to perform logistic regression analyses upon our data, using reports of receiving nasty or threatening text and email messages more than once as a binary dependent variable (recoded as 0 = No, 1 = Yes), with the independent variables including exposure to (i.e. most frequently reported) other forms of bullying—physical, verbal, or indirect/relational—which were coded (0 = I haven’t been bullied in school this term, 5 = Several times a week), bullying perpetration (0 = I haven’t bullied someone else in school this term, 5 = Several times a week), self‐reports of behaviour at school (1 = Always good, 5 = Never good), liking school (1 = Always like, 5 = Never like), being good or not so good at schoolwork (1 = Always good, 5 = Always poor), being popular/unpopular at school (scored out of 22), and age (0 = Year 7, 1 = Year 8).
Contingency table analyses (2 × 2) were computed, with the data file split by age, sex, and then age by sex, to determine whether or not they were factors that needed to be considered in conducting the regression analyses. Again, given the size of the data set and the number of observations we used a Bonferroni adjusted alpha level of .0125 (4/.05). Results indicated that there was a significant association between age and receiving nasty or threatening text messages and email more than once for the whole sample (p = .007), with more pupils in Year 7 reporting being victims (8.3%) than in Year 8 (5.7%). A significant association was also found for sex (p = .0001), with girls receiving nasty or threatening text messages and email more than once much more than boys (9.6% and 4.4% respectively). However, no significant associations were found between age and receiving nasty or threatening text messages and email more than once separately for girls or boys. Based upon these findings, we opted to remove age from our analyses.
Variables associated with the receipt of nasty and threatening text messages and email: boys
The full model containing all the independent variables was not found to violate the assumptions of logistic regression (Goodness‐of‐fit χ 2 (8) = 4.99, p = .76) and was statistically significant, (χ2 (8, n = 1323) = 36.77, p = .0001), explaining between 3% (Cox and Snell R2) and 32% (Nagelkerke R2) of the variance in receiving nasty or threatening text and email messages that term, classifying 99.3% of cases correctly. As Table illustrates, only one of the independent variables—direct‐physical bullying—made a unique statistical contribution to the model (p ≤ .001), suggesting that those boys who report being bullied physically (i.e. those who reported being hit, kicked or punched by one or more others that term) were more likely to report receiving nasty or threatening text messages and email (odds ratio 3.69, 95% confidence interval [CI] 1.84, 7.42).
Table 4. Logistic regression predicting likelihood of receiving nasty or threatening text messages and email: boys
Variables associated with receipt of nasty and threatening text messages and email: girls
The full model for girls containing all the independent variables was not found to violate the assumptions of logistic regression (Goodness‐of‐fit χ 2 (8) = 35.96, p = .06) and was statistically significant (χ2 (8, n = 1334) = 15.84, p = .0001), explaining between 3% (Cox and Snell R2) and 20.8% (Nagelkerke R2) of the variance in receiving nasty or threatening text and email messages more than once that term, classifying 98.7% of cases correctly. Table shows that only one of the independent variables—being unpopular/popular at school—made a unique statistical contribution to the model (p ≤ .002), suggesting that, among girls, the more unpopular they were, the more likely they were to have received nasty or threatening text messages and email more than once that term (odds ratio 1.26, 95% confidence interval [CI] 1.09, 1.46).
Table 5. Logistic regression predicting likelihood of receiving nasty or threatening text messages and email: girls
The content of nasty and threatening text messages and email
In 2006 the survey instrument was amended slightly to allow students to provide qualitative examples of the email and text messages they had received. In total 239 examples of text message and email content were collated. Text messages were submitted by 38 boys and 109 girls. Examples of email messages were provided by 17 boys and 75 girls. The messages were coded independently by each of the authors and subsequent comparisons were made. This was an iterative process and continued until full agreement between coders was achieved. Ten categories of text message and email were finally identified: threat of physical violence, abusive or hate‐related, name‐calling (including homophobia), death threats, ending of platonic relationships, sexual acts, demands/instructions, threats to damage existing relationships, threats to home/family, menacing chain messages (see Table ). A generic category entitled Other was retained for those text messages and email that were either cryptic or contained unusual content.
Table 6. Text/email message content
Contingency table analyses (2 × 2) indicated that there were significant associations between sex and exposure to abusive or hate‐related messages (p = .03), with boys receiving more hate‐related messages (25%) than girls (13%). Girls were also subject to more name‐calling (26%) than boys (3%; p = .004). All other comparisons were not significant, or could not be computed due to the size of sub‐samples.
In terms of content most of the text and email messages pupils reported as bullying were clearly aggressive in style and content (‘I’m going to kick your head in when you least expect it’, ‘I h 8 u’, ‘u r gay’, ‘die bitch by[e]’, ‘you will die in 2 days’, ‘I’m going to tell him that you said …’, ‘I will get you and your family too’, ‘I am going to infect your computer with a virus’). There was also some evidence of a power imbalance between perpetrators and victims, particularly where the text messages and email included threats of physical violence (‘you’re going to be knocked out after school’), death threats (‘I know where you live, I’m going to kill you’), and the ability to manipulate existing relationships (‘I’m going to make your mates turn against you’).
In terms of the potential reasons why the text and email messages were sent, while contingency tables analyses (including Yates’ Correction for Continuity where cells had expected frequencies of less than five) indicated that there were no significant associations between sex and the reasons for bullying taking place, we noted that boys rather than girls were more likely to receive nasty or threatening text and email messages if they were being bullied because of their weight, size or body shape (16.7% versus 10.5%), general appearance (33.3% versus 26.3%), ethnicity or colour (8.3% versus 0%), because they were called ‘gay’ (25% versus 10.5%), or because of the brand of clothes they wore (16.7% versus 10.5%). Girls, on the other hand, were slightly more likely than boys to receive nasty or threatening text and email messages if they were being bullied because their schoolwork was good (5.3% versus 0%), or because they were good at sports (10.5% versus 0%), or indeed poor at sports (10.5% versus 0%).
Discussion
The primary aims of this study were to chart the development of reports of receiving nasty or threatening text and email messages across five years for victims; to determine whether there are any consistent sex or age differences in receiving nasty or threatening text and email messages; and to consider whether the incidence of receiving nasty or threatening text and email messages across the five years could be determined by factors such as market uptake in mobile phones and Internet connectivity. In addition, building upon the results of those cross‐sectional studies that were published prior to this study, the study aimed to consider whether those offline factors associated with cyberbullying were also associated with the likelihood of receiving nasty or threatening text and email messages for boys and for girls. Finally, in the absence of published data illustrating the nature and content of cyberbullying, we aimed to provide an initial statistical analysis of the content of text and email messages received by the students in our study, and the potential reasons why they were being bullied.
Our findings indicate that, over the last five years, the sending of nasty or threatening text messages and email has been a substantive problem in secondary schools, particularly for girls. The girls in our study received nasty or threatening text and email messages much more than boys and, by 2006, twice as many girls reported receiving nasty or threatening text messages and email at least once that term when compared to boys (20.8% versus 10.3%). Notwithstanding, it is noteworthy that reports of receiving nasty or threatening text messages and email once a week or more remained relatively stable over the five years and when aggregated across boys and girls affected between 1.0% and 1.8% of our samples across each calendar year. Our analyses also demonstrated that early in the study, in 2003, there was a marginal decline in reports of nasty or threatening text messages and email which mirrored a downturn in purchases of mobile phones and Internet connectivity nationally (see Ofcom, Citation2006). Interestingly, our data did not suggest that, within cohorts, there were any significant increases in reports of receiving nasty or threatening text messages and email as students moved from Year 7 to Year 8, though various cross‐sectional studies have reported higher prevalence rates of cyberbullying between groups of students of different ages or in different grades of school.
Few of the independent variables reported by Hinduja and Patchin (Citation2008) and Williams and Guerra (Citation2007) were found to be associated with receipt of nasty or threatening text messages and email in this study. However, comparable with Hinduja and Patchin (Citation2008), we did find that, among boys, those who were also victims of direct‐physical bullying (hitting, kicking and punching) were also more likely to report receiving nasty or threatening text messages and email. It should be noted that the differences in findings between this study and that of Hinduja and Patchin (Citation2008) may be accounted for by the different ways in which the independent variables were coded for logistic regression. In Hinduja and Patchin’s study the independent variables were binary coded (0 and 1). In this study, we opted not to recode our independent variables, which had the effect of providing us with more conservative estimates of the variance explained by our regression models.
Among girls, we found that unpopularity among peers was associated with receiving nasty or threatening text messages and email. This finding partially supports those of Williams and Guerra (Citation2007) in that our measure of unpopularity would seem to serve as a proxy for their measure of negative peer support. However, it should be remembered that Williams and Guerra found that negative peer support predicted all three of the types of bullying they investigated—physical, verbal and Internet.
Finally, our exploratory analyses of the content of the text and email messages received indicated that boys received more hate‐related messages than girls, and that girls were subject to more name‐calling than boys. Although we did not find any significant associations between sex and reasons for being bullied, we did find that students who had received nasty or threatening text messages and email were victims of other forms of bullying as a result of their appearance, clothing, weight, size, or body shape, or because they were called ‘gay’ (boys in this case).
In the context of current research on cyberbullying, our findings support those studies that have shown that it co‐exists with other forms of bullying at school, particularly among boys. Victims may be identifiable to teachers either by their pre‐existing status as a victim of other forms of bullying, or by their isolation from peers in the classroom, schoolyard, and at lunch and break/recess. The identification of a relationship between direct‐physical bullying among boys, unpopularity among girls and receipt of nasty or threatening text and email messages is worthy of some consideration. Pepler et al. (Citation2008) have argued that differences between the sexes in terms of the types of bullying they experience may not be as apparent as first thought, particularly among older students. They noted in their longitudinal study that issues such as moral disengagement and relationship difficulties predicted high rates of bullying perpetration. Thus, for boys, one explanation may be that the receipt of nasty or threatening text messages and email represents a form of moral disengagement by perpetrators (a removal from the behavioural strictures placed upon students at school) and an ability to extend those behaviours already occurring offline (e.g. threats of direct‐physical bullying). Concomitantly, as Nansel et al. (Citation2001) have shown, girls’ bullying tends to involve the manipulation of relationships through behaviours such as the spreading of rumours much more than boys (65% versus 55%; 6th grade to 10th grade). The sending of nasty or threatening text and email messages may provide a means by which perpetrators ensure that currently unpopular girls remain unpopular, as well as providing a means to isolate the victim (indirect bullying), and also instigate direct bullying behaviour (albeit electronically). This would support the inferences drawn by Pepler et al. (Citation2008). Thus, those age and gender differences previously reported by researchers (see, for example, Rivers & Smith, Citation1994) may in fact be artefacts of the time in which the studies were conducted, and that those differences no longer are relevant to the online youth of today.
Developing a theoretical context for cyberbullying
In much of the research that has been conducted on cyberbullying there has been little (if any) regard for the theoretical understandings of this phenomenon. Indeed, as previously noted, many of the studies of what we call cyberbullying have not been consistent in terms of their scope or the definitions they used. Hinduja and Patchin (Citation2008) offered a brief overview of the theoretical frame that informed their study. Borrowing from criminology, they argued that cyberbullying can be viewed as a learned behaviour or a manifestation of a latent trait such as low self‐control (cf. Pepler et al., Citation2008). While there has been some debate surrounding whether or not ‘bullies’ have low self‐esteem, researchers have found that ‘bullies’ often display a high degree of control over their environment, and have well‐developed social skills (see Sutton et al., Citation1999). For victims, however, it is evident that cyberbullying, or indeed any form of technology‐mediated aggression, reinforces a sense of worthlessness among victims (see Ybarra et al., Citation2006). Interestingly, Patchin and Hinduja also suggested that issues such as race and sex may be less relevant in the context of cyberbullying as the environment is free from the cultural and gender‐based assumptions that permeate the material world, and provides an opportunity for the individual to interact with other people anonymously, or in the guise of someone older or younger than himself/herself, or indeed as a member of the opposite sex.
Early research on computer‐mediated interactions postulated that many of the behaviours that are represented in text format online are not meaningful because they are not ‘real’, i.e. they did not occur in the material world (Turkle, Citation1995). Young (Citation1996a) argued that while physicality (i.e. the material world) allows us to frame ‘the boundaries of our sense of containment’, when those boundaries no longer exist the ideas or beliefs people encounter online can be idealised or denigrated, often without justification. He went further to argue that ‘one of the most striking features of email forums and letters is that people can experience almost no impediment to expressing themselves—for good or ill—because it all feels as if it’s happening in the head’ (Young, Citation1996b). Thus, he argued that for many people interactions on the Internet become fantasy, and the harmful potential of a confrontational or abusive exchange with another person sitting at another computer in another room, potentially in another country, is questionable (at least from the point of view of the perpetrator). To a certain degree, the evolution of social networking sites and the suicide of Megan MeierFootnote 1 in particular has challenged this world‐view in that, for many young people, online interactions are real, and that the separation of the virtual and material worlds perhaps exists only among those of us who were not brought up in an age of instant messaging and online communication. Nevertheless, the question remains, why does cyberbullying exist?
From within the field of psychology, research conducted by Dovidio et al. (Citation2001) can help us understand why cyberbullying now exists. They have shown that there is very weak convergence between explicit attitudes purportedly held by people and those they hold implicitly. While prejudices can be explicitly rejected in the face of social opprobrium, they can still be retained by individuals who find opportunities to air them in the presence of like‐minded others, or in fora where their anonymity can be assured. In essence today’s communication technologies offer both these opportunities. Rudman et al. (Citation2007) developed this idea further by showing that a learned component to the development of explicit and implicit attitudes exists which, if left without check, promotes unhealthy or problematic behaviours (in their study the behaviours/conditions were smoking and obesity). In terms of cyberbullying, if, as Hinduja and Patchin (Citation2008) suggest, the virtual world represents an environment where material or explicit sensibilities are no longer applicable, or are, at the very least, less applicable, then it also holds that such an environment may be perceived to be one that grants greater licence to express implicit beliefs and attitudes, or engage in greater excesses of behaviour with the promise of less chance of detection as a result of the ability to block or hide one’s identity.
For teachers and parents, to effectively combat this new form of bullying there is a need also to understand the types of prejudices, beliefs, and dislikes students hold or encounter online. Taking these observations a step further, it would therefore seem that any intervention that was designed to challenge the prejudices that are expressed online, or limit the fora for the airing of those prejudices, grievances, or the dislike of one or more others would necessarily have to involve the imposition of a degree of censorship beyond that currently in place (e.g. net nannies). This is, in essence, where government policy is directed (see below). However, in addition to the imposition of further safeguards and censorship for students, in the case of cyberbullying there is yet another task that researchers in partnership with teachers and parents have to address, and that is to understand the context in which cyberbullying takes place and, more particularly, its nature, expression and content. To effectively challenge the negative perceptions or beliefs than inform a perpetrator’s decision to harass or otherwise abuse a peer online, it is important that we understand the significance of the messages that victims receive, not simply record their frequency, and interrogate the context and interpersonal dynamics that underpin the relationship between the perpetrator and the victim. This is, of course, predicated upon the ability to identify the perpetrator (or, at the very least, her or his sex) which, at best, has only been done in 50% of cases of cyberbullying without UK law enforcement invoking the 2003 Communications Act (Section 127 allows police officers to track individual Internet protocol [IP] addresses or mobile phone numbers through service providers). To date, the absence of qualitative data on the nature of cyberbullying has meant that many of the interventions currently recommended are extensions of those that address more traditional forms of bullying. For example, avoiding or ignoring the ‘bullies’ (i.e. deleting text and email messages from unknown sources or blocking known and unknown telephone numbers), and telling a parent or a teacher are cited by students and educators alike as appropriate or recommended actions or interventions (see Agatston et al., Citation2007; Smith et al., Citation2008). While such actions may provide ‘cybervictims’ with the ability to curtail their interactions with ‘cyberbullies’, they are short‐term solutions to an issue that will expand as technology develops, and they require ‘cybervictims’ to learn ‘risk’ management strategies rather than address the attitudes and online behaviour of ‘cyberbullies’.
Towards managing ‘risk’: new policy directions for educators
In the UK, in an independent review (sponsored by the Prime Minister’s Office) exploring the risks of exposure to potentially harmful or inappropriate material on the Internet and in video games, Byron (Citation2008) has argued that current debates relating to the harm caused by new technologies are unhelpful; rather, there is a need to look at ways of empowering children and young people to manage risk effectively. With respect to video games, a review of various developmental neuropsychological studies determined that age‐related restrictions or classifications were necessary to ensure that children are not exposed to violent media at an inappropriate stage in development. In addition, Byron recommended the more stringent regulation of the Internet, and the application of a classification scheme which provides ‘lock‐out’ options for searches that are deemed unsafe. While only brief mention was made of issues associated with the sending of inappropriate text, email, and video messages, the recommendations placed the impetus upon those involved in the training of teachers to raise the level of knowledge around e‐safety and to assess that knowledge against professional standards of competence.
According to Byron (Citation2008), rather than blame technologies and their creators for the abuses that have taken place, young people can be shown how to manage most of the risk they encounter, if not all of it. However, a caveat must be placed here. Ybarra et al. (Citation2008) have demonstrated that some of the ‘risk’ young people encounter exists within mainstream media—on news sites and web pages that feature stories, pictures, and commentaries on topical issues such as war, death, and terrorism. However, it would seem that in order to teach young people how to manage risk effectively there is a need to better understand the way in which personal safety issues are negotiated online, and how the decisions young people make online differ functionally from those offline. At the very least, guidance materials addressing e‐safety are pivotal to management of ‘risk’, and should provide potential victims of text or email aggression, or any form of cyberbullying, with strategies to block or challenge inappropriate messages, requests, and web posts, and offer generic guidance to all users of media and communication technologies on appropriate usage and conduct. Nevertheless, it is almost impossible to provide teacher trainers with information and guidance on how to tackle cyberbullying, or indeed any form of technology‐mediated violence, without understanding the content and context of a chat scenario, newsgroup or bulletin board posting, or text message, and, as noted previously, this is where future effort should be expended.
Strengths and limitations of the study
Although our study addresses being bullied by text and email message only, it remains the only longitudinal investigation of one aspect of the phenomenon we now call cyberbullying. For five years, we have been able to sample over 2500 students from the same schools in academic years 7 and 8, providing us with an opportunity to monitor students’ experiences of text message and email bullying. Furthermore, we have been fortunate that the samples were representative of the KS3 pupils attending schools in the region where the study was undertaken. As we noted above, the schools participating in this study included faith schools as well as community colleges and high schools, and catchment areas for each of the schools, and entrance requirements did not vary across the five years.
In terms of limitations, we should acknowledge that, whilst being representative of the geographical region, students in this study were predominantly white British, thus our data may not be illustrative of national bullying statistics. Secondly, while data were collected from students anonymously, the use of self‐report measures requires that some caution is exercised in the interpretation of findings as some students may not have been accurate in their responses. In addition, we again acknowledge that, since 2002, there have been significant developments both in terms of media and communication technologies and in terms of students’ access to and use of those technologies. Smith et al. (Citation2008) have identified seven different media linked to cyberbullying (phone calls, instant messaging, text messaging, email, video clips/messages, websites, and chat rooms) whereas we have focused our attention on only two. Thus, our data do not provide estimates of the incidence of cyberbullying as it is currently understood in the UK. Furthermore, we have not addressed issues surrounding bullying via social networking sites which, as noted above, have already resulted in several young people taking their own lives and engaging in risky offline behaviour (Bhat, Citation2008). Finally, in this study we did not explore young people’s engagement with online adventure games, their ability to ‘play out’ aggressive interactions within controlled ‘virtual’ environments, and the potential consequences these aggressive interactions have for psychological well‐being (Crowe & Bradford, Citation2006).
Comparable with other studies of cyberbullying, it should be acknowledged that the inclusion of single or occasional reports of text and email bullying in the data inflates prevalence statistics. It has been suggested by some researchers that there is a functional difference between incidents of harassment that occur online, for example, and cyberbullying. Wolak et al. (Citation2007) have argued that, in the majority of cases where young people report being harassed online, terms such as ‘bullying’ or ‘cyberbullying’ may be inappropriate, particularly where there is little or no evidence of co‐occurring offline victimisation. To construe such interactions as ‘bullying’ or ‘cyberbullying’ Wolak et al. suggested that there is a need to (a) establish intent on the part of the perpetrator towards the target or victim; and (b) demonstrate the repeated nature of that behaviour. They have suggested that behaviours they describe as ‘online harassment’ are different from bullying because ‘bullying’ per se requires the victim to understand the intention behind the action, the aggression contained within it, and the power the perpetrator has over her or him. This can be particularly difficult where the perpetrator is anonymous (as a result of caller identification blocking, or the use of an email account registered under a false name). Yet as we have shown, the content of text messages and email correspondence often betrays the underlying aggression and power that the perpetrator perceives s/he has over the victim.
Summary and future directions for research
In addition to the stated specific aims of the analyses we undertook, the overarching aim of this study was to provide researchers, policy makers, educators, and, we hope, parents with an appreciation of text and email aggression as it emerged and became a national policy issue for school education in the UK. While there have been numerous cross‐sectional studies of the phenomenon now called cyberbullying, those studies have employed different methodologies, different definitions, and different ways of calculating prevalence. Our analyses were intended to provide insights into the nature and correlates of text and email mediated aggression, and offer additional insights into the content of those messages, and the possible reasons why such messages were sent. This study adds to the body of literature in several different ways: it is longitudinal, it is focused in terms of the technology it explored, it has considered market uptake of the Internet and mobile phone ownership as correlates of increases in text and email aggression, and it has provided an initial summary analysis of the content of the text and email messages students have received. While we acknowledge there are questions left to be answered, this study provides a unique primary historical account of the emergence of a new form of bullying.
As we have noted, there are questions yet to be answered, and these invariably must focus upon the content, expression and context in which cyberbullying takes place. We need to better understand the gendered nature of cyberbullying wherever possible, though as we have discussed, the ability to change one’s identity online makes this all the more difficult. We need to conceptually define what cyberbullying is. Is it text based or is it simply mediated by technology? For example, should calls to and from a mobile phone be included (as in the case of Smith et al.’s Citation2008 research), and how do these differ from threatening or harassing telephone calls received or sent from a landline? While quantitative research has a useful role to play in monitoring prevalence, attention should now focus on qualitatively understanding the cyberbullying phenomenon, particularly from the perspective of the ‘cyberbully’. Is cyberbullying, as various researchers have suggested, an old problem in a new guise, or is it sociologically and psychologically different from that which has gone before?
Notes
1. Megan Meier was a 13‐year‐old young woman with a history of clinical depression, who began an online relationship with a 16‐year‐old boy ‘Josh Evans’ on Myspace. ‘Josh Evans’ was the pseudonym for the mother of one of Megan’s former friends. The intention of creating this false account was, it has been argued, to lull Megan into a false sense of security, to obtain private information from her, and then use it to humiliate her. The final message Megan received from ‘Josh Evans’ included the statement, ‘the world would be a better place without you’. Megan took her own life on 17 October 2006. Lori Drew, the mother who posed as ‘Josh Evans’ was prosecuted and found guilty of accessing a computer without authorisation on three occasions. At the time this article was written, Lori Drew had yet to be sentenced.
Related Research Data
References
- Agatston , P. W. and Carpenter , M. 2006 . Electronic bullying survey , Clemson University . Unpublished manuscript
- Agatston , P. W. , Kowalski , R. and Limber , S. 2007 . Students’ perspective on cyber bullying . Journal of Adolescent Health , 41 (6, Supplement) : 59 – 60 .
- Besag , V. E. 2006 . Understanding girls’ friendships, fights and feuds: a practical approach to girls’ bullying , Maidenhead : Open University Press .
- Bhat , C. S. 2008 . Cyber bullying: overview and strategies for school counsellors, guidance officers, and all school personnel . Australian Journal of Guidance and Counselling , 18 (1) : 53 – 66 .
- Bowie , B. H. 2007 . Relational aggression, gender and the developmental process . Journal of Child and Adolescent Psychiatric Nursing , 20 (2) : 107 – 115 .
- Bryant , J. A. , Sanders‐Jackson , A. and Smallwood , A. M. K. 2006 . IMing, text messaging, and adolescent social networks Available online at: http://jcmc.indiana.edu/vol11/issue2/bryant.html (accessed 18 October 2008)
- Byron , T. 2008 . Safer children in a digital world: the report of the Byron review Available online at: http://www.dcsf.gov.uk/byronreview (accessed 5 October 2008)
- Campbell , M. A. 2005 . Cyber bullying: an old problem in a new guise? . Australian Journal of Guidance and Counselling , 15 (1) : 68 – 76 .
- Crowe , N. and Bradford , S. 2006 . Hanging out in runescape: identity, work and play in the virtual playground . Children’s Geographies , 4 (3) : 331 – 346 .
- Dovidio , J. F. , Kawakami , K. and Beach , K. R. 2001 . “ Implicit and explicit attitudes: examination of the relationship between measures of intergroup bias ” . In Blackwell handbook of social psychology: intergroup processes , Edited by: Brown , R. and Gaertner , S. L. Oxford : Blackwell .
- Fight Crime Pre‐teen . 2006 . Cyber bully pre‐teen Available online at: http://www.fightcrime.org/cyberbullying/cyberbullyingpreteen.pdf (accessed 12 April 2009)
- Fight Crime Teen . 2006 . Cyber bully teen Available online at: http://www.fightcrime.org/cyberbullying/cyberbullyingteen.pdf (accessed 12 April 2009)
- Finkelhor , S. , Mitchell , K. and Wolak , J. 2000 . Online victimization: a report on the nation’s youth Available online at: http://www.unh.edu/ccrc/Youth_Internet_info_page.html (accessed 12 April 2009)
- Hayward , B. , Alty , C. , Pearson , S. and Martin , C. 2003 . Young people and ICT 2002: findings from a survey conducted in autumn 2002 , London : Department for Education and Skills .
- Hinduja , S. and Patchin , J. W. 2008 . Cyberbullying: an exploratory analysis of factors related to offending and victimization . Deviant Behavior , 29 (2) : 129 – 156 .
- Kowalksi , R. M. and Limber , S. 2007 . Electronic bullying among middle school students . Journal of Adolescent Health , 41 (6, Supplement) : 22 – 30 .
- Kowalski , R. M. , Limber , S. P. and Agatston , P. W. 2008 . Cyberbullying: bullying in the digital age , Malden , NH : Wiley/Blackwell .
- Kowalski , R. M. and Witte , J. 2006 . Youth internet survey , Clemson University . Unpublished manuscript
- Li , Q. Cyberbullying in schools: nature and extent of adolescents’ experience . paper presented at the Annual American Educational Research Association Conference . April , Montreal .
- Li , Q. 2006 . Cyberbullying in schools: a research of gender differences . School Psychology International , 27 (2) : 157 – 170 .
- Li , Q. 2007 . New bottle but old wine: a research of cyberbullying in schools . Computers in Human Behavior , 23 (4) : 1777 – 1791 .
- Ling , R. 2004 . The mobile connection: the cell phone’s impact on society , San Francisco , CA : Morgan Kaufmann .
- MSN . 2006s . MSN cyberbullying report: blogging, instant messaging, and email bullying amongst today’s teens Available online at: http://www.msn.co.uk/cyberbullying (accessed 6 October 2008)
- Murray‐Close , D. , Ostrov , J. and Crick , N. 2007 . A short‐term longitudinal study of growth of relational aggression during middle childhood: associations with gender, friendship intimacy, and internalizing problems . Developmental Psychopathology , 19 (1) : 187 – 203 .
- Nansel , T. , Overpeck , M. , Pilla , R. S. , Ruan , W. J. , Simons‐Morton , B. and Scheidt , P. 2001 . Bullying behaviors among US youth: prevalence and association with psychosocial adjustment . Journal of the American Medical Association , 285 (16) : 2094 – 2100 .
- National Grid for Learning . 2002 . Young people and ICT: findings from a survey conducted in autumn 2001 , London : Department for Education and Skills .
- NCH . 2002 . NCH national survey 2002: bullying Available online at: http://www.nch.org.uk/itok/showquestion.asp?faq=9&fldAuto=145 (accessed 1 September 2003)
- NCH . 2005 . Putting u in the picture: mobile bullying survey Available online at: http://www.stoptextbully.com/files/textbully_inserts.pdf (accessed 12 October 2008)
- Office of Communications . 2006 . Communications market report. Section 3: Telecommunications , London : Ofcom .
- Office of National Statistics . 2008 . Consumer durables: consumer durables ownership increases Available online at: http://www.statistics.gov.uk/CCI/nugget.asp?ID=868&Pos=3&ColRank=2&Rank=672 (accessed 15 October 2008)
- Olweus , D. 1993 . Bullying at school: what we known and what we can do , Oxford : Blackwell .
- Parry , G. 2005 . Camera/video phones in schools: law and practice . Education and Law , 17 (3) : 73 – 85 .
- Patchin , J. and Hinduja , S. 2006 . Bullies move beyond the schoolyard: a preliminary look at cyberbullying . Youth Violence and Juvenile Justice , 4 (2) : 148 – 169 .
- Pepler , D. , Jiang , D. , Craig , W. and Connolly , J. 2008 . Development trajectories of bullying and associated factors . Child Development , 79 (2) : 325 – 338 .
- Rivers , I. , Duncan , N. and Besag , V. E. 2007 . Bullying: a handbook for educators and parents , Westport , CT : Greenwood/Praeger .
- Rivers , I. and Smith , P. K. 1994 . Types of bullying behavior and their correlates . Aggressive Behavior , 20 (5) : 359 – 368 .
- Rudman , L. A. , Phelan , J. E. and Heppen , J. 2007 . Developmental sources of implicit attitudes . Personality and Social Psychology Bulletin , 33 (12) : 1700 – 1713 .
- Smith , P. K. , Mahdavi , J. , Carvalho , M. and Tippett , N. 2006 . An investigation into cyber bullying, its forms, awareness and impact, and the relationship between age and gender in cyber bullying Research Brief No. RBX03‐06 , London : Department for Education and Skills . Available online at: http://www.filemaker.co.uk/educationcentre/downloads/articles/Mobile_bullying_report.pdf (accessed 12 April 2009)
- Smith , P. K. , Mahdavi , J. , Carvalho , M. , Fisher , S. , Russell , S. and Tippett , N. 2008 . Cyberbullying: its nature and impact in secondary school pupils . Journal of Child Psychology and Psychiatry , 49 (4) : 376 – 385 .
- Solberg , M. E. and Olweus , D. 2003 . Prevalence estimation of school bullying with the Olweus Bully/Victim Questionnaire . Aggressive Behavior , 29 (3) : 239 – 268 .
- Sutton , J. , Smith , P. K. and Swettenham , J. 1999 . Bullying ‘theory of mind’: a critique of the ‘social skills deficit’ view of anti‐social behaviour . Social Development , 8 (1) : 117 – 127 .
- Turkle , S. 1995 . Life on the screen: identity in the age of the internet , London : Phoenix .
- Williams , K. R. and Guerra , N. G. 2007 . Prevalence and predictors of internet bullying . Journal of Adolescent Health , 41 (6) : 14 – 21 .
- WiredSafety . 2006 . Wired safety survey Available online at: https://www.wiredsafety.org/forms/interactive/poll_archive/poll.html (accessed 12 April, 2009)
- Wolak , J. , Mitchell , K. J. and Finkelhor , D. 2007 . Does online harassment constitute bullying? An exploration of online harassment by known peers and online‐only contacts . Journal of Adolescent Health , 41 (6, Supplement) : 51 – 58 .
- Ybarra , M. L. and Martin , S. 2008, personal communication . Unwanted sexual and harassing TXTs: a national survey of children and adolescents
- Ybarra , M. L. and Mitchell , J. K. 2004 . Online aggressors/targets, aggressors and targets: a comparison of associated youth characteristics . Journal of Child Psychology and Psychiatry , 45 (7) : 1308 – 1316 .
- Ybarra , M. L. , Diener‐West , M. , Markow , D. , Leaf , P. J. and Hamburger , M. 2008 . Linkages between internet violence and seriously violent behavior: findings from the Growing up with the Media national survey . Pediatrics , 122 (5) : 929 – 937 .
- Ybarra , M. L. , Mitchell , K. J. , Wolak , J. and Finkelhor , D. 2006 . Examining characteristics and associated distress related to Internet harassment: findings from the Second Youth Internet Safety Survey . Pediatrics , 118 (4) : 1169 – 1177 .
- Young , R. M. 1996a . NETDYNAM: some parameters of virtual reality Available online at: http://www.human-nature.com/rmyoung/papers/paper17.html (accessed 12 April, 2009)
- Young , R. M. 1996b . Psychoanalysis and/of the internet Available online at: http://www.human-nature.com/rmyoung/papers/paper36.html (accessed 12 April, 2009)