
ABSTRACT
This paper details the development and psychometric validation of the Everyday Colourism Scale (ECS), a measure designed to capture perceived skin shade prejudice from the ingroup (ethnic peers) and the outgroup (White people). The ECS was adapted from the Everyday Discrimination Scale using existing research, expert reviews, and acceptability interviews. Exploratory and confirmatory factor analysis, and reliability and validity analyses were conducted based on responses from 540 people of colour living in the UK. Predictive validity was tested based on data from an additional 201 participants. Results supported a 2-factor model, with good internal and test–retest reliability, and construct validity. Colourism from White people was associated with more frequent experiences of racism, higher internalized colourism, and greater anxiety. Colourism from participants’ ethnic peers was associated with lower self-esteem and perceived social support. Findings suggest the ECS is a promising new tool for assessing perceived colourism among a multi-ethnic UK sample.
Introduction
Colourism is a form of prejudice and discrimination based on skin shade penalizing those with dark skin (Dixon and Telles Citation2017). Though related to racism, colourism is a distinct phenomenon that occurs both within and between racialized/ethnic groups and affects people of colour globally (Dhillon-Jamerson Citation2018). Studies have demonstrated compelling evidence of colourism in a range of institutional settings including employment, education, and the justice system whereby people of colour with dark skin experience greater disadvantage compared with their peers belonging to the same racialized/ethnic group with light skin (e.g. Burch Citation2015; Monk Citation2019; Ryabov Citation2016). Colourism is also pervasive in global industries such as the media, advertising, beauty, fashion, and music where light skin is promoted and sold as symbolic of beauty, femininity, and social class (Jha Citation2015; Mitchell Citation2020; Shroff, Diedrichs, and Craddock Citation2018). Research has also documented the adverse health consequences of colourism, with people of colour with dark skin experiencing worse physical and mental health symptoms compared with peers from the same racialized/ethnic group who have light skin (see Keyes, Small, and Nikolova Citation2020 for a review).
The current literature provides valuable evidence showing how colourism affects the lives of people of colour. However, the majority of quantitative studies are based on either observed or self-reported skin shade (Harvey, Tennial, and Hudson Banks Citation2017). Yet, when considering the impact of prejudice and discrimination on health-related outcomes, it is valuable to also assess perceived discrimination. This is because subjective beliefs that one has experienced unfair treatment based on a personal characteristic (e.g. skin shade) can often explain more variance in individual health-related outcomes than objective data on the personal characteristic in question (Williams and Mohammed Citation2009).
Research consistently shows that perceived discrimination (based on personal characteristics such as racialized group, weight, and sexual orientation) is associated with worse physical and mental health (Pascoe and Smart Richman Citation2009). Therefore, perceived experiences of colourism are also likely to have negative health consequences for people of colour. However, to date, there are no validated measures of perceived experiences of colourism, limiting possible research in this area.
The need for a specific scale on perceived colourism
One of the most widely used general measures for perceived discrimination is Williams et al.’s (Citation1997) Everyday Discrimination Scale (EDS) (for a review of scales, see Bastos et al. Citation2010). Based on Essed’s (Citation1991) theory of everyday racism, the EDS measures perceived unfair treatment in everyday life. Studies testing the psychometric properties of the nine-item EDS show good reliability and construct validity as a unidimensional scale (e.g. Kessler, Mickelson, and Williams Citation1999; Krieger et al. Citation2005). However, though the EDS allows participants to identify skin colour as the main reason for their mistreatment, it does not capture the nuances and complexities of colourism. As Monk (Citation2021, 40) argues, “it is important to emphasize that colourism, as a form of perceived discrimination, is … unique”.
One other relevant scale on colourism currently exists. Harvey, Tennial, and Hudson Banks (Citation2017) developed the Ingroup Colourism Scale (ICS) to assess the degree to which skin shade variation is personally important across five domains (Self-Concept, Affiliation, Attraction, Impression Formation, and Upward Mobility). Harvey, Tennial, and Hudson Banks (Citation2017) reported good psychometrics for the scale. However, the ICS captures the internalization of colourism (i.e. the extent to which participants have adopted colourist ideals for themselves) rather than people's experiences of perceived colourism, and so it does not meet the requirements of the current study.
Several recent papers report differences on health and wellbeing outcomes in association with perceived ingroup and outgroup colourism based on the National Survey of American Life (NSAL) 2001–03 (Monk Citation2015, Citation2021; Oh, Lincoln, and Waldman Citation2021). The NSAL includes two single-items on perceived colourism with five response options from 0 (never) to 4 (very often):
“How often would you say that Whites treat you badly because of the shade of your skin colour (outgroup colourism)?”
“How often would you say that Blacks treat you badly because of the shade of your skin colour (ingroup colourism)?”
While Monk’s (Citation2015, Citation2021) and Oh, Lincoln, and Waldman (Citation2021)’s findings based on this nationally representative US dataset are illuminating in regard to the impact of perceived colourism for Black Americans, they are limited by their dependence on single-item measures as well as their focus on only Black and White racialized groups. Therefore, the development of a specific validated scale on perceived colourism is required to allow for rigorous assessments of experiences of colourism and investigation of how such experiences affect people’s lives.
The everyday colourism scale
We developed the Everyday Colourism Scale (ECS) to capture common experiences of perceived skin shade discrimination. Items include people’s perceptions of how they are treated or viewed due to their skin shade in comparison with peers of the same racialized group with lighter skin (e.g. do they feel they are perceived as less attractive?). Items also capture perceptions related to stereotypes associated with dark skin shades (e.g. participants are asked about the extent to which they are treated as less trustworthy, less educated, less affluent). Items are designed to be delivered twice based on experiences of colourism from people from the same broad racialized group (the ingroup) and then from White people (the outgroup) to distinguish between ingroup and outgroup experiences of colourism. White people were chosen as the outgroup in the present study as this research was conducted in the UK, which is majority (86 per cent) White (Census 2011). Moreover, White people historically created and/or systematically reinforced existing skin shade hierarchies in many countries around the world via their enslavement of people of colour and via colonialism (Dhillon-Jamerson Citation2018; Dixon and Telles Citation2017).
Items for the ECS were developed by the first and second authors (subject experts) and were reviewed by the fourth and sixth authors (social/health psychologists with expertise in appearance-based prejudice). Items on the nine-item Everyday Discrimination Scale (Williams et al. Citation1997) served as a foundation for the creation of a new colourism-specific scale. The development of new items was informed by findings from a recent qualitative study on adults’ experiences of colourism in the UK conducted by the first and second authors (Phoenix and Craddock Citation2022; Phoenix and Craddock in prep), as well as a review of the literature. This resulted in a pool of 42 items.
Next, six external subject matter experts (identified based on their existing publications on colourism) of different racialized/ethnic backgrounds were invited to review each item and indicate how relevant they considered the item (relevant/maybe relevant/not relevant/unsure) to the experience of colourism, in addition to providing suggestions for additional or redundant items. Four were able to review the items in the given timeframe. Based on this feedback and further qualitative item analysis (relevance of each item, wording of items, checking for redundancy across items) by the first and second authors, 15 items were removed due to repetition or being too specific, resulting in a total of 27 items remaining in the scale for further testing.
Finally, four acceptability interviews were conducted with individuals of colour who were members of the first two authors’ professional networks. These interviews further assessed the content validity and clarity of the measure. Interviewees raised an issue related to the specificity and directionality of the first 17 items (e.g. “because of my skin shade … people treat me with less respect”). To address this, a comparative clause was added to these items: “ … than other people who appear to be the same ethnicity as me but have lighter skin”.
The present work
Few studies have focused on colourism in the UK despite increased media attention on the topic (Phoenix and Craddock Citation2022). Therefore, an overarching objective of this paper is to present how colourism is perceived and experienced by people of colour in the UK. Such a goal is important, as evidence indicates that structural and institutional racism exacerbates long-standing health inequalities affecting ethnic minority groups in the UK (Razai, Majeed, and Esmail Citation2021). Consequently, understanding colourism and racism in tandem may eventually help us to tackle interethnic disparities in the UK and elsewhere. The first aim was to develop and psychometrically validate a scale of everyday experiences of colourism with a UK sample. The second was to test the predictive validity of a “perceived experiences of colourism” scale, examining associations with experiences of racism, internalized colourism, and health-related outcomes. Additionally, as colourism occurs both between and within racialized groups, the third aim was to explore whether and how experiences of colourism differ depending on whether they are perpetuated by people of the same racialized group (the ingroup) or White people (the outgroup).
Study 1
Following the initial development of the Everyday Colourism Scale (ECS) detailed above, Study 1 aimed to (1) establish the overall factor structure of the ECS among people of colour living in the UK based on experiences with people of the same racialized group and with White people, (2) test the internal consistency and test-retest stability of the ECS, and (3) present the descriptive statistics of the final scale and to explore whether there were differences in ECS scores by gender, broad racialized/ethnic group, UK region, and occupation category. Although colourism is often discussed as a gendered construct (Hall Citation2017; Hunter Citation2002), evidence is mixed in terms of how individuals experience and perceive colourism by gender. For example, after controlling for racialized/ethnic group, Perreira et al. (Citation2019) found skin shade was associated with greater odds of “fair”/ "poor” (as opposed to “good”) health in women but not men, though no differences by gender were observed for depressive symptoms. Meanwhile, Assari and Caldwell (Citation2017) found that Black Caribbean adolescent boys with dark skin perceived more discrimination than Black Caribbean adolescent girls with dark skin (as well as their peers with light skin), and speculated that this may be due to factors such as racial profiling and threat-based discrimination. Consequently, we did not make an a priori hypothesis based on ECS scores and gender. Similarly, we did not make a priori hypotheses for broad racialized/ethnic group, UK region, and occupation – rather, our intent was to present a more complete picture of perceived colourism in the UK.
Method
Procedure and participants
Participants were recruited using convenience sampling on social media and via Prolific. Inclusion criteria for participation were (i) aged 18 years or over, (ii) lived in the UK, and (iii) self-identification as a person of colour.
Two waves of data were collected during March–May 2021 using an online survey hosted on Qualtrics as part of a wider investigation on colourism in the UK. A total of 547 participants completed the Time 1 (T1) survey, which included informed consent, demographics questions, the ECS, and a series of additional measures presented randomly following the ECS. A subset of these participants (n = 139) completed a Time 2 (T2) survey approximately one week later. This second survey included ECS items and as well as three open-ended qualitative questions about the ECS, colourism in the UK and participation in the research. Ethical approval was granted by the University of the West of England ethics committee, HAS.21.01.092.
Based on those who provided complete data, participants were 540 (57.8 per cent women; Mage = 30.16 years, SD = 9.3) people of colour living in the UK. Over half of participants self-identified as Asian/Asian British (58.5 per cent) and a further 17.0 per cent identified as Black/Black British, closely reflecting the proportion of Asian and Black people in the 2011 Census.Footnote1 See for participant demographic information.
Table 1. Participant demographics for Study 1 (N = 540) and 2 (N = 201).
Additional measures
Skin shade
Skin shade was measured using a single-item self-report measure. Participants were asked, “compared with people of the same ethnic group as you, is your skin shade: Very dark, dark, medium, light, or very light?”.
Perceived racism
Perceived racism was assessed using nine-items from the Experiences of Discrimination Questionnaire (Krieger et al. Citation2005). Participants were asked to report if they “had ever experienced discrimination, been prevented from doing something, or been hassled or made to feel inferior because of their ‘race', ethnicity, or colour” in nine situations (e.g. at school, at work, on the street, or in a public setting). Participants were asked to respond to each item on a 4-point scale (1 = never, 2 = once, 3 = two-three times, 4 = four times or more) to create a scale variable whereby higher scores indicate more frequent lifetime experiences of racism. Internal consistency was good, Cronbach’s α = .83.
Qualitative open-ended questions
A free-text response box was provided at the end of Survey 1 for participants to share any general reflections. Then, three open-ended questions were included at the end of Survey 2 asking participants for (1) their thoughts on the ECS, (2) how they felt taking part in the research, and (3) if they had anything further that they would like to share about colourism in the UK or in response to participation.
Data analysis
Data were analysed using IBM SPSS version 28. Seven cases were omitted from analyses due to missing data. In total, 540 participants provided complete data on every item at T1. This sample was split into two comparable data sets using random assignment to run exploratory factor analyses (EFA; n = 270) and confirmatory factor analyses (CFA; n = 270). Parallel analysis (Hayton, Allen, and Scarpello Citation2004) and Velicer’s Minimum Average Partial (MAP) (Velicer, Eaton, and Fava Citation2000) were conducted to decide the number of factors to retain. With 27 original items, a sample of 270 met Nunnally and Bernstein’s (Citation1994) 10:1 participants-to-items ratio recommendation to minimize sampling error and to ensure the stability of factor analysis for the EFA.
Prior to formal EFA, a correlation matrix of the original 27 items was examined to assess the extent of correlation between items, whether items clustered, local dependence, and the number of times each item correlated with the other items with r > 0.4, and r > 0.5. These exploratory analyses identified some items which did not strongly correlate with the majority. To account for correlated factors, Principal Axis Factoring with the non-orthogonal direct oblimin rotation were used, testing ingroup and outgroup data separately. To determine the number of items to retain in the EFA, the Guttman-Kaiser criterion (Yeomans and Golder Citation1982), parallel analysis criterion (Horn Citation1965), and Velicer’s MAP were used. Items not correlated with other items and items which did not load onto any factor were tentatively removed from the analyses.
The stability of identified factors was assessed by using other factor extraction processes (e.g. maximum likelihood) and rotation schemes. Items temporarily removed from analysis were reconsidered to see if they would load on any identified factor. EFA was additionally performed using all of the data from the ingroup comparison and the outgroup comparison combined.
To confirm the goodness of fit of the number of factors identified in the EFA, a CFA was performed with the remaining 16 items. Model fit for the CFA was evaluated using the comparative fit index (CFI; Bentler Citation1990), Tucker-Lewis index (TLI; Tucker and Lewis Citation1973), root mean square error of approximation (RMSEA; Steiger Citation1980a), and minimum discrepancy per degree of freedom (CMIN/df). CFI and TLI values greater than 0.90 indicate adequate fit to the data (Hu and Bentler Citation1999). A RMSEA value smaller than 0.08 indicates good model fit, values between 0.08 and 0.10 indicate adequate fit, while values larger than 0.10 indicate poor fit (Schreiber et al. Citation2006). Finally, it is desirable to have CMIN/df < 5 (Kline Citation2011).
The stability (test-retest reliability) of the final ECS was determined using Pearson’s correlation coefficients comparing T1 and T2 scores (n = 139). The reliability of the global scale and two subscales was assessed using Cronbach's (Citation1951) alpha coefficients. Internal consistency is suggested to be acceptable when Cronbach's alpha is at least 0.70 (DeVellis and Thorpe Citation2021).
Convergent validity, a form of construct validity, was tested by examining Pearson’s correlation coefficients between ECS and experiences of racialized discrimination scores on the T1 data. Steiger’s (Citation1980b) test was used to compare overlapping correlated correlation coefficients and determine whether the extent of correlation of ECS scores with Experience of Discrimination scores differed between ECS ingroup and outgroup scores.
Results and discussion
Preliminary analyses
presents the percentage endorsement for all original items for the ECS based on ingroup and outgroup. Nine items (originally numbered 1–5 and 23–26) did not strongly correlate or consistently load onto factors irrespective of the number of factors considered. In addition, two potential sources of local dependency were identified (items 6–7 and 14–15) based on very high paired-correlations r = .90, r = .89 respectively for ingroup data and r = .88, r = .94 for outgroup data respectively, leading to the removal of Item 6 (People treat me with less courtesy …) and Item 15 (People view me as less educated …).
Table 2. Item means (possible range = 1-5) and percentage endorsement for all original items for the ingroup and outgroup data – Study 1 at T1 (N = 540).
Factor analyses
Results from parallel analysis and Velicer’s MAP indicated a consistent two factor solution, with the first factor capturing more subtle experiences of colourism while the second factor capturing more overt forms of colourism. Accordingly, Factor 1 was labelled “subtle” and Factor 2 was labelled “overt”. For the ingroup analyses, the first two eigenvalues were 9.24 (95 per cent CI: 7.68–10.80) and 2.40 (95 per cent CI: 2.00–2.80) and all other eigenvalues were less than 1. These two components accounted for 72.8 per cent of the total variation. For the outgroup analysis, the first two eigenvalues were 9.90 (95 per cent CI: 8.23–11.56) and 2.041 (95 per cent CI: 1.70–2.39) and all other eigenvalues were less than 1. These two components accounted for 74.9 per cent of the total variance. Velicer’s MAP, parallel analysis, and scree plots supported a two-factor solution for ingroup and outgroup (see ). The same items and factor structure were obtained using ingroup and outgroup data as shown in the pattern matrix in .
Figure 1. Scree plots for responses to the ECS based on ingroup and outgroup.
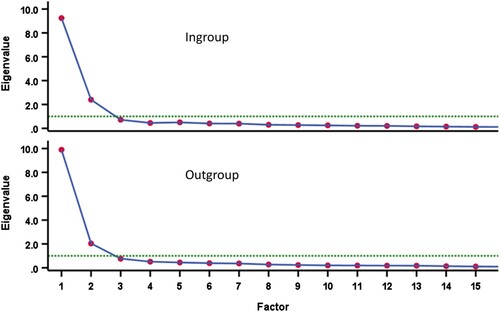
Table 3. Pattern matrices (coefficients under 0.3 suppressed) and corrected item-total correlation (CITC) for the ingroup and outgroup in EFA (Principal Axis factor with direct oblimin rotation) based on Study 1 data at T1 (N = 540).
Summed rating scales for Factor 1 and Factor 2 were created as an equally weighted total for the ingroup and outgroup. That is, scored items were added together to obtain a total score for Factor 1 (subtle) and scored items were added together to obtain a total score for Factor 2 (overt). also provides the corrected item-total correlation for ingroup and outgroup data for the summated rating scales derived from the two-factor solution. These corrected item-total correlations are large for each and every item, indicating that the items on each subscale measure the same underlying construct.
shows model fit statistics for the final CFA model based on ingroup and outgroup data. In both cases, the two-factor solution uncovered by EFA was considered and modification indices used to guide model re-specification, allowing the correlation of error terms. Permitting correlated error terms between Item 7 and 9 [respect/poor service], Item 11 and 13 [aggressive/threatening behaviour], Item 14 and 16 [intelligence/affluence] on Factor 1, and Item 20 and Item 22 [make fun of skin shade/attractiveness], and Item 22 and 27 [attractiveness/find a partner] on Factor 2, made good conceptual sense and formed the final re-specified model. The CFI scores based on ingroup and outgroup were ≥ 0.95 and the RMSEA values were 0.08, indicating acceptable fit. shows the overall covariance parameter estimates for the final model for ingroup and outgroup. Factor loadings for the scale were good, with all factor loadings above 0.5.
Figure 2. CFA Model of ECS – ingroup and outgroup.
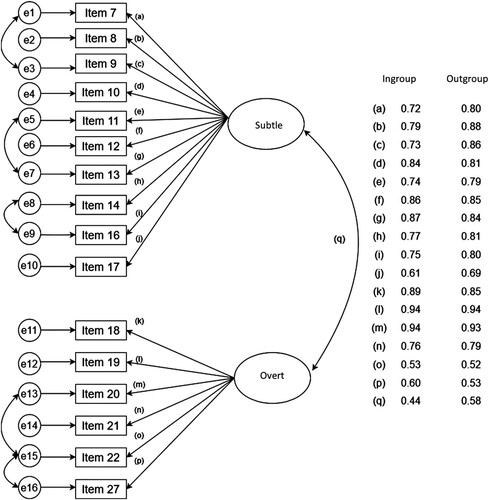
Table 4. CFA model fit statistics based on Study 1 and 2 data.
Internal reliability and test-Retest reliability
Internal consistency for the 16-item ECS and both subscales was high, ranging from α = 0.90 to 0.96. Test-retest analyses for the total scale score (sum of all items in the scale) and for the two subscales showed good reliability, ranging from r = .71 to .83. See .
Table 5. Internal Reliability and Test-Retest Reliability for EECS global and subscale scores – Cronbach’s α – Study 1, N = 540.
Convergent validity
Consistent with conceptualizations of colourism, correlation coefficients indicated that people who reported having darker (relative to lighter) skin reported more frequent experiences of both subtle and more explicit forms of colourism from both the ingroup and outgroup. Specifically, self-reported skin shade was significantly correlated with the global ECS score for the ingroup (r = .34, p < .001) and the global ECS score for the outgroup (r = .25, p < .001). Subscale scores ranged from r = .19, p < .01 for the outgroup overt subscale (Factor 2) to r = .31, p < .001 for the ingroup subtle subscale (Factor 1) score.
Subtle and overt subscale scores were correlated but not colinear based on experiences of colourism from participants’ ingroup (r = 0.52, p < .001, r2 = 26 per cent) and outgroup (r = 0.61, p < .001, r2 = 37.2 per cent). Analysis using the modified Pearson-Filon statistic for comparing correlated non-overlapping correlation coefficients (Raghunathan, Rosenthal, and Rubin Citation1996) indicated that the correlations between subscales were significantly greater in the outgroup than the ingroup, indicating a greater distinction between subscales when colourism is perpetrated by one’s own ethnic group. Similarly, correlation coefficients between total scores on Krieger’s Experiences of Discrimination scale and ECS (outgroup) were significantly higher than the correlation coefficients between Experiences of Discrimination and the ECS (ingroup). This finding suggests that perceived colourism from White people is more similar to how people of colour experience racism in the UK than perceived colourism from ethnic peers.
Experiences of colourism in the UK
Means and SDs ingroup and outgroup ECS total and subscale scores at T1 and T2 are presented in . Additional descriptive statistics (means and standard deviations for ingroup and outgroup colourism by gender, racialised group, geographic location, and occupation category) are presented in the Supplementary Files. Overall, mean total scores were low, indicating that on average participants experienced colourism “rarely” from their ingroup and slightly more frequently than “rarely” from White people. As most participants (83.1 per cent) in the present study reported having medium, light or very light skin compared with peers from the same ethnic group, this finding was unsurprising.
Table 6. Means and SDs of the global and subscale scores for everyday experiences of colourism from the ingroup and outgroup from Study 1 at T1 and T2 (possible range = 1–5).
Overall, perceived colourism scores were consistent across binary gender. When comparing women and men’s scores on the ECS, Welch separate variances t-tests indicated no significant differences for overall experiences of colourism based on the ingroup or the outgroup. Examining subscale scores, only means on the ingroup overt subscale significantly differed, with women reporting more direct experiences of colourism than men. For full descriptive and inferential statistics by gender, see Table 1 in the Supplementary Files.
When comparing the three largest broad racialized ethnic minority groups consistent with the UK Census categorizations, the mean ingroup and outgroup ECS total scores were significantly higher for Black participants compared with Asian and Mixed-Race participants, whose scores did not significantly differ from one another. Closer examinations separating South Asian and all other Asian (East, Southeast, and West) participants revealed Black participants reported significantly higher ingroup and outgroup colourism compared with both South Asian and Other Asian participants, while South Asian participants reported significantly higher ingroup and outgroup colourism compared with Other Asian participants. See Table 2a and Table 2b in the Supplementary Files for full information. Returning to the three largest broad racialized groups, comparisons while controlling for an interaction term between skin shade and racialized group revealed more nuanced insights. Overall, Black participants still reported more ingroup and outgroup colourism than their Asian and Mixed-Race peers. However, now results show Asian participants reported more outgroup colourism than their Mixed-Race counterparts. There was a negative trend for perceived ingroup colourism by skin shade for Black and Asian participants whereby higher ingroup colourism scores were reported among those who reported having a darker skin shade. This pattern was not observed for Mixed-Race participants. Interestingly, the gap between Asian and Black participants widens when participants report having lighter skin. For outgroup colourism, there is a negative trend by skin shade for Black, Asian, and Mixed-Race participants, though here, this trend remains relatively constant for each racialized group. See Table 2c for pairwise comparisons and Figure 1 for a graphic illustration in the Supplementary Files.
Turning to geographic location, no significant differences were found when comparing ECS scores of participants living in London (59.5 per cent White) and of those living elsewhere in the UK (91.5 per cent White) using Welch separate variances t-tests (see Table 3b in the Supplementary Files). Finally, comparisons were not made between occupation category as some of the groups are too small for meaningful analyses or interpretation. See Table 4 in the Supplementary Files for descriptive statistics on perceived ingroup and outgroup colourism by occupational category.
A total of 198 participants from Study 1 provided some form of brief qualitative response. Broadly, participants provided support for the relevance of the research as well as the ECS more specifically. Example responses can be found in the Supplementary Files, Table 5 and 6.
To conclude, data from Study 1 provides evidence to support a 16-item, two-factor scale of everyday experiences of colourism that is internally consistent, and reliable over a 1-week time period. Consistent with conceptualisations of colourism, people with self-reported dark skin reported more frequent experiences of colourism. Further, as expected, people who reported more frequent experiences of colourism reported more frequent general racialized experiences of discrimination. Women reported more frequent experiences of overt colourism from their ethnic peers compared with men. There were no other gender differences. Finally, in general, Black participants reported higher perceived ingroup and outgroup colourism compared with Asians and Mixed-Race ethnic minority participants.
Study 2
Having established the ECS’s factor structure, stability, and reliability in Study 1, the aims of Study 2 were (1) to confirm the factor structure with a second, independent sample and (2) to test its predictive validity. Conceptually, colourism and racism are related but distinct constructs; according to Dhillon-Jamerson (Citation2018) colourism is “a hierarchy within a hierarchy – the more palpable hierarchy being racism, with colourism mapped atop clandestinely” (2088). Therefore, at a theoretical level, experiences of colourism should signal a racialized hierarchy whereby light skin is valued over dark skin (Dixon and Telles Citation2017). In turn, colourism, when experienced (particularly from the outgroup) should prompt people to also perceive racism. Study 1 provided preliminary evidence of this via positive, significant correlation coefficients between ECS scores and Krieger’s Experience of Discrimination Scale scores. However, as the Krieger’s scale framed responses based on “race, ethnicity, or colour” the distinction between the perceived colourism scale and perceived racism scale is not as clear as it could have been. Therefore, in Study 2, we used two different measures of perceived racism and did not include skin colour in the question framing. We hypothesized that everyday colourism would predict experiences of racism in a linear model. We also argue that it is perceived colourism (as measured by the ECS) that should be particularly important in predicting perceived racism – thus we hypothesized that experiences of colourism would predict experiences of racism (DV) even when accounting for self-reported skin shade (covariate) – H1.
In turn, colourism, experienced repeatedly over the lifespan, is proposed to lead to people internalizing colourism – i.e. coming to believe in colourist values and stratification themselves (Harvey, Tennial, and Hudson Banks Citation2017). Consequently, and focusing on the theoretical distinction between colourism and racism (Dhillon-Jamerson Citation2018), we expected experiences of colourism to uniquely predict internalized colourism (DV) when also factoring in self-reported skin shade (covariate 1) and experiences of racism (covariate 2) in the model – H2.
Next, to further investigate the usefulness of a specific scale capturing the experiences of skin shade discrimination (i.e. colourism), we examined the relationships between experiences of colourism and a number of psychological wellbeing and health outcomes. This approach is consistent with the conceptualization of discrimination as a form of stress (Brondolo et al. Citation2005). Prior research also indicates that greater frequency discrimination negatively predicts health, psychological wellbeing, and life satisfaction (Pascoe and Smart Richman Citation2009; Schmitt et al. Citation2014). Therefore, we hypothesized that experiences of colourism would be associated with increased anxiety as well as reduced self-esteem, social support, life satisfaction, and general perceived health. Further, we hypothesized that perceived colourism is associated with these variables over and above self-reported skin shade and experiences of racism, indicating that colourism is a unique form of discrimination – H3.
Finally, recent research exploring health-related outcomes of interracial and intra-racial colourism among African Americans found perceived colourism from Black peers was associated with worse physical (Monk Citation2021) and mental health (Oh, Lincoln, and Waldman Citation2021) outcomes than was perceived colourism from White people. Therefore, we examined the role of ECS scores based on ingroup and outgroup perpetration of colourism separately to assess if they account for unique variance on the outcome variables.
Method
Procedure and participants
A total of 218 participants were recruited via Prolific in September 2021. Inclusion criteria for Study 1 were retained and two exclusion criteria were added: participants were not eligible to participate if (i) they had participated in Study 1 and (ii) they answered one or more (of three) attention checks incorrectly. A total of 17 participants did not pass the attention checks so were excluded from analysis, leaving a total sample of N = 201 (61.2 per cent women). Sample demographics are provided in .
Participants completed a brief online survey, lasting approximately 15 minutes. Participants were paid based on a set rate of £7.50 per hour. A priori power calculations indicated that a hierarchical linear model with up to seven predictor variables based on a sample size of N = 200 would have 80 per cent power to detect a change in R2 of 0.05 attributable to the ECS variables. Details of this study were pre-registered on Open Science Framework https://osf.io/8upqc.
Measures
The demographic questions and the 16-item ECS detailed in Study 1 were administered (presented twice: ingroup and outgroup). Additional self-reported measures are detailed in . Further, two open-ended questions were included at the end of the survey asking participants for feedback on the ECS and about their experiences taking part in the study more generally.
Table 7. Additional measures used in Study 2 to assess predictive validity.
Data analysis
All analyses were conducted on SPSS version 28. Descriptive statistics for all variables were calculated and the assumptions for analyses were checked and met.
To test H1, two hierarchical analyses were performed to determine whether ECS scores (from the ingroup and outgroup) could account for unique variance in perceived experiences of racism (as measured by the Everyday Discrimination Scale and Schedule of Racist Events) over and above self-reported skin shade. Self-reported skin shade variables (Likert-type scale score and based on skin shade chart) were entered at Step 1 and the two total scores for ECS (from the ingroup and outgroup) were entered at Step 2. Everyday Discrimination Scale scores and Schedule of Racist Events scores were entered as dependent variables. To test H2, a hierarchical model was run to test if ECS (from ingroup and outgroup) scores (entered at Step 1) contribute any unique variance in internalized colourism when self-reported skin shade and experiences of racism are also included in the model at Step 2 and Step 3.
To test H3, five hierarchical models were performed to determine whether ECS (from ingroup and outgroup) could account for unique variance in health and wellbeing related outcomes (namely: anxiety, self-esteem, perceived social support, life satisfaction and self-reported health) over and above (1) self-reported skin shade, (2) perceived racism and (3) internalized colourism. For each model, self-reported skin shade variables (Likert scale score and based on skin shade chart) were entered at Step 1, ingroup and outgroup ECS were entered at Step 2, the ICS assessing internalized colourism was entered at Step 3, and the two measures for perceived racism were entered at Step 4. Collinearity diagnostics indicated no problematic multi-collinearity (all VIFs < 3.6).
Results and discussion
Model fit statistics for the CFA based on ingroup and outgroup data are presented in . The CFI and TLI scores for ingroup and outgroup data were ≥ 0.92 indicating adequate fit, and the RMSEA values were 0.08, indicating acceptable model fit. Descriptive statistics and correlations for Study 2 are shown in . Results for Hypotheses 1 and 2 are displayed in while results for Hypothesis 3 are shown in , and .
Table 8. Study 2 variable correlations (N = 201).
Table 9. Hierarchical model predicting racialized discrimination and internalized colourism, Study 2 (N = 201).
Table 10. Hierarchical model predicting general anxiety and self-esteem, Study 2 (N = 201).
Table 11. Hierarchical model predicting perceived social support and life satisfaction, Study 2 (N = 201).
Table 12. Hierarchical model predicting self-reported general health, Study 2 (N = 201).
ECS scores from both the ingroup and outgroup predicted more frequent experiences of racism measured by the Everyday Discrimination Scale, even when the two measures of self-reported skin shade were included in the model. Only ECS scores from White people predicted more frequent experiences of racism measured by the Schedule for Racist Events, when two measures of self-reported skin shade were included in the model. These findings partially confirm H1 and suggests that people who are more likely to experience colourism from White people are more likely to experience racism regardless of self-reported skin colour. In partial support of H2, experiences of colourism from White people, but not ethnic group peers, predicted internalized colourism when accounting for self-reported skin shade and experiences of racism.
and shows that everyday experiences of colourism from participants’ ethnic group peers predicted (a) lower self-esteem and (b) lower perceived social support when controlling for skin shade, experiences of racism, and internalized colourism. Experiences of colourism from White people did not add unique variance in either of these models. In contrast, ECS scores from White people but not racialized/ethnic peers predicted general anxiety when skin shade and internalized colourism were included in the model. However, significant findings were not maintained at Step 4 when the two experiences of racism scores were entered in the model. Taken together, results find partial support for H3.
Further, as seen in and , neither ingroup nor outgroup colourism predicted life satisfaction or general health. Finally, qualitative data in response to the open-ended questions were broadly positive, supporting the value of the research and the relevance of the items on the ECS. Example responses can be found in the Supplementary Files in Tables 5 and 6.
General discussion
This paper aimed to develop and test the psychometric validity of the ECS, a measure designed to assess perceived everyday experiences of colourism from ingroup and outgroup members. While multiple measures of discrimination based on racialized/ethnic groups exist (Bastos et al. Citation2010), to date there has not been a validated measure that specifically captures the unique experience of perceived colourism. The current research addresses this gap by developing a reliable and valid scale to assess everyday experiences of colourism based on the widely used Everyday Discrimination Scale (Williams et al. Citation1997).
Drawing on two multi-ethnic samples of participants living in the UK, results indicated that the ECS demonstrated high internal consistency and good test-retest reliability. A two-factor structure (overt and subtle everyday experiences of colourism) was found in the initial sample (Study 1) and confirmed in a second sample (Study 2). Study 1 provides initial construct validity as, consistent with conceptualizations of colourism, people of colour with dark (relative to light) skin reported more frequent experiences of colourism from peers of the same ethnicity and from White people. Further, as expected, ECS scores were positively correlated with the Experiences of Discrimination Scale (Krieger et al. Citation2005), a measure of societal experiences of discrimination across multiple domains. This finding suggests the ECS has good convergent validity and indicates the ECS is measuring a unique form of discrimination. See Appendix 1 for the final 16 items.
Everyday Colourism Scale scores ranged from never experiencing poor treatment based on skin shade to always experiencing skin shade discrimination for each item. Mean global ECS scores based on the ingroup and outgroup were low, indicating participants only rarely experienced colourism in their daily lives. However, this finding should be considered in light of the fact that only 16.8 per cent of participants in Study 1 and 13.9 per cent of participants in Study 2 reported having “dark” or “very dark” skin compared with their ethnic-group peers. Notably, results showed slightly higher global outgroup ECS scores compared with global ingroup ECS scores indicating that participants perceived slightly more frequent experiences of colourism from White people than they did from their ethnic-group peers. Though colourism is often discussed as an intra-racialized group issue (Dhillon-Jamerson Citation2018), evidence from the current research highlights the presence of colourism from White people on an interpersonal basis.
Descriptively, a closer examination of data from Study 1 indicated that subtle (but not overt) experiences of colourism from White people were more frequent than from people of the same racialized/ethnic group. This finding is consistent with Dhillon-Jamerson (Citation2018)’s articulation of colourism from White people being more “covert”. Though we did not make a priori hypotheses by gender, results showed no significant differences when comparing women and men’s ECS global or subscale scores with one exception. Women reported higher ECS scores in response to the overt subscale based on perceived experiences of colourism from the ingroup. This finding is consistent with qualitative research exploring ingroup colourism (e.g. within families and peer groups), where women and girls often report being the target of explicit colourist comments (e.g. Hall Citation2017; Wilder Citation2010; Wilder and Cain Citation2011). Additionally, data from Study 1 suggested that Black people perceive colourism more frequently than Asian or Mixed-Race participants. Further, the finding that there did not seem to be a relationship between skin shade and ECS ingroup scores among Mixed-Race participants indicates that ECS may not work as neatly for Mixed-Race individuals, which will be discussed more below. Finally, data from Study 1 found that there were no differences in perceived ingroup or outgroup colourism based on whether participants lived in London (59.5 per cent White) or elsewhere in the UK (91.5 per cent White).
Findings from Study 2, which focused on predictive validity, support the usefulness of the ECS. First, we hypothesized that ECS scores would predict experiences of racism. ECS scores predicted perceived experiences of racism over and above self-reported skin shade, with experiences of colourism from White people contributing the most variance to the model. Such results support the use of the ECS over self-reported skin shade to understand how people of colour experience racism.
Second, we hypothesized that ECS scores would predict greater internalized colourism. Results demonstrated that experiences of colourism from White people (but not from ethnic peers) contributed to internalized colourism over self-reported skin shade. This relationship was maintained when the two measures assessing experiences of racism were added to the model. This finding indicates perceived colourism from White people measured by the ECS is robustly associated with how individuals internalize colourist beliefs. Given that this study was conducted in the UK, a majority White country, it is perhaps unsurprising that it is perceived colourism from White people that is associated with people of colour’s views on skin shade in relation to constructs such as social mobility, attractiveness, and impression formation (Harvey, Tennial, and Hudson Banks Citation2017).
Third, based on prior theoretical and empirical work positioning perceived discrimination (including colourism) as a form of stress impacting health (Brondolo et al. Citation2005; Monk Citation2015, Citation2021; Oh, Lincoln, and Waldman Citation2021), we hypothesized that ECS scores would predict a range of health and wellbeing outcomes. These assertions were partially supported in the present study. Findings indicated a pattern based on ingroup and outgroup ECS scores. Specifically, higher ingroup but not outgroup ECS scores predicted lower self-esteem and perceived social support when skin shade, internalized colourism, and perceived racism were included in the model. Such results are consistent with prior research indicating that ingroup colourism is associated with worse health-related outcomes (Monk Citation2021; Oh, Lincoln, and Waldman Citation2021). Conversely, a reverse pattern was found for anxiety whereby higher outgroup but not ingroup ECS scores predicted higher anxiety scores when skin shade and internalized colourism were included in the model, though this finding became non-significant when the two measures of racism were added to the model. This pattern based on perceived colourism from the ingroup and outgroup in relation to different health-related outcomes warrants further investigation.
Taken together, findings from Study 2 confirm the reliability and factor structure of the ECS. Further, the differential ways that colourism at the hands of the ingroup vs. outgroup is associated with meaningful outcomes – including internalized colourism, self-esteem, perceived discrimination, and perceived social support – underscore the utility of the scale. Our results suggest that self-esteem and perceived social support are robustly associated with ingroup colourism. Colourism from the outgroup (White people), however, is associated with anxiety, perceived racialized discrimination, and internalized colourism. It is noteworthy that reports of perceived colourism, despite being relatively uncommon in the present sample, are associated with racialized discrimination, internalized colourism, and negative wellbeing outcomes over and above two measures of self-reported skin shade, particularly as self-reported skin shade itself – a form of “subjective social status” is important when investigating such factors (Monk Citation2015, 412). Future work should use our scale to further disentangle how colourism from the ingroup vs. outgroup is associated, or affects, health, wellbeing, and outlook.
Strengths, limitations, and future directions
The present work has several important strengths. First, the development of the ECS involved a rigorous multi-step process, including a literature review, consultation with subject experts of different ethnic backgrounds, and acceptability interviews with individuals of different ethnic backgrounds. Second, the subsequent validation of the ECS was based on two multi-ethnic samples. Third, the majority non-student sample overcomes a common limitation in many psychology studies, bolstering the ecological validity of the findings. Therefore, the 16-item ECS allows for a good snapshot of perceived inter-and intra-racialized group colourism among people of colour living in the UK regardless of racialized group.
However, the present findings should be interpreted in light of several limitations. First, the final ECS only captured negative discrimination associated with skin shade. Accordingly, it may not fully reveal the advantages or privileges (i.e. positive discrimination) afforded to people of colour with lighter skin over their ethnic peers with dark skin. Second, the ECS only considers experiences of colourism from ingroup members based on broad racialized/ethnic groups. It may be useful to differentiate the ingroup further – for example, considering family members since prior research on colourism highlights the common occurrence and negative impact of colourism within families (Hall Citation2017; Phoenix and Craddock Citation2022; Wilder and Cain Citation2011). The impact of ingroup colourism from family members may be more salient than colourism from other members of the same racialized group but who are not known to individuals.
Third, the ECS does not incorporate other phenotypical features (e.g. hair texture, nose/lips/eye shape) that are sometimes included in definitions of colourism (as these features relate to an individual’s proximity to Whiteness; Hunter Citation2007; Reece Citation2019). The decision to focus on skin shade was a practical one; the ECS was developed for a multi-ethnic sample and while certain phenotypic features might be salient to one group in the experience of colourism, they might not be as relevant to others. Future research may wish to consider adding items pertaining to phenotype when validating the scale for specific ethnic group samples. Fourth, data indicated that the scale may work less well for Mixed-Race individuals as comparisons with other Mixed-Race people are less well defined. This was highlighted in the qualitative data from across the two studies; as one Mixed-Race female participant wrote, “[I] sometimes got confused as to whether I was answering as to how other Mixed-Race people see me or how all Black people see me”. Therefore, the utility of the scale with this heterogenous group should be explored further and if appropriate, adjusted accordingly.
Taken together, it should be acknowledged that the ECS does not capture all the nuances and complexities of colourism. Finally, as the focus of the scale is on perceived experiences of colourism, this scale does not capture actual experiences and so scores may reflect over or underestimations of reality. A few participants highlighted challenges in discerning the cause of their perceived poor treatment by others, perhaps particularly when they occupied multiple marginalized identities/characteristics. Future research would benefit from a more intersectional approach to start to address this. However, by capturing perceived or subjective experiences of colourism, this work contributes to existing literature and can be triangulated with studies that examine assessments of skin shade with targeted outcome variables.
Considering methodological limitations and constraints for generalizability, though the overall sample size was adequate (re: participant: item ratio), larger sample sizes would have been beneficial for both studies. For example, due to sample size constraints, we did not test for invariance across racialized/ethnic groups. Such tests will form an important direction for future research as recent evidence suggests that perceived racial/ethnic discrimination measured by the EDS – the scale the ECS is based on – is not neatly comparable across racialized groups (Bastos and Harnois Citation2020).
Future research would also benefit from closer examinations of perceived colourism according to factors such as how frequently individuals interact with White people and people of the same racialised group as them. For example, people in different locations may be differentially exposed to or sheltered from intergroup contact. Likewise, people working in certain professions may be exposed to a broader range of people than those in other professions. Future work would benefit by systematically examining the social context of those reporting colourism, to work to understand how colourist experiences are linked to peoples’ broader environments and demographics. In addition, as colourism is considered a global issue (Dixon and Telles Citation2017), it would be valuable to validate the scale in different sociocultural contexts and countries as it cannot be assumed that findings based on a multi-ethnic UK sample are generalizable globally. Future applications of the scale could explore whether majority/minority ethnicity status makes a difference in countries where the majority are people of colour.
Conclusion
To the best of our knowledge, the ECS is the first validated multi-item measure of perceived colourism that incorporates inter- and intra-racialized group discrimination. The ECS allows researchers to capture perceived experiences of colourism more precisely than existing measures of perceived discrimination based on skin shade. By repeating questions twice, asking participants to consider their experiences based on their ethnic group peers as well as White people, the ECS allows for variation by perpetuating group to be captured, thereby advancing understandings of colourism. Consequently, this scale allows for a deeper understanding of how colourism is experienced. It is hoped that the development of this scale will propel research into the causes and consequences of colourism. Such research could inform macro and individual level interventions to tackle societal level colourism and circumvent the individual harms caused by skin shade prejudice and discrimination.
RERS-2022-0039-File005.docx
Download MS Word (128.1 KB)RERS-2022-0039-File004.docx
Download MS Word (16.7 KB)Acknowledgements
The author would like to first thank the participants who shared their experiences and perspectives for this research. Second, we also thank the subject experts for generously providing feedback on the Everyday Colourism Scale and to those who took part in cognitive interviews. Finally, we thank the community organizations and individuals who helped amplify this work during recruitment, helping us reach more people.
Disclosure statement
No potential conflict of interest was reported by the author(s).
Additional information
Funding
Notes
1 According to the UK Census 2011, 61.5 per cent of people living in England or Wales who belong to a Black, Asian, Mixed or Other ethnic group are Asian/Asian British while 23.1% are Black/African/Caribbean/Black British.
References
- Assari, S., and C. H. Caldwell. 2017. “Darker Skin Tone Increases Perceived Discrimination Among Male but Not Female Caribbean Black Youth.” Children 4 (12): 107. doi:10.3390/children4120107.
- Bastos, J. L., R. K. Celeste, E. Faerstein, and A. J. Barros. 2010. “Racial Discrimination and Health: A Systematic Review of Scales with a Focus on Their Psychometric Properties.” Social Science & Medicine 70 (7): 1091–1099. doi:10.1016/j.socscimed.2009.12.020.
- Bastos, J. L., and C. E. Harnois. 2020. “Does the Everyday Discrimination Scale Generate Meaningful Cross-Group Estimates? A Psychometric Evaluation.” Social Science & Medicine 265: 113321. doi:10.1016/j.socscimed.2020.113321.
- Bentler, P. M. 1990. “Comparative Fit Indexes in Structural Models.” Psychological Bulletin 107 (2): 238. doi:10.1037/0033-2909.107.2.238.
- Brondolo, E., K. P. Kelly, V. Coakley, T. Gordon, S. Thompson, E. Levy, A. Cassells, J. N. Tobin, M. Sweeney, and R. J. Contrada. 2005. “The Perceived Ethnic Discrimination Questionnaire: Development and Preliminary Validation of a Community Version 1.” Journal of Applied Social Psychology 35 (2): 335–365. doi:10.1111/j.1559-1816.2005.tb02124.x.
- Burch, T. 2015. “Skin Colour and the Criminal Justice System: Beyond Black-White Disparities in Sentencing.” Journal of Empirical Legal Studies 12 (3): 395–420. doi:10.1111/jels.12077.
- Cronbach, L. J. 1951. “Coefficient Alpha and the Internal Structure of Tests.” Psychometrika 16 (3): 297–334. doi:10.1007/BF02310555.
- DeVellis, R. F., and C. T. Thorpe. 2021. Scale Development: Theory and Applications. Thousand Oaks, CA: Sage Publishing.
- Dhillon-Jamerson, K. K. 2018. “Euro-Americans Favoring People of Colour: Covert Racism and Economies of White Colourism.” American Behavioral Scientist 62 (14): 2087–2100. doi:10.1177/0002764218810754.
- Diener, E. D., R. A. Emmons, R. J. Larsen, and S. Griffin. 1985. “The Satisfaction with Life Scale.” Journal of Personality Assessment 49 (1): 71–75. doi:10.1207/s15327752jpa4901_13
- Dixon, A. R., and E. E. Telles. 2017. “Skin Colour and Colourism: Global Research, Concepts, and Measurement.” Annual Review of Sociology 43: 405–424. doi:10.1146/annurev-soc-060116-053315.
- Essed, P. 1991. Understanding Everyday Racism: An Interdisciplinary Theory. Thousand Oaks, CA: Sage Publishing.
- Hall, J. C. 2017. “No Longer Invisible: Understanding the Psychosocial Impact of Skin Colour Stratification in the Lives of African American Women.” Health & Social Work 42 (2): 71–78. doi:10.1093/hsw/hlx001.
- Harvey, R. D., R. E. Tennial, and K. Hudson Banks. 2017. “The Development and Validation of a Colourism Scale.” Journal of Black Psychology 43 (7): 740–764. doi:10.1177/0095798417690054.
- Hayton, J. C., D. G. Allen, and V. Scarpello. 2004. “Factor Retention Decisions in Exploratory Factor Analysis: A Tutorial on Parallel Analysis.” Organizational Research Methods 7 (2): 191–205. doi:10.1177/1094428104263675.
- Horn, J. L. 1965. “A Rationale and Test for the Number of Factors in Factor Analysis.” Psychometrika 30 (2): 179–185. doi:10.1007/BF02289447.
- Hu, L. T., and P. M. Bentler. 1999. “Cutoff Criteria for Fit Indexes in Covariance Structure Analysis: Conventional Criteria Versus New Alternatives.” Structural Equation Modeling: A Multidisciplinary Journal 6 (1): 1–55. doi:10.1080/10705519909540118.
- Hunter, M. L. 2002. ““If You're Light You're Alright” Light Skin Colour as Social Capital for Women of Colour.” Gender & Society 16 (2): 175–193. doi:10.1177/08912430222104895.
- Hunter, M. L. 2007. “The Persistent Problem of Colourism: Skin Tone, Status, and Inequality.” Sociology Compass 1 (1): 237–254. doi:10.1111/j.1751-9020.2007.00006.x.
- Jha, M. R. 2015. The Global Beauty Industry: Colourism, Racism, and the National Body. New York, NY: Routledge.
- Kessler, R. C., K. D. Mickelson, and D. R. Williams. 1999. “The Prevalence, Distribution, and Mental Health Correlates of Perceived Discrimination in the United States.” Journal of Health and Social Behavior 40 (3): 208–230. doi:10.2307/2676349.
- Keyes, L., E. Small, and S. Nikolova. 2020. “The Complex Relationship Between Colourism and Poor Health Outcomes with African Americans: A Systematic Review.” Analyses of Social Issues and Public Policy 20 (1): 676–697. doi:10.1111/asap.12223.
- Kline, R. 2011. “Convergence of Structural Equation Modeling and Multilevel Modeling.” In Handbook of Innovation in Social Research Methods, edited by M. Williams, 562–589. Thousand Oaks, CA: Sage Publishing. doi:10.4135/9781446268261.
- Krieger, N., K. Smith, D. Naishadham, C. Hartman, and E. M. Barbeau. 2005. “Experiences of Discrimination: Validity and Reliability of a Self-Report Measure for Population Health Research on Racism and Health.” Social Science & Medicine 61 (7): 1576–1596. doi:10.1016/j.socscimed.2005.03.006.
- Landrine, H., and E. A. Klonoff. 1996. “The Schedule of Racist Events: A Measure of Racial Discrimination and a Study of Its Negative Physical and Mental Health Consequences.” Journal of Black Psychology 22 (2): 144–168. doi:10.1177/00957984960222002.
- Mitchell, T. A. 2020. “Critical Race Theory (CRT) and Colourism: A Manifestation of Whitewashing in Marketing Communications?” Journal of Marketing Management 36 (13–14): 1366–1389. doi:10.1080/0267257X.2020.1794934
- Monk, E. P. 2015. “The Cost of Colour: Skin Colour, Discrimination, and Health Among African-Americans.” American Journal of Sociology 121 (2): 396–444. doi:10.1086/682162.
- Monk, E. P. 2019. “The Colour of Punishment: African Americans, Skin Tone, and the Criminal Justice System.” Ethnic and Racial Studies 42 (10): 1593–1612. doi:10.1080/01419870.2018.1508736.
- Monk, E. P. 2021. “Colourism and Physical Health: Evidence from a National Survey.” Journal of Health and Social Behavior 62 (1): 37–52. doi:10.1177/0022146520979645.
- Nunnally, J. C., and I. J. Bernstein. 1994. Psychometric Theory. New York: McGraw-Hill.
- Oh, H., K. Lincoln, and K. Waldman. 2021. “Perceived Colourism and Lifetime Psychiatric Disorders Among Black American Adults: Findings from the National Survey of American Life.” Social Psychiatry and Psychiatric Epidemiology 56 (8): 1509–1512. doi:10.1007/s00127-021-02102-z.
- Pascoe, E. A., and L. Smart Richman. 2009. “Perceived Discrimination and Health: A Meta-Analytic Review.” Psychological Bulletin 135 (4): 531. doi:10.1037/a0016059.
- Perreira, K. M., J. Wassink, and M. H. Kathleen. 2019. “Beyond Race/Ethnicity: Skin Colour, Gender, and the Health of Young Adults in the United States.” Population Research and Policy Review 38 (2): 271–299. doi:10.1007/s11113-018-9503-3.
- Phoenix, A., and N. Craddock. 2022. “Black Men’s Experiences of Colourism in the UK.” Sociology 56 (5): 1015–1031. doi:10.1177/00380385211069507.
- Raghunathan, T. E., R. Rosenthal, and D. B. Rubin. 1996. “Comparing Correlated but Nonoverlapping Correlations.” Psychological Methods 1 (2): 178–183. https://psycnet.apa.org; doi:10.1037/1082-989X.1.2.178
- Razai, M. S., A. Majeed, and A. Esmail. 2021. “Structural Racism is a Fundamental Cause and Driver of Ethnic Disparities in Health.” BMJ 373: m4921. doi:10.1136/bmj.n938
- Reece, R. L. 2019. “Colour Crit: Critical Race Theory and the History and Future of Colourism in the United States.” Journal of Black Studies 50 (1): 3–25. doi:10.1177/0021934718803735.
- Rosenberg, M. 1965. Society and the Adolescent Self-image. Princeton, NJ: Princeton University Press.
- Ryabov, I. 2016. “Colourism and Educational Outcomes of Asian Americans: Evidence from the National Longitudinal Study of Adolescent Health.” Social Psychology of Education 19 (2): 303–324. doi:10.1007/s11218-015-9327-5.
- Schmitt, M. T., N. R. Branscombe, T. Postmes, and A. Garcia. 2014. “The Consequences of Perceived Discrimination for Psychological Well-Being: A Meta-Analytic Review.” Psychological Bulletin 140: 921–948. doi:10.1037/a0035754
- Schreiber, J. B., A. Nora, F. K. Stage, E. A. Barlow, and J. King. 2006. “Reporting Structural Equation Modeling and Confirmatory Factor Analysis Results: A Review.” The Journal of Educational Research 99 (6): 323–338. doi:10.3200/JOER.99.6.323-338.
- Shroff, H., P. C. Diedrichs, and N. Craddock. 2018. “Skin Colour, Cultural Capital, and Beauty Products: An Investigation of the Use of Skin Fairness Products in Mumbai, India.” Frontiers in Public Health 5: 365. doi:10.3389/fpubh.2017.00365
- Spitzer, R. L., K. Kroenke, J. B. Williams, and B. Löwe. 2006. “A Brief Measure for Assessing Generalized Anxiety Disorder: The GAD-7.” Archives of Internal Medicine 166 (10): 1092–1097. doi:10.1001/archinte.166.10.1092.
- Steiger, J. H. 1980a. Statistically Based Tests for the Number of Common Factors. In The Annual Meeting of the Psychometric Society, Iowa City, IA.
- Steiger, J. H. 1980b. “Tests for Comparing Elements of a Correlation Matrix.” Psychological Bulletin 87 (2): 245–251. doi:10.1037/0033-2909.87.2.245.
- Tucker, L. R., and C. Lewis. 1973. “A Reliability Coefficient for Maximum Likelihood Factor Analysis.” Psychometrika 38 (1): 1–10. doi:10.1007/BF02291170.
- Velicer, W. F., C. A. Eaton, and J. L. Fava. 2000. “Construct Explication through Factor or Component Analysis: A Review and Evaluation of Alternative Procedures for Determining the Number of Factors or Components.” In Problems and Solutions in Human Assessment Honoring Douglas N. Jackson at Seventy, edited by R. D. Goffin and E. Helmes, 41–71. New York, NY: Kluwer Academic.
- Wilder, J. 2010. “Revisiting “Colour Names and Colour Notions”: A Contemporary Examination of the Language and Attitudes of Skin Colour Among Young Black Women.” Journal of Black Studies 41 (1): 184–206. doi:10.1177/0021934709337986.
- Wilder, J., and C. Cain. 2011. “Teaching and Learning Colour Consciousness in Black Families: Exploring Family Processes and Women's Experiences with Colourism.” Journal of Family Issues 32 (5): 577–604. doi:10.1177/0192513X10390858.
- Williams, D. R., and S. A. Mohammed. 2009. “Discrimination and Racial Disparities in Health: Evidence and Needed Research.” Journal of Behavioral Medicine 32 (1): 20–47. doi:10.1007/s10865-008-9185-0.
- Williams, D. R., Y. Yu, J. Jackson, and N. Anderson. 1997. “Racial Differences in Physical and Mental Health: Socioeconomic Status, Stress and Discrimination.” Journal of Health Psychology 2 (3): 335–351. doi:10.1177/135910539700200305
- Yeomans, K. A., and P. A. Golder. 1982. “The Guttman-Kaiser Criterion as a Predictor of the Number of Common Factors.” The Statistician 31 (3): 221–229. doi:10.2307/2987988.
- Zimet, G. D., N. W. Dahlem, S. G. Zimet, and G. K. Farley. 1988. “The Multidimensional Scale of Perceived Social Support.” Journal of Personality Assessment 52 (1): 30–41. doi:10.1207/s15327752jpa5201_2
Appendix 1.
(Simplified) Everyday Colourism Scale
Please state the which broad racialized/ethnic group (e.g. Black, East Asian, South Asian etc.) you most identify with: _________________________
Thinking about how you perceive people of the same racialized/ethnic group treat you based on your skin shade, please respond to the following items using the scale below. For each item, please indicate to what extent you feel the experience is true for you.
Ingroup
Subtle Subscale (n = 10 items)
Because of my skin shade I feel … .
[Insert participant’s racialized group/ethnicity] people treat me with less respect than they do other [insert participant’s racialized group/ethnicity] people who have lighter skin.
[Insert participant’s racialized group/ethnicity] people treat me with greater suspicion than they do other [insert participant’s racialized group/ethnicity] people who have lighter skin.
I receive poorer service from [insert participant’s racialized group/ethnicity] people compared with other [insert participant’s racialized group/ethnicity] people who have lighter skin.
[Insert participant’s racialized group/ethnicity] people avoid me in public spaces (e.g. on public transport or in the street) more than they do other [insert participant’s racialized group/ethnicity] people who have lighter skin.
[Insert participant’s racialized group/ethnicity] people view me as more aggressive than they do other [insert participant’s racialized group/ethnicity] people who have lighter skin.
[Insert participant’s racialized group/ethnicity] people view me as less trustworthy than they do other [insert participant’s racialized group/ethnicity] people who have lighter skin.
[Insert participant’s racialized group/ethnicity] people view me as more threatening than they do other [insert participant’s racialized group/ethnicity] people who have lighter skin.
[Insert participant’s racialized group/ethnicity] people view me as less intelligent than they do other [insert participant’s racialized group/ethnicity] people who have lighter skin.
[Insert participant’s racialized group/ethnicity] people view me as less affluent than they do other [insert participant’s racialized group/ethnicity] people who have lighter skin.
[Insert participant’s racialized group/ethnicity] people mistake me for someone in a service role (e.g. shop attendant, cleaner, nanny) more than they do other [insert participant’s racialized group/ethnicity] people who have lighter skin.
Overt subscale (n = 6 items)
11. [Insert participant’s racialized group/ethnicity] people call me names about my skin shade.
12. [Insert participant’s racialized group/ethnicity] people insult me about my skin shade.
13. [Insert participant’s racialized group/ethnicity] people make fun of my skin shade.
14. [Insert participant’s racialized group/ethnicity] people make negative comments about the skin shade of people who have a similar skin shade to me.
15. [Insert participant’s racialized group/ethnicity] people tell me that I would be more attractive if I had lighter skin.
16. [Insert participant’s racialized group/ethnicity] people tell me that it will be harder for me to find a partner.
Outgroup
Thinking about how you perceive White people [or insert other target outgroup] treat you based on your skin shade, please respond to the following items using the scale below. For each item, please indicate to what extent you feel the experience is true for you.
Subtle Subscale (n = 12 items)
Because of my skin shade I feel … .
[Insert target outgroup e.g. White] people treat me with less respect than they do other [insert participant’s racialized group/ethnicity] people who have lighter skin.
[Insert target outgroup e.g. White] people treat me with greater suspicion than they do other [insert participant’s racialized group/ethnicity] people who have lighter skin.
I receive poorer service from [insert target outgroup e.g. White] people compared with other [insert participant’s racialized group/ethnicity] people who have lighter skin.
[Insert target outgroup e.g. White] people avoid me in public spaces (e.g. on public transport or in the street) more than they do other [insert participant’s racialized group/ethnicity] people who have lighter skin.
[Insert target outgroup e.g. White] people view me as more aggressive than they do other [insert participant’s racialized group/ethnicity] people who have lighter skin.
[Insert target outgroup e.g. White] people view me as less trustworthy than they do other [insert participant’s racialized group/ethnicity] people who have lighter skin.
[Insert target outgroup e.g. White] people view me as more threatening than they do other [insert participant’s racialized group/ethnicity] people who have lighter skin.
[Insert target outgroup e.g. White] people view me as less intelligent than they do other [insert participant’s racialized group/ethnicity] people who have lighter skin.
[Insert target outgroup e.g. White] people view me as less affluent than they do other [insert participant’s racialized group/ethnicity] people who have lighter skin.
[Insert target outgroup e.g. White] people mistake me for someone in a service role (e.g. shop attendant, cleaner, nanny) more than they do other [insert participant’s racialized group/ethnicity] people who have lighter skin.
Overt subscale (n = 6 items)
11. [Insert target outgroup e.g. White] people call me names about my skin shade.
12. [Insert target outgroup e.g. White] people insult me about my skin shade.
13. [Insert target outgroup e.g. White] people make fun of my skin shade.
14. [Insert target outgroup e.g. White] people make negative comments about the skin shade of people who have a similar skin shade to me.
15. [Insert target outgroup e.g. White] people tell me that I would be more attractive if I had lighter skin.
16. [Insert target outgroup e.g. White] people tell me that it will be harder for me to find a partner.