
Abstract
Previous research on historical trends in the UK in social-class and sex inequality in educational attainment and in occupational opportunity is extended well into the present century by means of the UK Household Longitudinal Study, with a particular focus on variation among England, Wales, Scotland and Northern Ireland. In England, Wales and Scotland, class inequality of educational attainment declined during the transition to non-selective secondary schooling and to mass higher education. But the decline also was observed in Northern Ireland, which retained a selective system. The relationship between education and occupational destinations is then investigated for the same period of time. The use of recent data allowed this to be extended to the mature class destination even of the youngest cohort, who had experienced the stable system of comprehensive schools in the 1990s. Inequality of this opportunity also declined, but again with no particular connection to the educational reforms.
Supplemental data for this article is available online at https://doi.org/10.1080/01425692.2022.2026763 .
Introduction
The education systems of the four parts of the UK have provided the empirical basis of several previous investigations of educational inequality and occupational opportunity (Breen Citation2004; Bukodi and Goldthorpe Citation2019; Heath Citation2000; Halsey, Heath, and Ridge Citation1980; Paterson and Iannelli Citation2007a, Citation2007b). The main themes have been the changing structure and content of secondary schooling, the expansion of higher education, the decline of manufacturing industry and the growth of the service sector, and the associated changes in class structure and in sex differences in both education and employment. The main focus of the present analysis is on comparing England, Scotland, Wales and Northern Ireland, in order to ask questions about the potential long-term effects of different reforms in these different jurisdictions, and the possibility that there might have been divergent outcomes following the devolution of legislative responsibility for significant aspects of social policy to the Northern Ireland Assembly (1998), the National Assembly for Wales (1999) and the Scottish Parliament (1999).
The data come from the most recent wave of the large UK Household Longitudinal Survey. By including data on class outcomes up to the year 2019, estimates of something close to respondents’ stable class position is available, thus providing the opportunity to investigate whether reforms to school and higher education could lead to changes not only in educational outcomes but also in relative opportunities for entering the highest social classes, and avoiding the lowest classes.
The wider research literature is summarised in the next section. Here we outline the main changes to education policy since the middle of the twentieth century that set the context for the empirical analysis. All parts of the UK entered the post-war world with a selective system of secondary schooling, in which pupils were allocated to courses according mainly to their measured intelligence at age 11–12 (Gray, McPherson, and Raffe Citation1983; Kerckhoff et al. Citation1996; Sutherland Citation1990). Local experiments in non-selective systems in the 1950s led to the officially encouraged ending of selection from the mid-1960s onwards. By the early 1980s, all secondary schools in the public sector in Scotland and Wales were non-selective, alongside small, selective independent sectors that charged fees (4-5% of all pupils in Scotland and 2-3% in Wales) (Smith Citation2000, 199 and 188). England retained some locally selective systems (14-15% of pupils in public-sector schools) and a larger independent sector (6-7% of all pupils). Northern Ireland, by contrast, retained a selective system, partly because it was divided by religious denomination.
Throughout the UK, the minimum leaving age was raised to 16 in session 1972-3, having been 15 since 1947. This change, as well as the changes to the structure of schooling, required fundamental reform to the curriculum and assessment because secondary schools were having to teach longer courses to a much wider range of pupils than hitherto. A common curriculum for all pupils in the compulsory stage of schooling was introduced in the 1980s, leading to new types of assessment at the end of that stage. These reforms were in place by the late 1980s.
As will be illustrated from our data below, attainment steadily expanded throughout the half century. The reforms to the compulsory stage encouraged growing participation in post-compulsory education and thus also growing pressure for the expansion of higher education (Mandler Citation2020). This happened in two phases. One was inaugurated by the Robbins report of 1963, which led to an increase in the rate of participation by students aged under 21 from 8-9% in the early 1960s to 15% in the 1970s (Halsey Citation2000, 226). There was then a period of stability until the late-1980s, after which expansion was large and rapid, reaching one third by the mid-1990s and over 40% by the first decade of the century (Department for Education Citation2018). The expansion was encouraged by the ending of the distinction between universities and colleges or polytechnics in 1992.
These educational reforms took place in a context of fundamental change to the structure of employment and thus to the opportunities available to students when they completed their education. The manufacturing sector which had formed the basis of the nineteenth-century UK economy had stagnated in the inter-war years, had revived briefly in the 1950s, and had then collapsed (Gallie 283-5). That was the major reason why the class structure changed during the twentieth century: the proportion of the employed labour force in professions rose from 4-5% in the 1930s to 20% in the 1990s. The proportion of manual workers fell from three quarters to under 40%. Changes to the official classification schemes after 2000 make comparison with the new century difficult, but below shows similar trends by classifying people by their birth date and the new scheme. These changes were also caused by changes within economic sectors, as even manufacturing industry came to depend on formally certificated skills (Gallie Citation2000, 289–290).
The changes to employment led to large increases in upward social mobility. The growing requirement for advanced skills caused a growing role for education in the recruitment of workers. The empirical question is then whether these processes reduced social inequality of opportunity. The conclusions from previous research on these topics are summarised in the next section. The general aim of the present research is to take forward into the new century the comparisons in these respects of the four parts of the UK. The educational changes mostly took place before legislative devolution, and so the occupational destinations of the adults which we consider here will not have been directly affected by variations in education policy since then (but see also Paterson (Citation2021) for adult education). However, devolution included a variety of other aspects of social policy, such as aspects of economic development and alleviating the effects of poverty, and so there is a possibility that distinctive occupational trajectories might have emerged.
Education and status attainment
The effects of educational expansion on the social distribution of educational attainment has been a core topic in educational sociology since the 1950s (Douglas Citation1964; Floud, Halsey, and Martin Citation1956). The simple fact of expansion has never been in doubt (Meyer et al. Citation1977; Smith Citation2000; Halsey Citation2000), and so there has also been no doubt that the distribution of attainment could be modified by the mechanism that Raftery and Hout (Citation1993) later labelled ‘maximally maintained inequality’. That is, once the most advantaged groups have reached saturation at a particular level of education, any further expansion is bound to reduce inequality with respect to other groups even if that is not a deliberate aim. Early research in this vein concluded that inequality had not changed by any other means (Goldthorpe Citation1996; Heath and Clifford Citation1990; Shavit and Blossfeld Citation1993).
However, the consensus on this matter has evolved (Breen et al. Citation2009; Heath Citation2000; Marks Citation2014). Socio-economic inequality remains wide, but is not unchanging. Some narrowing has taken place because of more equal living conditions. Some has happened because students became more inclined to remain in full-time education beyond the minimum leaving age, which in turn was not only because of changing demands of the labour market for more formal certification but also because schools became more congenial places to learn. Some reduction of inequality has happened because of specific policies. The most notable of these in the last quarter of the twentieth century was comprehensive secondary schooling – the ending of selection into different kinds of school and the creation thereafter of a common curriculum and common structure of certificated assessment for all pupils (Breen, Heath, and Whelan Citation1999; Gray, McPherson, and Raffe Citation1983; Halsey, Heath, and Ridge Citation1980; Jones and Roderick Citation2003; Kerckhoff et al. Citation1996; McPherson and Willms Citation1987; Paterson Citation2003). Moreover, the previous selective system itself probably narrowed inequality in the middle of the century because, to some extent, it substituted formal selection by tests of intelligence for family economic advantage and direct nepotism (Heath Citation2000). The expansion of higher education in the 1960s and the 1990s also reduced inequalities eventually, although they probably widened at first (Arum, Gamoran, and Shavit Citation2007; Iannelli, Gamoran, and Paterson Citation2011).
In contrast to the complexity of these changes in relation to social class, the trajectory in relation to sex differences has been more straightforward: there has been a very strong reduction, and even, in several respects, a reversal (Buchmann, DiPrete, and McDaniel Citation2008; Van Hek, Kraaykamp, and Wolbers Citation2016). Girls benefited from the ending of formal selection and from a common curriculum (Croxford Citation1994). Changes of this kind at the level of secondary education then became the basis for a large rise in the proportion of female students who entered higher education. Socio-economic difference have been generally similar for women and men (Breen et al. Citation2010).
The expansion came about partly because policy makers saw education as an absolute good – a basic right in a democratic society (Paterson Citation2015). Much of the pressure for this came from citizens themselves (Mandler Citation2020). This view accompanied a more instrumental one, in which education is also a positional good (Bukodi and Goldthorpe Citation2016), an investment in human capital that confers status as well as providing resources for entering the competition of the labour market. One consequence for research is the importance of measuring educational attainment relatively as well as absolutely. Even if the intrinsic cognitive and cultural value of, say, an advanced secondary-school certificate is unchanging, its competitive value is quite different when a third of the age group attain that level rather than fewer than one in ten (a change that happened in the UK quite rapidly, between the 1940s and the 1970s: Smith Citation2000, 209).
Nevertheless, the importance of relative interpretations then illustrates why the theory of maximally maintained inequality is insufficient. New forms of educational distinction emerge when the most advantaged group loses its pre-eminence. Lucas (Citation2001) called this process ‘effectively maintained inequality’ (Lucas Citation2001). New forms of relative advantage are, for example, the distinction between different kinds of university even when overall access to university has widened (Iannelli, Gamoran, and Paterson Citation2011), or the distinction between different curricula beyond the compulsory phase of schooling (Iannelli Citation2013; Paterson Citation2020a).
The relative definition of education is most relevant in relation to labour-market outcomes. The academic debate about social mobility has followed similar themes to those for educational inequality (Breen Citation2004; Bukodi and Goldthorpe Citation2019, 34–51; Erikson and Goldthorpe Citation1992; Paterson and Iannelli Citation2007b; Marshall, Swift, and Roberts Citation1997; Saunders Citation1995; Savage Citation2000). There has been wide agreement that absolute mobility was rising until the cohort of people born in the 1950s, after which it has gently declined. These changes have been driven by the changing structure of the labour market. Mobility rose when the number of relatively high-status jobs was rising rapidly and manufucturing industry was contracting (Gallie Citation2000, 288). That long-term change slowed after the 1980s, especially in the middle of the hierarchy of status, reducing the scope for absolute upward mobility (Bukodi and Goldthorpe Citation2019, 36; Iannelli and Paterson Citation2006).
As in the debate about education, the earliest work in this connection concluded that the relative chances of reaching high-status social positions had not changed (Erikson and Goldthorpe Citation1992). That is, in the chance of reaching high-status positions and avoiding low-status ones, the gap between people from relatively advantaged and disadvantaged circumstances had not changed, even though, for everyone, the chance of reaching a high-status position had increased. Moreover, the educational expansion had had no effect on this, exactly as might be expected from a consideration of the expansion in relative terms. An advanced school-leaving certificate bought less labour-market advantage as these certificates became more common.
In some respects, the more formal processes of recruitment via educational credentials did reduce inequality. They were one of the ways in which girls and women could enter the labour market on more equal terms to males. In older cohorts, we would expect female disadvantage still to be evident, whereas educational expansion might be expected to have reduced this difference for younger cohorts. Women entered the newer sectors in greater proportions than men, and thus depended more on the somewhat meritocratic recruitment into these sectors (McMullin and Kilpi-Jakonen Citation2015) Because the old industrial sectors were stronger in Wales, Northern Ireland and, to some extent, Scotland, than in England, there are thus reasons to test whether there was variation among the four countries in the sex differences in occupational mobility.
Nevertheless, in relation to social class, the conclusion of the prior research has been that education did not reduce inequality, not only because inequality of attainment at the levels which mattered remained wide, but also because there continued to be a direct influence of class of origin on destination class (Breen Citation2004; Bukodi and Goldthorpe Citation2019, 90–107). In that sense, the labour market did not operate in a merit-selective way. There continued to be many means by which parents could confer advantage on their children and that were not captured in formal records of educational achievement. The educational expansion was merely the mechanism by which the new labour market operated. It did not itself create any new occupational opportunities, which largely happened exogenously.
One way of interpreting this persisting inequality of class outcome despite significant educational equalisation is by modifying the idea of effectively maintained inequality. As well as diverting students of low-status origins into low-status courses or institutions, they might be forced into lower-status occupations. If effectively maintained inequality can be the combination of relatively high secondary-school attainment with different kinds of higher-education course, so also it could be the combination of relatively high attainment at university with different kinds of graduate employment.
Our specific research questions arising from these general debates ask whether there is variation among the four UK countries in:
changes across birth cohorts in the social class and sex inequality of absolute educational attainment;
analogous changes when education is measured relatively;
the relationship between the educational changes (whether measured absolutely or relatively) and the opportunity to enter the highest-status social class or avoid the lowest-status class
We concentrate on entry to the highest-status class because growth of that class (as defined in the Methods section) was one of the main changes to the UK class structure, and it was the class most formally tied to the growing importance of educational credentials. We merely summarise the results for entry to the lowest-status class, with full details in the supplemenentary material.
Data and methods
Data
The data come from the UK Household Longitudinal Study, which started in its present form in 2009-11, with annual follow-up (University of Essex 2020). The latest wave used here was the tenth, in 2018-20. At its second wave, it subsumed the earlier British Household Panel Study (BHPS), which started in 1991 with annual follow-up to 2008. The samples were stratified and clustered, with weights to compensate for different sampling fractions for different ethnic groups and the different countries of the UK. The weights also compensate for differential non-response.
Only people born in the UK are included in the analysis, in order to be able to approximate the population who passed through the various historical changes noted above. We classify sample members according to whether they were born in England, Scotland, Wales or Northern Ireland, and restrict attention to these. The sample sizes are not large enough to model the effects of migration within the UK: for example, only 2% of those born in Scotland, Wales or Northern Ireland were living in London at the time of the tenth sweep of the survey (a total of only 49 respondents). The effects of internal migration on occupational progression have been studied using much larger data sets by, for example, Champion and Gordon (Citation2021) and McCollum et al. (Citation2018), but no available data set can investigate the interaction of spatial mobility with social mobility from the family of upbringing.
Understanding the social mobility of migrants into the UK would require a different kind of analysis, with more information on migrants than is available here relating to, for example, their educational attainment and the occupation of their parents. Not including in-migrants makes it unlikely that any distinctive conclusions relating to England are due to the different sampling methods there, and the sample weights also ensure that inferences are unaffected by the different bases of the samples. Understanding change over birth cohorts among members of ethnic groups who were born in the UK also would require a much larger data set: in this data set the number of people born in the UK who were classified into groups other than ‘white’ was only 11 in Wales, 13 in Scotland, and 2 in Northern Ireland. Although the total number was greater in England (573), the scope for measuring change is still limited, because the number in the two oldest cohorts (as defined below) was only 24.
To investigate change over time, we group respondents into decade-long synthetic cohorts, using broadly the same structure as previous writers on this topic who used the BHPS from the year 1999, but now taking the analysis forward in time (Paterson and Iannelli Citation2007a). In brief, the key experiences of these cohorts are:
1937-46: attending secondary school between the late-1940s and the early 1960s, this cohort represents the stable operation of the selective secondary system that was put in place after 1945.
1947-56: this cohort grew up in the period of growing affluence after the war, and attended secondary school during the gradual ending of selection (from the late-1950s to the early 1970s).
1957-66: most of this cohort experienced some period of non-selective secondary education, and, for its higher-attaining members, was the first to be able to take advantage of the expansion of higher education which started in the 1960s.
1967-76: the structure of the secondary system had now stabilised, and so, in the public sector, was predominantly non-selective in Britain (though with significant pockets of selection in England), and selective in Northern Ireland. The members of this cohort mostly left school in the 1980s, and so experienced the large shift in employment structure which took place then.
1977-86: the reforms to curriculum and assessment which followed the ending of selection affected the whole of this cohort. Higher education went through a very large expansion as this cohort left school, reaching well over 40% of the age group by the time the youngest members were aged 21.
The sample sizes in each cohort in each country of birth are shown in below.
Table 1. Cumulative educational attainment, by country of birth and cohort. Cumulative percentage down each column within country1
We curtail the sample at birth-year 1986 so that we can record something approaching their mature class of destination, at age mid-30s in the final sweep of the survey. This follows the general practice in studies of social mobility. The destination class is measured in terms of the three-class version of the National Statistics Socio-Economic Classification (NSSEC), with classes ‘managerial and professsional’, ‘intermediate’ and ‘routine’ (ONS Citation2004) Each respondent is classified according to their own occupation; in cases where that is missing, they are not given a class. The distribution of respondent class is shown in below.
Origin class is based on the three-class version of the NSSEC of parents when the respondent was aged 14, using the higher of father’s and mother’s class. The resulting distributions are in below.
Table 2. Origin class, by country of birth and cohort. Percentage in each column within country
Education is taken to be the highest attainment recorded in any sweep of the survey, using the levels shown in below. The survey does not record details of the age at which particular levels of attainment were reached. In the models, we include this information both in absolute and relative terms. The absolute measures are defined in terms of three thresholds: completing a full secondary education, gaining any higher-education certificate, and gaining a degree. The relative measure corresponds as closely as possible to the upper half of the distribution of attainment in each cohort. Thus in the 1937-46 cohort it is completing at least mid-secondary schooling (57% of the cohort); in the 1947-56 and 1957-66 cohorts it is completing at least full secondary schooling (52% and 58%); and in the 1967-76 and 1977-86 cohorts it is gaining any higher-education certificate (47% and 51%).
We also have information on parental education, recorded for each parent in five broad ascending categories: did not attend school, left school with no qualifications, left with some qualifications, gained some post-school qualifications, gained a university degree. Unlike for respondent’s education, we code this only in relative terms for each parent, as Normal scores, to allow for educational expansion, and then take the mean of these scores for each respondent.
As with any analysis which represents time retrospectively, the present investigation risks bias from differential migration and mortality. However, detailed examination of this in previous research which was based on the BHPS concluded that the bias is likely to be small (Paterson and Iannelli Citation2007b: 4.1-4.3).
Statistical models
The statistical modelling was done in R using the package ‘svyglm’ in order to be able to include the clustering, stratification, and weighting from the UKHLS. The models used the function ‘svyglm’ to estimate binomial logistic regressions of each threshold of educational attainment, and whether or not the respondent entered the managerial and professional class (or, for the further analysis summarised here, the routine class). The explanatory variables in the models were cohort, sex, parental education, and origin. In the models of class attainment, the explanatory variables also included educational attainment, in the categories shown in . We include interactive effects with sex in order to test whether the sex differences changed over time, and whether these differences themselves varied by country or by origin class.
The models are summarised by tables of chi-squared values corresponding to Type II tests (with the Anova function from the ‘car’ package in R), which are the results of dropping each term in turn from the model shown in the table. These inferential tables are based on the premise that the samples were randomly selected. Differential non-response weakens that, but one purpose of the weights is to allow inferences from the achieved sample as if it had been randomly selected. The values for the graphs were obtained from these models by the function ‘predict’. The graphs show lines corresponding to the three categories of origin class. Parental education was set in the predictions to be the mean value in the sample within each of these classes in each cohort. Where predictions are compared, the appropriate standard errors are derived from the full covariance matrix of the predictions (‘vcov’ in R).
Analysis
Descriptive trends in education and occupational class
illustrates the context of educational expansion, showing the cumulative proportion of each cohort in each country that reached each educational threshold. In England, the proportion who completed a full secondary education rose from 37% in the 1937-46 cohort to 66% in the 1967-76 cohort, and 75% in the final cohort. The largest relative increase was between the 1937-46 and 1947-56 cohorts, in other words approximately between people who were in secondary school in the 1950s and the 1960s. There was a doubling of the proportion with any higher-education qualification between the first cohort (graduating in the early to mid-1960s) and the final cohort (graduating in the first decade of the new century). Of all the changes, the sharpest was for gaining a degree, nearly tripling from 14% in the 1937-46 cohort to 39% in the youngest cohort.
The trajectory in Scotland for completing secondary schooling was similar to that in England, but mostly about 6-8 percentage points higher. The proportion graduating with a degree was similar to that in England, but higher proportions gained sub-degree certificates in the youngest cohort, in other words among people of an age to graduate in the first decade of the new century.
In Wales and Northern Ireland, by contrast, the tendency was to fall behind England. The proportion of people born in Wales who completed secondary schooling was similar to that in England in the oldest cohort (40% and 37%). In the youngest cohort, the proportion was lower in Wales than in England (65% and 75%). The proportion gaining any higher education certificate followed this, so that in the youngest cohort the proportions were 40% and 51%. Likewise in Northern Ireland, the proportion with secondary schooling was similar to England in 1937-46, but much lower in 1977-86 (60% compared to 75%). The Northern Ireland deficit in degrees or in any higher education certificate followed.
The potential importance of interpreting educational attainment relative to each cohort is also evident from this table. For example, in each country, the percentage gaining a degree in the final cohort is similar to the percentage completing secondary schooling in the oldest cohort (respectively 39, 40, 34 and 32, compared to 37, 46, 40, 34).
shows the distributions of origin class in each cohort in each country, and does the same for destination class. In England and Scotland, the proportions who came from families classified as managerial or professional rose from around one in five in the oldest cohort to one in three in the youngest. Correspondingly, the proportion from the category classified as routine fell from one half to one quarter. In Wales, the rise of managerial or professional was greater, from 12% to 30%; the fall of routine was similar, but at a higher level (halving from 61% to 33%). Northern Ireland changed more slowly: in the youngest cohort, it still had only a fifth in the managerial and professional category; like Wales, it had a third in the routine category, but this was a fall from just over a half.
Table 3. Destination class, by country of birth and cohort. Percentage in each column within country
Destination class followed similar patterns, but about two or three decades earlier. Thus in England and Scotland, the percentage in the managerial or professional category rose from a third in the oldest cohort to well over a half in the youngest, with Scotland slightly lower than England, while the percentage in the routine category fell to a quarter by the 1957-66 or 1967-76 cohorts. Wales was quite similar to Scotland by the 1957-66 cohort. Northern Ireland still had fewer than one half in managerial or professional occupations in the youngest cohorts, and continued to have around a third in routine occupations.
Summing up the trajectories of occupational class, we can say, crudely, that Wales was originally the most working-class of the four countries, but gradually converged with Scotland and to some extent with England. Of all the countries, Northern Ireland has remained the most working-class, and the least middle-class. Scotland and England are mostly similar to each other, but England was becoming more middle class by the latest cohort.
The research questions are then how these occupational changes related to the educational changes, how either of these varied by sex and by occupational class of origin, and how these changes varied across the four countries.
Statistical models: education
Before we look at the variation among the four countries in the association of sex and origin class with education, we set a further context by considering these associations across the UK as a whole. (supplementary material) summarises models in terms of class, sex and cohort, and their interactive effects. For all three outcomes, the dominant effects are cohort, parental class, and parental education. The next strongest is change across cohorts with respect to sex. There is no evidence of change with respect to class, and only relatively weak evidence of change with respect to parental education.
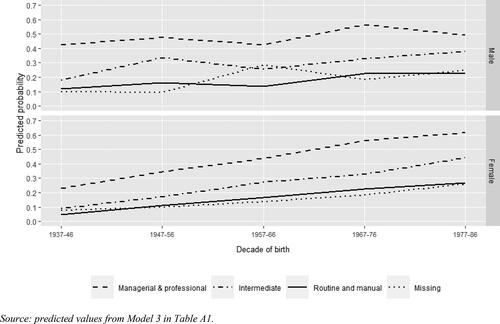
Detailed investigation of the predicted values from these models showed that the patterns of effects were similar for all three outcomes. These patterns are illustrated in , for attaining a degree. All classes benefited from the expansion to similar extents (the non-significant cohort:class term in the models). The main distributional change is that women moved from having lower rates than men to achieving parity with men in the 1957-66 cohort. Thereafter, women moved ahead of men, corresponding to the interactive effect of sex and cohort in .
Figure 1. Proportion attaining undergraduate degree or better, by sex, cohort and origin class: UK as a whole.
Source: predicted values from Model 3 in .
(supplementary material) then extends these models to consider variation among the four countries. There is clear evidence of such variation:
there were average differences, which change over time (the significant ‘country’ and ‘country:cohort’ terms);
there were changing differences among the countries in the effect of class (the significant ‘country:cohort:class’ terms), but only minimal such differences in the effect of parental education;
likewise, the changing sex differences varied among the countries (the significant ‘country:cohort:sex’ terms).
illustrates this for completing at least secondary education, showing the differences among classes for each combination of countries and sex. In almost all of the graphs, there is a decline in class inequality between the oldest and youngest cohorts. In one respect, Scotland provides the clearest instance, in the difference between the intermediate class and the managerial and professional class. For females, that difference fell 20 points (p = 0.03) between the average for the 1937-46 and 1947-56 cohorts and the average for the 1967-76 and 1977-86 cohorts. For males, the corresponding fall was 19 points (p = 0.07). There was no change of inequality relating to the routine class. (The apparent fall for men in that class in the final cohort could have arising by chance: the difference between the last two cohorts had a p-value of 0.23.) This decline of inequality came about through a rise in the attainment of the intermediate class, not any fall in the managerial and professional class.
Figure 2. Proportion attaining senior secondary education or better, by sex, country of birth, cohort, and origin class.
Source: predicted values from Model 1 in .
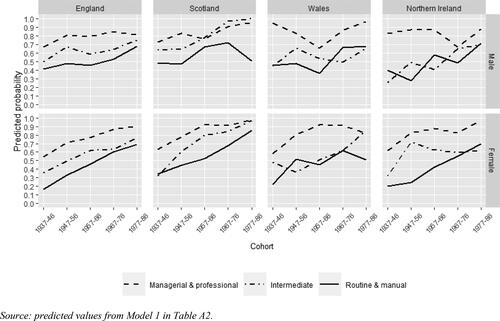
If we were inclined to interpret this Scottish pattern as reflecting the effects of a comprehensive school system, we would be contradicted by the results for Northern Ireland with its fully selective system. For males there, the difference between the intermediate and the managerial and professional class fell by 37 points (p = 0.02). There was no fall for women, but – unlike in Scotland – there was evidence for both sexes of a fall in the difference between the routine class and the managerial and professional class (for females, a drop of 23 points (p = 0.07); for males, a drop of 33 points (p = 0.04)). Moreover, for females born in England – less thoroughly comprehensive than Scotland – there was a fall of 14 points (p < 0.001) in the difference between the routine class and the managerial and professional class. The most comprehensive system of all, in Wales, showed no consistent evidence of changes to class inequality.
To some extent, these changing patterns with respect to secondary education translated into changes in the completion of higher education, illustrated for obtaining a degree in . For people born in Scotland, the gap in gaining any higher-education certificate between the intermediate class and the managerial and professional class declined among both females (36 points; p = 0.002) and males (by 25 points; p = 0.08). This was also true for attaining a degree, though the evidence was weaker (females by 22 points (p = 0.05); males by 22 points (p = 0.17)). For people born in Northern Ireland, the convergence between the routine class and the managerial and professional class was replicated for any higher education certificate only for males (45 points; p = 0.03), and it was not found at all at degree level.
Figure 3. Proportion attaining undergraduate degree or better, by sex, country of birth, cohort, and origin class.
Source: predicted values from Model 3 in .
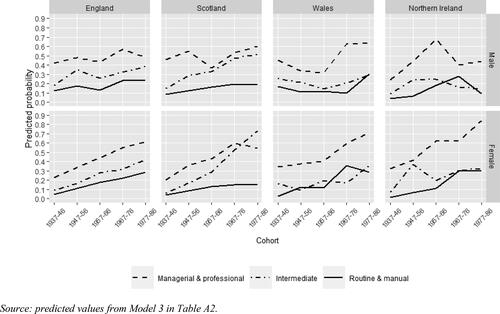
There were also several respects in which inequality with respect to higher education widened. For females born in Northern Ireland, the gap for gaining any higher education certificate widened between the intermediate class and the managerial and professional class (29 points; p = 0.04), as it did also for gaining a degree (27 points; p = 0.06). For females born in England, the gap in obtaining a degree widened between the routine class and the managerial and professional class (13 points; p < 0.001). Contrary to the pattern for the intermediate class, this gap also widened for females in Scotland (20 points; p = 0.04).
In short, across the three levels of educational attainment – secondary or better, any higher education, and degrees – the only consistent narrowing of inequality with respect to the highest class that applied to both women and men was for the intermediate class in Scotland. These findings are of interest in themselves, insofar as education is an absolute good. But because it is also a positional good, especially for competition for access to the highest class, or avoiding the lowest, investigating inequality with respect to education measured in a relative way is also relevant. We use the indicator of being in the upper half of the distribution of educational attainment. The model statistics are shown in the final column of (supplementary material), and the patterns of the fitted proportions are illustrated in .
Figure 4. Proportion attaining in top half of education distribution, by sex, country of birth, cohort, and origin class.
Source: predicted values from Model 4 in . ‘Top half’ means within cohort: see text.
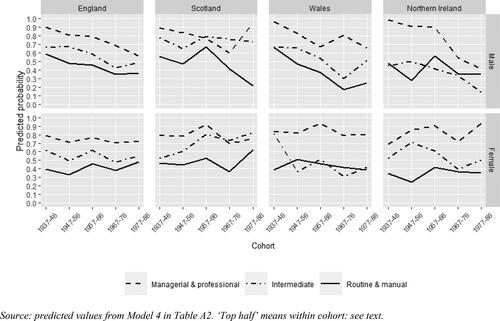
The ‘upper half’ is defined to be across the whole cohort, not separately for the sex or class groups. The most consistent pattern is that men become less likely to be in the upper half: the male lines tend to decline across the cohorts, whereas the female lines are generally flatter. The group with the most clearly rising trend is intermediate-class females born Scotland: by the 1967-76 cohort, they came to equal Scottish females in the managerial and professional class. The corresponding males are also an exception insofar as their line does not decline, and indeed the line for Scottish males from the managerial and professional class rose in the final cohort. The difference between the intermediate class and the managerial and professional class thus fell by 27 points (p = 0.017) for females. The fall for males (12 points) could have occurred by chance (p = 0.40). This is then a further indication that the Scottish comprehensive schools – having their effect from the 1967-76 cohort onwards – were of particular benefit to female students of intermediate social status while also maintaining the generally high attainment of the most advantaged class.
As with the absolute measure at secondary level, there was also some convergence in Northern Ireland: for males the gaps with the managerial and professional class fell by 23 points (p = 0.09) for the intermediate class, and by 44 points (p = 0.003) for the routine class. But there was no such convergence for females. For females born in England, there was a fall in the gap between the routine class and the managerial and professional class (10 points; p = 0.013), again as for the absolute measure at secondary level.
Statistical models: entry to managerial and professional class
The final question is whether these limited changes to inequality in educational attainment translated into changes in the inequality of entry to the highest social class, and avoiding the lowest. The models are summarised in Tables A3 and A4 (supplementary material).
First we look at models without control for education, the results of which are illustrated in . There are two dominant patterns here. One is the rising proportion of females who entered this class. Most of the increase took place across the first three cohorts, and there was some flattening of these female lines from the 1967-76 cohort onwards, in other words for women entering the labour market from the late-1980s onwards.
Figure 5. Proportion in managerial and professional class, by sex, country of birth, cohort, and origin class.
Source: predicted values from Model 1 in .
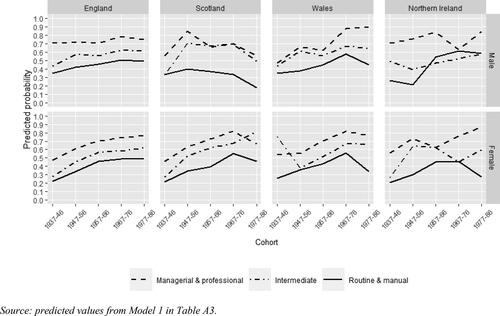
The other notable pattern is the broad stability for males in England, Scotland and Northern Ireland. (The apparent falls for men in the final period in Scotland could have occurred by chance: respectively for the three classes, p = 0.44, 0.40, 0.25). For the routine and intermediate classes, this was true also of Wales. But for the managerial and professional class, there was a rise there for men between the 1957-66 and the 1967-76 cohorts, with the result that the level at the end of the series was clearly higher than at the beginning (by 43 points; p = 0.014). The rise for women (by 22 points) might have occurred by chance (p = 0.29).
Adding education measured in an absolute way then produced Model 2 in (supplementary material). There is clear evidence there of interactive effects of country and education, in other words that the effect of education on entering the managerial and professional class varied among the countries, and that this variation itself varied over time and by sex and origin class. The resulting patterns are illustrated in , which shows entry to the highest class by people with any higher-education certificate. The most revealing features of this graph arise from the comparison with .
Figure 6. Proportion in managerial and professional class, by sex, country of birth, cohort, and origin class: restricted to people with higher-education certificate.
Source: predicted values from Model 2 in .
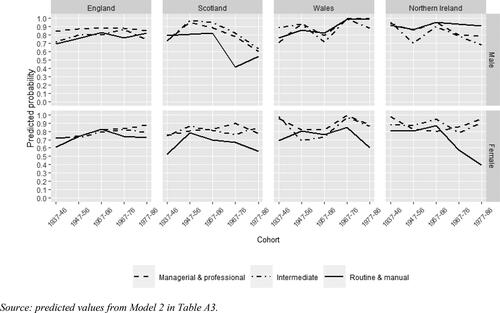
The rising female trend in has largely been explained by education, certainly for Scotland, Wales and Northern Ireland and, in England, for origin class other than managerial and professional. Even in that class in England, the rise between the first and the final cohorts is much less (16 points (p = 0.003), compared to 29 in (p < 0.001)).
For males in Scotland, there is now a fall for all origin classes between the second and the final cohorts, though the evidence is firm only for the managerial and professional class (35 points; p = 0.008); the fall for the intermediate class was 33 points (p = 0.098), and for the routine class was 26 points (p = 0.25). What we can definitely say is that the rise in absolute educational attainment in Scotland did not translate into rising rates of entry to managerial and professional careers.
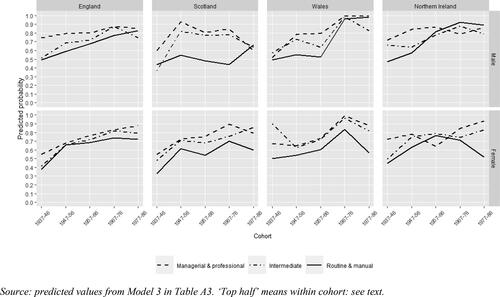
This is further confirmed when we use relative education in the model of occupational attainment, illustrated in for people who were in the upper half of the distribution of education. The pattern in the trends over time is broadly back to that of , which was without control for education, although the gaps between the origin classes are narrower than there. In other words, growing amounts of education in an absolute sense have not changed the evolving pattern of competition among classes of origin for entry to high-status classes of destination.
Figure 7. Proportion in managerial and professional class, by sex, country of birth, cohort, and origin class: restricted to people in top half of education distribution.
Source: predicted values from Model 3 in . ‘Top half’ means within cohort: see text.
The patterns for entering the routine class largely are the reverse of these (supplementary material, Table A4 and Figures A1–A3). The proportion of women who entered the routine class fell in each country, especially those whose origin was in that class, whereas there was no direction of change for men. This falling female trend was explained by rising education. The gaps between origin classes were less after control for education, especially in England.
Conclusion
The empirical strength of the research is that it has used a high-quality, large survey that allows change over time to be investigated separately for the four education systems of the UK, and to do so while also giving attention to variation by sex and by social class of origin. That several of the tables were able to show four-way interactive effects (for example, variation in class effects by sex, birth cohort, and country) showed that the large sample size provides enough statistical power to test quite complex influences on outcome. The very recent data allows the analysis to include people aged 30 or over who attended the full comprehensive systems in the 1990s, and the more educationally successful of whom could take advantage of the large expansion of higher education in the 1990s. Only by that age can reasonably stable conclusions be drawn about the impact of education on social-class outcomes.
There are several weaknesses in the analysis. As with all use of synthetic cohorts, there is a risk of bias by differential mortality and migration, although we have cited evidence that it might not be too serious here. It is an advantage to be able to study all cohorts up to age at least 30, but that still forces us to neglect subsequent education and social-class changes for the youngest cohorts. These changes might not be negligible (Paterson Citation2021). Place of birth is not a wholly reliable guide to place of schooling, although it is a better indicator than would be current residence. The education variable is broad: to be able to assess, for example, the effects of different types and quality of school or university attainment requires longitudinal data at the individual level (Paterson Citation2020b).
The research design does, however, follow that which has been used by many previous authors, and does allow broad comments to be made on changes over time and on changes that might be due to the broad structure of the education system and of social class. We are thus able to offer three conclusions in relation to debates about education and opportunity.
The first is that the main effect on these is social change, not specific policies. Despite the massive upheaval represented by the move to comprehensive schooling, or by the expansion of higher education in the 1990s, there is no evidence of any abrupt change to inequality of either educational or class outcomes. Even the youngest cohort – the most affected by these changes – could be placed in a historical context of gradual change, not of any policy-inspired transformation. The broad similarity of conclusions for the four parts of the UK tends to reinforce this point: even the stable and quite thorough comprehensive systems of Wales and Scotland did not produce different patterns of outcome from the partially or wholly selective systems in England and Northern Ireland.
Second, despite this commonality, the comprehensive-school reforms may have reduced social-class disparities, but in different ways in different systems, and in a way that interacts with sex. The group which, in a relative sense, benefited most in Scotland were the intermediate class, whereas in England it was the routine class, and especially female students there. But the most extensive evidence of changing inequality actually happened in the most selective system, Northern Ireland. There is some evidence that these changes at secondary level led to similar changes in the successful completion of higher education, but there is no evidence that the expansion of higher education added anything to that. Of course, not reducing inequality during a period of expansion is itself a contribution to increasing opportunity. For example, from , even if university expansion did not further reduce sex and class inequality beyond what had happened at secondary school, it is an important outcome that, in England, female intermediate-class students born in the 1980s were as likely to gain a degree as female higher-class students just two decades older, or indeed that female routine-class students born in the 1980s were almost as likely to graduate as male intermediate-class students just one decade older. Similar comparisons across cohorts may be made for each of the four countries, and are all the more relevant when we consider that the immediately consecutive or nearly consecutive cohorts are working in the broadly same labour market. On the whole, these conclusions of limited convergence were found also when education was measured relatively.
Third, most of the origin-class effects on entering high-status occupations were explained by having gained a higher-education certificate, though not for males in Scotland, or for routine-class females in Scotland, Wales or Northern Ireland. In that sense, the most meritocratic country was England, in that educational attainment explained to the greatest extent there the chances of entering high-status employment (). Similar (but mirror-image) conclusions were reached for entering routine occupations. Because there were no changes across cohort in educational inequality in England, in contrast to Scotland and Northern Ireland (), this evidence for stronger merit-selection in England suggests a difference in the operation of the labour market, not an effect of any difference in education policy.
Thus the present analysis has not changed the main conclusions of previous analysis insofar as it has confirmed that, despite all the changes to education policy in the second half of the twentieth century in the UK, there have been only limited effects on the social-class inequality of educational outcomes, and only minimal effects on the relative chances of entering high-status occupations, or avoiding low-status ones. For that same reason, we are led to conclude that the devolution of responsibility for some aspects of social policy has had no more than marginal effects on social mobility.
The final comments are then on what this analysis might tell us about the theories which were outlined earlier. The concept of maximally maintained inequality might be enough to explain what happened in Scotland in relation to completing a full secondary education, insofar as the convergence happened only when the highest class reached a rate of over 90% (). But there was also some convergence in other parts of the UK when the highest class was not yet at that level, and, at educational levels beyond this, convergence was seen in Scotland even when the highest class had rates of only around 60-70% (): this convergence was probably a direct consequence of the convergence at secondary level, which is a point about the sequencing of educational selection mechanisms that the theory of maxinmally maintained inequality does not take into account.
On the other hand, the combination of the changes to educational inequality and to inequality of entry to managerial and professional employment suggests a new way in which the theory of effectively maintained inequality might come about. If people from low-status origins continue to have lower rates of entering high-status employment than people from high-status origins, even among people who hold a higher-education certificate, then we might say that a new form of invidious diversion has been created. That is, the inequality is no longer in rates of completing a higher-education course, but rather in the combination of that and high-status employment.
Ethical statement
The paper is entirely based on secondary data. The participants in the survey gave their informed consent, as detailed in the original reports of the survey noted in the Data and Methods section. The analysis on which the paper is based was given ethical clearance by the research ethics committee of the School of Social and Political Science, Edinburgh University, on 27 March 2017.
Acknowledgements
The research was funded by a Leverhulme Major Research Fellowship (grant number MRF-2017-002). I am grateful to the UK Data Archive for data from the UK Household Longitudinal Study.
Disclosure statement
No potential conflict of interest was reported by the authors.
References
- Arum, R. T., A. Gamoran, and Y. Shavit. 2007. “More Inclusion than Diversion: Expansion, Differentiation, and Market Structure in 15 Countries.” In Stratification in Higher Education: A Comparative Study, edited by Y. Shavit, R. T. Arum, A. Gamoran, and G. Menahem, 1–35. Stanford, CA: Stanford University Press.
- Breen, R., ed. 2004. Social Mobility in Europe. Oxford: Oxford University Press.
- Breen, R., A. F. Heath, and C. T. Whelan. 1999. “Educational Inequality in Ireland, North and South.” Proceedings of the British Academy 98: 187–214.
- Breen, R., R. Luijkx, W. Müller, and R. Pollak. 2009. “Nonpersistent Inequality in Educational Attainment: Evidence from Eight European Countries.” AJS; American Journal of Sociology 114 (5): 1475–1521. doi:https://doi.org/10.1086/595951.
- Breen, R., R. Luijkx, W. Müller, and R. Pollak. 2010. “Long-Term Trends in Educational Inequality in Europe: Class Inequalities and Gender Differences.” European Sociological Review 26 (1): 31–48. doi:https://doi.org/10.1093/esr/jcp001.
- Buchmann, C., T. A. DiPrete, and A. McDaniel. 2008. “Gender Inequalities in Education.” Annual Review of Sociology 34 (1): 319–337. doi:https://doi.org/10.1146/annurev.soc.34.040507.134719.
- Bukodi, E., and J. H. Goldthorpe. 2016. “Educational Attainment – Relative or Absolute – as a Mediator of Intergenerational Class Mobility in Britain.” Research in Social Stratification and Mobility 43: 5–15. doi:https://doi.org/10.1016/j.rssm.2015.01.003.
- Bukodi, E., and J. H. Goldthorpe. 2019. Social Mobility and Education in Britain. Cambridge: Cambridge University Press.
- Champion, T., and I. Gordon. 2021. “Linking Spatial and Social Mobility: Is London’s “Escalator” as Strong as It Was?’ Population.” Population, Space and Place 27 (7): e2306. doi:https://doi.org/10.1002/psp.2306.
- Croxford, L. 1994. “Equal Opportunities in the Secondary School Curriculum in Scotland.” British Educational Research Journal 20 (4): 371–391. doi:https://doi.org/10.1080/0141192940200402.
- Department for Education. 2018. Participation Rates in Higher Education: Academic Years 2006/2007-2017/2018. London: DfE.
- Douglas, J. W. B. 1964. The Home and the School. London: MacGibbon and Kee.
- Erikson, R., and J. H. Goldthorpe. 1992. The Constant Flux: A Study of Class Mobility in Industrial Societies. Oxford: Clarendon Press.
- Floud, J. E., A. H. Halsey, and F. M. Martin. 1956. Social Class and Educational Opportunity. London: Heinemann.
- Gallie, D. 2000. “The Labour Force.” In Twentieth-Century British Social Trends, edited by A. H. Halsey and J. Webb, 281–323. London: Macmillan.
- Goldthorpe, J. H. 1996. “Class Analysis and the Reorientation of Class Theory: The Case of Persisting Differentials in Educational Attainment.” The British Journal of Sociology 47 (3): 481–505. doi:https://doi.org/10.2307/591365.
- Gray, J., A. McPherson, and D. Raffe. 1983. Reconstructions of Secondary Education: Theory. Myth and Practice since the War. London: Routledge.
- Halsey, A. H. 2000. “Further and Higher Education.” In Twentieth-Century British Social Trends, edited by A. H. Halsey and J. Webb, 221–253. London: Macmillan.
- Halsey, A. H A. F., Heath, and J. M. Ridge. 1980. Origins and Destinations. Oxford: Clarendon.
- Heath, A. F. 2000. “Educational Reform and Changes in the Stratification Process in Great Britain.” In The Comprehensive Experiment Revisited, edited by A. Leschinsky and K. U. Meyer, 92–110. Frankfurt: Peter Lang.
- Heath, A. F., and P. Clifford. 1990. “Class Inequalities in Education in the Twentieth Century.” Journal of the Royal Statistical Society 153 (1): 1–16. doi:https://doi.org/10.2307/2983093.
- Iannelli, C. 2013. “The Role of the School Curriculum in Social Mobility.” British Journal of Sociology of Education 34 (5–6): 907–928. doi:https://doi.org/10.1080/01425692.2013.816031.
- Iannelli, C., A. Gamoran, and L. Paterson. 2011. “Expansion through Diversion in Scottish Higher Education, 1987–2001.” Oxford Review of Education 37 (6): 717–741. doi:https://doi.org/10.1080/03054985.2011.636227.
- Iannelli, C., and L. Paterson. 2006. “Social Mobility in Scotland since the Middle of the Twentieth Century.” The Sociological Review 54 (3): 520–545. doi:https://doi.org/10.1111/j.1467-954X.2006.00628.x.
- Jones, G. E., and G. W. Roderick. 2003. A History of Education in Wales. Cardiff: University of Wales Press.
- Kerckhoff, A. C., K. R. Fogelman, D. Crook, and D. A. Reeder. 1996. Going Comprehensive in England and Wales. London: Woburn.
- Lucas, S. R. 2001. “Effectively Maintained Inequality: Education Transitions, Track Mobility, and Social Background Effects.” American Journal of Sociology 106 (6): 1642–1690. doi:https://doi.org/10.1086/321300.
- Mandler, P. 2020. The Crisis of the Meritocracy: Britain’s Transition to Mass Education since the Second World War. Oxford: Oxford University Press.
- Marks, G. N. 2014. Education, Social Background and Cognitive Ability. Abingdon: Routledge.
- Marshall, G., A. Swift, and S. Roberts. 1997. Against the Odds? Social Class and Social Justice in Industrial Societies. Oxford: Clarendon Press.
- McCollum, D., Y. Liu, A. Findlay, Z. Feng, and G. Nightingale. 2018. “Determinants of Occupational Mobility: The Importance of Place of Work.” Regional Studies 52 (12): 1612–1623. doi:https://doi.org/10.1080/00343404.2018.1424993.
- McMullin, P., and E. Kilpi-Jakonen. 2015. “The Consequences of Shifting Education and Economic Structures for Gender Differences at Labor Market Entry: The British Case Study.” In Gender, Education and Employment: An International Comparison of School-To-Work Transitions, edited by H. P. Blossfeld, J. Skopek, M. Triventi, and S. Buchholz, 122–141. Cheltenham: Edward Elgar.
- McPherson, A., and J. D. Willms. 1987. “Equalisation and Improvement: Some Effects of Comprehensive Reorganisation in Scotland.” Sociology 21 (4): 509–539. doi:https://doi.org/10.1177/0038038587021004003.
- Meyer, J. W., F. O. Ramirez, R. Rubinson, and J. Boli-Bennett. 1977. “The World Educational Revolution, 1950–1970.” Sociology of Education 50 (4): 242–258. doi:https://doi.org/10.2307/2112498.
- Office for National Statistics. 2004. The National Statistics Socio-Economic Classification User Manual. London: ONS.
- Paterson, L. 2003. Scottish Education in the Twentieth Century. Edinburgh: Edinburgh University Press.
- Paterson, L. 2015. Social Radicalism and Liberal Education. Exeter: Imprint Academic
- Paterson, L. 2020a. “Curriculum and Opportunity in Scottish Secondary Education: A Half-Century of Expansion and Inequality.” The Curriculum Journal 31 (4): 722–744. doi:https://doi.org/10.1002/curj.55.
- Paterson, L. 2020b. “Schools, Policy and Social Change: Scottish Secondary Education in the Second Half of the Twentieth Century.” Research Papers in Education: 1–26. doi:https://doi.org/10.1080/02671522.2020.1849370.
- Paterson, L. 2021. “Social Class and Sex Differences in Higher Education Attainment among Adults in Scotland since the 1960s.” Longitudinal and Life Course Studies doi:https://doi.org/10.1332/175795921X16140986832835.
- Paterson, L., and C. Iannelli. 2007a. “Social Class and Educational Attainment: A Comparative Study of England, Wales and Scotland.” Sociology of Education 80 (4): 330–358. doi:https://doi.org/10.1177/003804070708000403.
- Paterson, L., and C. Iannelli. 2007b. “Patterns of Absolute and Relative Social Mobility: A Comparative Study of England, Wales and Scotland.” Sociological Research Online 12. www.socresonline.org.uk/12/6/15.html.
- Raftery, A. E., and M. Hout. 1993. “Maximally Maintained Inequality. expansion, Reform, and Opportunity in Irish Education 1921–75.” Sociology of Education 66 (1): 41–62. doi:https://doi.org/10.2307/2112784.
- Saunders, P. 1995. “Might Britain Be a Meritocracy.” Sociology 29 (1): 23–41. doi:https://doi.org/10.1177/0038038595029001003.
- Savage, M. 2000. Class Analysis and Social Transformation. Buckingham:Open University Press.
- Shavit, Y., and H.-P. Blossfeld. 1993. Persistent Inequality. Boulder: Westview.
- Smith, G. 2000. “Schools.” In Twentieth-Century British Social Trends, edited by A. H. Halsey and J. Webb, 179–220. London: Macmillan.
- Sutherland. 1990. “Selection in Northern Ireland: From 1947 Act to 1989 Order.” Research Papers in Education 5 (1): 29–48.
- University of Essex, Institute for Social and Economic Research. 2020. Understanding Society: Waves 1-10, 2009-2019 and Harmonised BHPS: Waves 1-18, 1991-2009. [data collection]. 13th ed. Colchester: UK Data Service. SN: 6614. doi:https://doi.org/10.5255/UKDA-SN-6614-14.
- Van Hek, M., G. Kraaykamp, and M. H. J. Wolbers. 2016. “Comparing the Gender Gap in Educational Attainment: The Impact of Emancipatory Contexts in 33 Cohorts across 33 Countries.” Educational Research and Evaluation 22 (5–6): 260–282. doi:https://doi.org/10.1080/13803611.2016.1256222.