
 ?Mathematical formulae have been encoded as MathML and are displayed in this HTML version using MathJax in order to improve their display. Uncheck the box to turn MathJax off. This feature requires Javascript. Click on a formula to zoom.
Abstract
Although previous studies have investigated the contribution of several components of the school choice paradigm to school segregation, one critical aspect has not received attention from segregation scholars: schools’ priority rules, that is, the rules schools apply in case of oversubscription. We evaluate how three priority rules – grade-based, distance-based, and random-based – shape school segregation. Using Swedish register data on students’ applications to upper secondary education in Stockholm, Sweden, we assess the effect of these priority rules from two counterfactual frameworks. One uses actual students’ rank-ordered lists, and the other relies on a large-scale simulation framework. We show that grade-based and distance-based priorities produce higher levels of segregation than random-based priorities through different mechanisms. Our results hold, even when we control for students’ school preferences and residential segregation.
Introduction
School choice reforms have spread worldwide with the intention of achieving better educational quality (Forsey, Davies, and Walford Citation2008). The reforms consist of two components (Burgess and Greaves Citation2021): the freedom to apply to any school without residence constraints and a set of rules to handle student applications. According to OECD (Citation2018), 74% of school principals in European schools reported that their schools competed for students with one or more schools in the same area. Similarly, 64% of students in OECD countries (2017) claimed they had at least two schools to choose from. However, despite its continuous expansion, studies from different perspectives have pointed out that the school-choice paradigm has exacerbated school segregation. Some studies have investigated how the characteristics of both students and schools shape students’ school preferences (Billingham and Hunt Citation2016; Saporito and Lareau Citation1999). Other studies have analyzed how students´ ethnic and socioeconomic backgrounds influence their right to choose between non-local and non-public schools. And other studies have compared segregation levels under the school choice model with the school-proximity model (Bonal, Zancajo, and Scandurra Citation2021; Gortázar, Mayor, and Montalbán 2020; Östh, Andersson, and Malmberg Citation2013).
However, there is an aspect of the school choice paradigm that has not received sufficient attention from school segregation scholars: schools’ priority rules. Namely, the rules schools follow to determine which students get a place in case of oversubscription. These rules are diverse and include the enrollment of siblings (Kessel Citation2018), home-school distance, minority quotas (Oosterbeek, Sóvágó, and van der Klaauw Citation2021), students’ grades, and lotteries (Boyle Citation2016), citing some examples. Although in Europe, rules on admissions are heterogeneous and depend on local regulations, such as equity-oriented policies, program supply, or school autonomy, two transversal criteria exist: student academic performance and student residency. While the former prioritizes high grades, the latter closeness to schools. According to OECD (Citation2018), in Europe, 48% of school principals reported that a student’s record of academic performance is always or sometimes considered a factor in admitting students. Academic performance is a critical factor in Hungary, Belgium, and Finland, for example. A survey of upper secondary school principals found that academic performance was the most frequent admission criterion for upper secondary education (OECD Citation2004). On the other hand, the report also showed that 57% of school principals in Europe stated that student residency was always or sometimes a factor in admitting students. For example, the place of residence plays an influential role in admission policies in countries such as Greece, the United Kingdom, France, Portugal, and Spain.
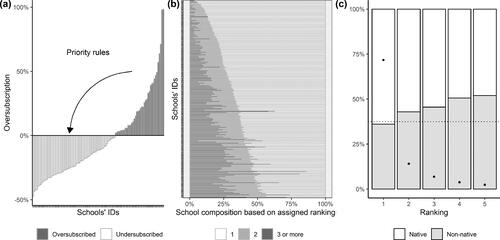
Schools’ priority rules are critical in understating school segregation for three reasons. First, the amount of over-demanded seats at schools is not trivial (see Panel a in ) and its tendency is to grow over time, resulting in a decreasing share of students getting their first preference. According to the Swedish National Agency for Education, the percentage of students applying to secondary education getting their first choice has declined from 78% in 2011 to 65.2% in 2017, making the role of priority rules on student sorting increasingly relevant. Similarly, around 33% of students applying for upper secondary schools in London did not obtain their first preference in 2018 (Adams and Hawkins Citation2018). Second, since rules determine students’ allocation, they also have consequences for the ethnic composition of schools, thus influencing school segregation. For example, Panel c in shows that, in general, 74% of students on average get their first preference, but non-natives students are overrepresented within the group that got their 2nd to 5th option. Finally, priority rules are defined by educational authorities and, therefore, they are susceptible to modification for the purposes of school ethnic integration. This feature is currently of major relevance given the growing need to design and implement effective desegregation strategies to help educational authorities mitigate segregation levels (Council of Europe Citation2017; Jasarovic Citation2020; Lallinger Citation2020).
Figure 1. School oversubscription. Panel (a) shows schools’ oversubscription before the student’s final allocation. The arrow illustrates the role and importance of priority rules in assigning students from oversubscribed (dark-grey bars) to undersubscribed (light-grey bars) schools. Panel (b) shows schools’ composition by ranking students obtained after the allocation. Panel (c) shows the final ranking distribution by ethnicity. Dots depict the percentage of the student population getting the 1-to-5 ranks. Bars show the percentage of students getting the 1-to-5 ranking among ethnic groups by rankings. The horizontal dotted line divides the percentage of native (above the line) and non-native students (below the line) for the population. All the plots show average values for Stockholm County between 2013 and 2017.
In this study, we evaluate the effect of school choice on school segregation by focusing on an under-studied aspect of the school choice paradigm: the priory rules utilized by centralized admission offices on oversubscribed schools. We study the admission model applied to allocate secondary school students in Stockholm. The reasons for this are threefold. First, the admission model is composed of the two components of the school choice paradigm, which allows us to evaluate the effect of priority rules: (1) students are entitled to submit a ranking of their preferred school programs to a centralized admission office, and (2) in the case of oversubscription, schools prioritize students following the highest-grade criterion. Second, given that this study aims to analyze the effect of priority rules on school segregation, neighborhoods (one of Europe’s most immigrant-dense areas), and school demographics in the city (school segregation in Stockholm has increased in the last decades [Kornhall and Bender Citation2019]), providing a suitable scenario for studying school segregation aspects. Finally, we have access to unique, rich Swedish register data on students’ school rankings to apply to secondary education and other individual socio-economic variables that allow us to disentangle the effect of priority rules.
Our analytical strategy consists of three approaches. First, we compare school segregation between the grade-based and distance-based priority rules with the random-based criterion. While distance-based and grade-based priority is the most common admission criteria applied in Europe, as we showed above, random-based serves as a baseline for comparison because it cancels out the effect of priority rules by giving all applicants the same chance of getting a place in case of oversubscription. This part of the analysis uses students’ rank-ordered lists from the registers. The second approach analyses the dynamics that arise from the interdependencies inherent in school segregation under priority rules (Hedström and Mutgan, Citation2019). To this end, we implemented a large-scale simulation model of school segregation. The simulation is calibrated using Swedish register data. Finally, based on our simulation model, our last approach explores the interaction between students’ school ethnic preferences, residential segregation, and priority rules.
Under the first approach, we find that grade-based and distance-based priority rules lead to higher levels of ethnic school segregation than random-based ones. We show that in the grade-based case, the increase is explained by native students having, on average, higher grades than non-native students. This disparity gives native students more chances to obtain their first ranking, which are schools with an overrepresentation of natives. In the distance-based case, the increment is explained by the fact that residential and school segregation are correlated, which means that the closer students are assigned to their residency, the higher the chance that they end up in school with a high share of co-ethnic schoolmates. Under the second approach, we find that how students form their school ranks increases the oversubscriptions of schools, which hinders their chances of getting their first ranking and, at the same time, increases the number of students who do not get any of their rankings. Finally, the third approach reveals that even though random-based priority yields lower levels of school segregation compared to grade-based and distance-based priorities, the effect of residential segregation and students’ school ethnic preferences are by far stronger determinants of school segregation than any priority rules utilized to allocate students.
This study contributes to the literature on school choice and segregation on several fronts. First, it evaluates the effect of school choice on segregation from a different perspective by focusing on an understudied aspect, school priority rules. Second, it extends the analysis of school segregation beyond compulsory education by analyzing secondary education (Holm and Lundahl Citation2019). Third, it provides a dynamic and mechanism-based explanation (Bonal, Zancajo, and Scandurra Citation2019; Hedström Citation2005) of how grade-based and distance-based priority rules shape school segregation. Our study approaches school segregation from a two-sided perspective. That is, it considers not only students’ school preferences (demand side) but also the preferences of schools defined as schools’ priority rules (supply side). Finally, it distinguishes the effects of priority rules on segregation from residential segregation and students’ preferences.
Below, we present how previous studies have addressed the consequences of the school choice paradigm on school segregation and provide details of the Swedish secondary school choice model. Next, we introduce our methodological strategy in detail. We then present the main findings following our three-step analytical approach. Finally, we summarize our analytical approach, discuss results, and provide remarks on implications for segregation scholars and policymakers.
School choice and school segregation
Empirical evidence has shown that far from achieving their goals, school choice reforms have exacerbated educational inequality in several respects (Cordini Citation2019). In the Swedish context, for example, studies indicate that ethnic school segregation increased after the reform was implemented (Böhlmark, Holmlund, and Lindahl Citation2015; National Agency for Education Citation2012). Scholars have shown that the reasons behind these unintended consequences lie in the fact that families´ school preferences do not meet the rational-actor behavioral expectations under which the reform was conceived (Plank and Sykes Citation2003; Forsey, Davies, and Walford Citation2008). Far from choosing privileged schools, for example, students from disadvantaged families tend to opt for disadvantaged, local schools. Alternatively, families prefer schools in which in-group members are overrepresented over other academic aspects. To explain the negative consequences of the school choice reform, researchers have evaluated its effect on student sorting from three approaches. Some studies have examined how different ethnic and socioeconomic groups exercise their right to choose schools by choosing schools beyond their catchment areas or independent schools. Others have investigated the factors that shape students’ school preferences. Others have compared school segregation levels under school choice to those under former proximity-based allocation regimes.
Non-local and independent schools
Studies have found that more advantaged students, in terms of family educational level and income status, tend to send their children to non-local schools. For example, using data from North Carolina, Bifulco, Ladd, and Ross (Citation2009) find that students with college-educated parents are more likely to attend non-local, high-achievement schools. Using Swedish data, Trumberg and Urban (Citation2021) demonstrate that non-native students – particularly students with lower socioeconomic backgrounds – attend schools within catchment areas. Studies also reveal that native students living in ethnically-mixed areas prefer non-local schools more often (Andersson, Östh, and Malmberg Citation2010; Böhlmark, Holmlund, and Lindahl Citation2015; Riedel et al. Citation2009). The empirical evidence for students choosing high upper secondary schools is not different from that of students in compulsory education. For example, Holmlund (Citation2016) finds that Swedish 9th-grade native students, compared to non-native ones, are more likely to attend independent schools when they live in disadvantaged areas.
Results under this approach have two main implications for school segregation. First, during the last decade, there has been an increase in travel-to-school distance for native students (Andersson, Malmberg, and Östh Citation2012; Trumberg Citation2011) in both compulsory and secondary education (Fjellman, Yang Hansen, and Beach Citation2019; Söderström and Uusitalo Citation2010). Second, studies comparing ethnic school segregation before and after the reform show an increase in segregation (Yang Hansen and Gustafsson Citation2016). For example, Böhlmark, Holmlund, and Lindahl (Citation2015) report that in Swedish municipalities where native students prefer non-local schools over local ones, ethnic and socioeconomic segregation increased.
Students’ school preferences
Studies under this approach analyze school choice at the intersection of students’ and schools’ attributes. The most investigated attribute from this perspective has been the ethnic composition of schools (Billingham and Hunt Citation2016; Saporito and Lareau Citation1999). Studies show that native students with middle socioeconomic status are more likely to choose schools with a higher share of the native population (Malmberg, Andersson, and Bergsten Citation2014). Generally, homophily along ethnic-economic lines tends to channel the selection of schools (Billingham and Hunt Citation2016; Holm and Lundahl Citation2019; Saporito and Lareau Citation1999). However, other factors also are driving the selection of schools. For example, students are more likely to attend nearby schools (Holm Citation2013). Furthermore, inner-city schools attract more students than peripheral schools because of their easy accessibility (Lidström, Holm, and Lundström Citation2014). Qualitative studies also suggest that schools’ reputations matter in school choice, even more significantly than other school academic characteristics (PISA in Focus Citation2015; Lidström, Holm, and Lundström Citation2014; Thelin and Niedomysl Citation2015). Personal social networks play a substantial role in school choice because they channel school information (Bell Citation2009) and foster peer effects among students when considering school selection (Rosenqvist Citation2018).
The students’ school preference approach has two implications for understanding school segregation. First, it shows that school choice responds not only to rational choice considerations under which the reform was conceived (Thelin and Niedomysl Citation2015), such as schools’ educational characteristics (Böhlmark, Holmlund, and Lindahl Citation2015), but also significantly weighs non-educational aspects such as distance-to-school, reputation, and schools’ ethnic share, among others. Second, selecting schools based on their ethnic composition has immediate and cumulative effects on school segregation (Tapia Citation2021). The former refers to how school selection changes segregation immediately after the academic year begins. The second refers to how this selection triggers subsequent school choices. For example, using administrative data from Copenhagen, Rangvid (Citation2010) finds that native students abandon schools when the proportion of non-native students exceeds 35% of the total share. Similarly, Card, Mas, and Rothstein (Citation2008) show that native students are more likely to leave a school when the proportion of minorities increases.
Counterfactual studies
This emerging approach compares school choice with the school proximity criterion, in which students living near schools have a higher priority (Östh, Andersson, and Malmberg Citation2013). For example, exploiting the 2012-2013 school choice reform in Barcelona, Bonal, Zancajo, and Scandurra (Citation2021) find that the level of segregation of disadvantaged students under the school proximity criterion was lower than that produced by the school choice reform. Allen (Citation2007) simulates the reallocation of 9th-grade students based on home-school proximity instead of the school choice model. He found that socioeconomic and ability segregation are lower under the proximity regime. Similar results were found in England (Burgess et al. Citation2007). Gortázar, Mayor, and Montalbán (2020) studied two reforms in priority rules for access to preschool education in the city of Madrid. The authors find that reducing priorities for low-income students and relaxing the proximity-to-school criterion increases ethnic school segregation. In the Swedish context, by analyzing data from 9th-grade students, Böhlmark, Holmlund, and Lindahl (Citation2016) find that the level of ethnic school segregation increased after the 1992 school choice reform and conclude that this is partly due to the reform but mainly to residential segregation: “school segregation has increased more than what would be the case if all pupils attended their assigned (nearby) schools” (p. 1182). At the upper secondary level, Söderström and Uusitalo (Citation2010) showed that the 2000 reform in Stockholm County exacerbated school segregation across ability, socioeconomic, and ethnic dimensions.
In general, previous studies indicate that student sorting across schools is the result of students’ school preferences (student side), how educational authorities handle those preferences (school side), and how they interact with each other over time. Therefore, these two factors must be considered to understand school segregation. This two-sided approach is especially relevant for evaluating the effect of priority rules on school segregation because priority rules make sense only when schools are oversubscribed and oversubscription occurs at the intersection of students’ school preferences, school capacity constraints, and admission rules.
Upper secondary education in Sweden
In the early 1990s, Sweden introduced an educational reform to improve education through market mechanisms (Bonal, Verger, and Zancajo Citation2017). Before the reform, student allocation was governed by the School Proximity Principle. The reform instituted four main changes: (1) the establishment of the voucher system, (2) the introduction of independent privately owned schools, (3) the responsibility of municipal governments to organize education at the primary and secondary levels, and (4) the institution of the school choice paradigm as a mechanism to disconnect school choices from disadvantaged local schools, that is, to mitigate the strong effects of residential segregation on school segregation (Trumberg and Urban Citation2021). In Stockholm, reforms at the upper secondary educational level took place in 2000. After the reform, students finishing compulsory education had to apply to secondary schools by submitting a rank-ordered list of school program preferences. Before the reform, the admission office prioritized students who lived closer to school in the case of oversubscription. After the reform, oversubscription was resolved based on students’ grades.
Although the school choice factors discussed in the previous section apply to compulsory and secondary education, some differences exist. At the compulsory level, schools are homogeneously distributed over the city and parents are responsible for school choices. On the other hand, at the upper secondary level, the decision corresponds to the students themselves because it involves the selection of programs and specializations in addition to schools. This feature makes school choices at the secondary level more complex (Holm and Lundahl Citation2019). Regarding program selection (vocational and academic), evidence shows that students from higher socioeconomic backgrounds tend to choose academic programs. Non-native students not only tend to hold positive attitudes toward this kind of program (Abrassart et al. Citation2017) but also tend to select it more than natives (Jonsson and Rudolphi Citation2011; Rosenqvist Citation2018).
Applying to upper secondary schools in Stockholm
After nine years of compulsory education, students may apply for a three-year upper secondary education. Despite being voluntary, it exhibits a high share of enrollment. Students can apply to any of the 18 national programs distributed between two main tracks: academic, focused on university studies, and vocational, focused on working life. Students must have passed Swedish, English, and mathematics courses to be eligible for any national program. Non-eligible students can apply for introductory programs. Grades points are based on the final grades from compulsory education, and the maximum score is 340. The application process consists of students submitting a rank-ordered list of unique school-program combinations to a centralized educational authority. Students can list as many preferences as they wish. The procedure to allocate students is based on the Gale-Shapley Deferred Acceptance algorithm (Gale and Shapley Citation1962), which can be summarized as follows: In the first round, students are assigned to the school program they ranked first. Based on the priority criteria established by the educational authority and schools’ capacity constraints, schools temporarily keep students with high priority and reject those who exceed their capacity. The final assignment is completed once all students’ preferences are evaluated. In the case of the Stockholm admission office, student grades determine schools’ priorities.
Data and methods
Data
The admission process for upper secondary education in Stockholm is organized by the Stockholm Admission Office, which handles applications for all municipalities of Stockholm County together with the municipalities of Gnesta and Håbo. We use Swedish register data provided by Statistics Sweden on 9th-grade students applying for secondary education between 2013–2017. Apart from providing unique, rich data on students’ and schools’ spatial and socio-demographic characteristics, the data contain detailed information about students’ rank-ordered lists of preferred programs submitted to the admission office.
Analytical strategy
Our analytical strategy consists of three phases. First, following previous studies (Allen Citation2007; Bonal, Zancajo, and Scandurra Citation2021; Burgess et al. Citation2007; Östh, Andersson, and Malmberg Citation2013), we counterfactually compared the levels of ethnic school segregation under grade-based criterion for over-demanded schools with two alternative criteria: distance-based and random-based. While in the distance-based, students living closer to school have priority in case of oversubscription, the random-based assigns them haphazardly. We simulate the current allocation mechanism based on the Gale Shapley Deferred Acceptance algorithm (Gale and Shapley Citation1962) and use it as a priority rule current grade-based criterion. This part of the analysis uses students’ rank-ordered lists from the registers. In case of tie grades between students, the school randomly chooses between them. Before getting into any counterfactual simulations, we externally validate the simulation outcomes against actual student distributions found in the registers (see Figure S1 in Supplementary Materials). We defined native students as those students with at least one Swedish-born parent and the rest as non-native students. We measure segregation using the index of dissimilarity (James and Taeuber Citation1985), but other measures are also evaluated (see and in Supplementary Materials).
In the second phase of the study, we implement a large-scale empirically calibrated-simulation model (Arvidsson, Collet, and Hedström Citation2021; Tapia Citation2021). This simulation aims to overcome some limitations of the previous approach. First, it isolates the effect of the priority rules from changes in student demographics (Fandrem et al. Citation2021) and variations in the school-program supply (Branden and Bygren Citation2018). Second, it captures the effect of priory rules on school segregation while considering the dynamic aspects of school segregation (Hedström and Mutgan, Citation2019; Tapia Citation2022). The simulation has two components: the allocation mechanism and the students’ rank-ordered lists. We use the same empirically validated allocation procedure implemented in the first phase as well as the same three allocation criteria. We model students’ rank-ordered lists using conditional logit models (Ben-Akiva and Lerman Citation1985; Train Citation2009). During the simulations, we keep constant the supply of schools and programs, the number of available places at schools, and the number of applicants.
The final phase of our analytical strategy uses the large-scale simulation model to evaluate whether results in phase 2 hold when we control for the effects of residential segregation and students’ school ethnic preferences.
Modelling students’ rank-ordered lists
Building on theoretical insights from the school segregation literature discussed in the previous section, we specify a set of behavioral models in which schools’ characteristics and their interaction with students’ characteristics determine the ranking formation. At the school level, we look at the average grades of students admitted at schools in t − 1, the proportion of native students at school, school size, average income at schools, school ownership, and the school acceptance rate at t −1. Regarding interactions, we look at the Euclidean distance between students’ homes and schools’ geographic coordinates, the Euclidean distance between schools’ coordinates and the center of the city, the absolute difference between the student grade and school mean grades, the proportion of 9th-grade classmates applying to school at t, the difference between students’ parents’ income and average school income (absolute value), and the interaction between the proportion of natives at school and school average grades.
Under the assumption that students have preferences for specific programs before schools, we keep those preferences fixed and maintain the number and order in which they appear in students’ rankings in the registers. Therefore, the conditional logit models evaluate each student’s probability of choosing a school that offers the program of her preference for each element in the programs the student has listed. In addition, given the importance of students’ academic performance on students’ school choice and their final school assignment, we define and model the behavior of four different groups of students: high-performance native, low-performance native, high-performance non-native, and low-performance non-native. High-performance students are defined as those with grades higher than the median grades for each year.
We specify the following logit model:
(1)
(1)
Where denotes the probability that student i, who wants to study the program r, selects school j in the place o of her ranking, conditioned by the observed characteristics of the school j (
) at time t-1, observed characteristics of student i (
), and the choice set of student i, (
) composed by all the schools offering the program r.
represents the unobserved characteristics of both schools and students and follows a type I extreme value (Gumbel) distribution, and β and γ are the parameters to be estimated. Since students’ characteristics (
) are relevant to school choice but the model estimation does not discriminate among them, I enter them as interaction terms in
.
Large-scale empirically calibrated simulation model
The simulation proceeds as follows:
Assigning attributes to schools. At the beginning of the simulation, upper secondary schools’ characteristics are parameterized using data from 2016, including attributes such as spatial location, ethnic and socioeconomic composition, admission grades, size, school capacity, and program supply. Since school characteristics are based on t -1, we use the year 2016.
Assigning attributes to students. We parameterize student attributes applying to secondary education using data from the 2017 cohort, which constitutes the most recent data point to which we have access. It includes individual traits such as ethnic background, family income, spatial location, grades, and – most importantly – students’ program preferences, their order as indicated in the rankings, and the length of the rankings. For example, if student j indicates interest in three different programs (e.g. Natural Science, Social Science, and Humanities), the length of her ranking is three. The following procedure pairs program preferences with schools.
Ranking formation. Using the conditional logit model specified in EquationEq. (1)
(1)
Removing redundancies. If the combination between the sampled school and the program in Step 3 generates duplicated rankings, students will have to sample another school until they meet the unique-ranking criterion requested by the central authority. For example, if student j matches Natural Science with School A in the first ranking, but for her third ranking, she samples the same school for the same program, she will have to sample again.
Allocation. Once all the students´ rankings have been formed, students apply, and schools allocate them following any of the three priority rules. During the simulation, there are always more places than applicants.
Non-allocated students. For those students who did not get any of their ranked options after completing the allocation (step 5), two alternative re-assignments procedures are implemented: (1) At random, which randomly assigns students to schools with available seats; and (2) By distance and in-group homophily, which assigns students to schools with available seats as a function of home-school proximity and in-group ethnic similarity; thus, the shortest the distance to the school with available seats and the higher the proportion of in-group members at schools, the greater the chances for a student to be assigned to the school.
Enrollment in secondary schools. Once all applicants are allocated across schools (steps 5 and 6), they start their 1st level of secondary education and current 3-level students at secondary schools are removed from the simulation.
Measuring school segregation. Schools’ attributes at secondary education are updated as a result of student final enrollment (step 7). After that, ethnic school segregation is measured.
Steps 2-8 are repeated for 10 rounds.
Results
In this section, we present our main results. The first part assesses how grade- and distance-based priority rules contribute to school segregation by comparing them with random criterion. The second part presents the results of the previous analysis from a dynamic perspective. The last section evaluates the extent to which residential segregation and students’ school ethnic preferences influence the effects of priority rules on school segregation.
Part 1. Counterfactual analysis using actual students’ ranking lists
The first challenge in counterfactually evaluating the effect of current school priority rules is to replicate its process and outcomes and externally validate them. To do so, we compare how well our simulated grade-based allocation reproduces the proportion of students getting each of their 1st-6th ranked options, the proportion of students getting each of their preferred options by ethnicity, and the level of school segregation. As shown in , our grade-based simulation model reproduces the observed patterns with high similarity and becomes a reliable tool for evaluating counterfactuals.
Figure 2. Counterfactual simulation results using actual student rankings. Panel (a) shows the final student allocation by rank. Panel (b) shows the level of school segregation (the dissimilarity index). Panel (c) shows the final student allocation based on ranking and ethnicity. The proportions were calculated based on the number of students in each ranking. Panel (d) shows the predicted probabilities of school ethnic shares on students’ ranking formation, ceteris paribus. All boxplots show dispersion over 50 executions.
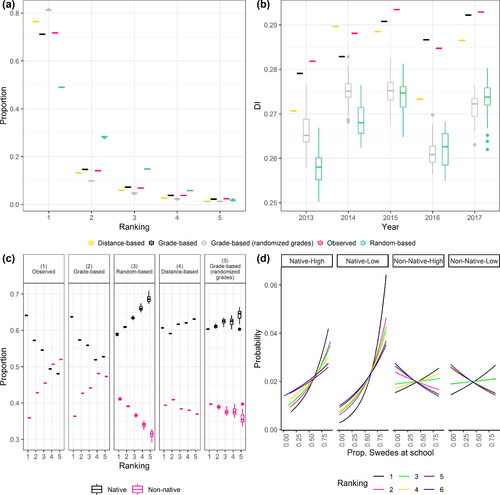
In Panel a of , we show that under grade-based priority rules ≈75% of students get their first ranking and ≈18% the second. When looking at this trend across ethnic groups in Panel c, we observe that non-native students, who constitute ≈40% of the population are overrepresented among the students getting their second and lower rankings (Table S1 in Supplementary Materials provides the summary statistics of the data used in the empirical analysis). The distance-based priority rules produce similar results but the distribution of rankings between ethnic groups is more equal. Under the random-based criterion, however, a significant drop among students getting their first preference is observed (≈49%) and an increase among those getting their second (≈27%). However, under this setting, the non-native overrepresentation getting lower rankings changes to underrepresentation. A substantial difference between grade-based, distance-based, and random-based priorities is that the latter produces lower levels of school segregation, as shown in Panel b. While the index of dissimilarity for random-based priorities is on average 0,267 (±0,003), for grade-based and distance-based is 0.286 (±0.023) and 0.281(±0.004), respectively. Although the data show no significant differences between grade-based and distance-based priorities, we show that the mechanisms through which both increase segregation are different.
Grade-based
On average, grade-based compared to random-based, increases school segregation by 6.7% on a yearly basis (min:5.1%, max:8.5%). To explain this difference, we can look at the analysis on Panels c and d (). In Panel c, it is observed that grade-based priority rules benefit natives more than non-natives since natives get more often their first option. The reason for this is that, on average, natives have higher grades (mean = ≈249 points) than non-natives (mean= ≈227 points). This disparity provides natives with a clear advantage over non-natives in the case of oversubscription. To test this potential explanation, we run the same simulations but randomly distributed the grades among native and non-native students. As Panel c shows, the randomized grade and random-based setting produce similar results. This analysis supports the disparity-grade-based explanation.
However, at this point, the disparity explanation does not explain why when native students get more often their first-ranked options, school segregation is higher. Panel d helps to understand this effect. The panel shows, ceteris paribus, the predicted probabilities of the conditional logit model specified in EquationEquation (1)(1)
(1) for the variable proportion of swedes at school. What it is interesting about Panel d is that native students reveal a clear ethnic hierarchy regarding the order in which they rank schools based on the proportion of natives. It is more likely that they place a native-dominated school as a first option than as a second or lower preference. This pattern holds true for both high- and low-performance natives. For example, low-performance natives have ≈45% more chances of ranking a school with 80% of natives as a first option than as a sixth. High-performance natives have ≈35% more chances. Why do random-based priority rules produce lower levels of segregation than grade-based models? On average, native students had higher grades than non-native students (grade disparity). This disparity gives native students more chances to obtain their first rankings (rules prioritize highest grades), which are more likely to be schools with a higher proportion of natives (school-ethnic-composition hierarchy). Hence, the previous mechanism contributed to increasing school segregation.
Distance-based
The mechanism through which the distance-based priority rule increases segregation compared with the random base differs from the grade-based rule. Although the school-ethnic-composition hierarchy holds, the distance criterion proportionally gives native and non-native students of their 1st-6th ranked options, as shown in Panel c. However, what is distinct now is that when schools prioritize proximity, students are more likely to be allocated to nearby-to-home schools. For example, random-based priorities allocate students an average of 9.4 km from home. Roughly similar to the grade-based rules, where the average distance is 9.32 km. However, when schools prioritize home proximity, the average distance to schools drops to 7.96 km for all the students. We did not find significant differences between ethnic groups (Table S3 in the Supplementary Materials provides summary statistics of home-school distances under all priority rules). Given the high correlation between residential and school segregation, allocating students close to their homes increases the chances of sorting them among in-group neighbors. Nearby-to-home allocation increases school segregation.
Previous analyses show that grades and school proximity criteria contribute to higher levels of school segregation than random priorities. Although the analysis considers actual student rankings from Swedish registers, it does not rule out other aspects that might modify the effect of priority rules on school segregation, such as changes in student demographics, the opening of new schools, or the closing of schools. Furthermore, it captures neither the effect of priority rules under the dynamic perspective that characterizes school segregation nor the effect of residential segregation and student ethnic preferences. The next section discusses these aspects.
Part 2. Schools’ priority rules from a dynamic perspective
The results in this section are based on a large-scale simulation model of school segregation. The goal is to evaluate the effect of priority rules on school segregation by considering the interaction between students’ rankings and the priority rules over time. We use the conditional logit model specified in EquationEquation 1(1)
(1) to form students´ rankings (a validation test of the ranking formation and the full table of coefficients are shown in Figure S2 and Table S2 in the Supplementary Materials).
Before examining the simulation results, we show the effects of a set of school attributes on the formation of students’ rankings. shows that students prioritize nearby and large schools chosen by 9th-grade classmates the previous year (Panels a, b, and c, respectively). More specifically, native students prefer schools with a higher representation of natives (Panel d). Nonetheless, the same effect seems weaker for non-native students. Despite students tending to first-rank schools with high median grades and lower acceptance rates, the probabilities of ranking those are much higher for high-performance students, regardless of ethnic background (Panels e and f).
Figure 3. Predicted probabilities of student ranking formation. (a) Euclidean home-school distance. (b) School size (number of students). (c) The proportion of 9th-grade classmates who applied to schools. (d) The proportion of natives at school. (e) Median grade of previous years accepted at school. (f) The previous year acceptance rate at school.
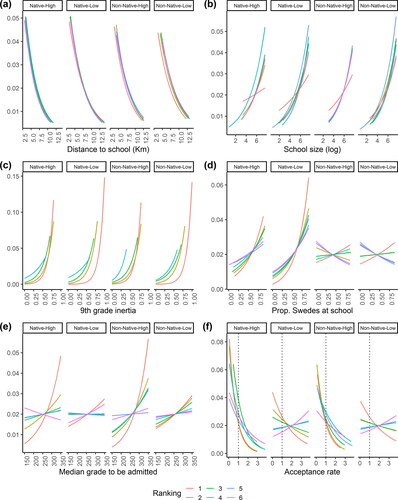
The effect of priority rules on school segregation comes into play as long as schools are oversubscribed. If there were no school capacity constraints or applications matched vacancies, the effect of priority rules would be null because all students would obtain what they want. With this in mind, two aspects of ranking formation shown in become relevant to understanding the effect of priority rules on school segregation from a dynamic framework: acceptance rate and median grade to be admitted. The former prompts students to prefer schools with a lower acceptance rate; therefore, the more rejected applications to a particular school, the more likely students will select that school as the first option. The latter increases the average grade of schools over time, making students rank those schools while hindering their chances of acceptance. Together, they increase school oversubscription over time and, consequently, make the role of priority rules in school segregation more decisive. We call this the oversubscription-promoting effect of students’ school preferences.
shows the main results of the computational experiments. As expected, owing to the oversubscription-promoting effect, oversubscription increases over time for all the criteria (first row in ). Interestingly, oversubscription triggers two effects on school segregation dynamics. First, as oversubscription increases, the share of people who receive their first preference decreases (second row in ). Consequently, native and non-native students decreased their first option (Rows 3 and 4 in ). According to the school ethnic composition hierarchy explanation, we expect segregation to be lower when native students get less of their first preference. We observe this pattern in the At-random column in . Moreover, grade-based and distance-based priority rules systematically produce higher levels of school segregation than the random-based criterion because of the school ethnic composition hierarchy and the nearby-to-home allocation mechanisms described in the previous section.
Figure 4. Priority rule and school segregation from a dynamic perspective. The boxplots show the dispersion of 30 executions for each parameter combination. (1) Average number of seats oversubscribed across schools. (2) Share of students getting their first option. (3) Share of native students getting their first option. (4) Share of non-native students getting their first option. (5) School segregation (dissimilarity index): (6) Share of non-allocated students. (7) contribution of non-allocated students to school segregation was measured in percentages by comparing the level of segregation between stochastic reassignment (reference level) and non-allocation reassignment procedures.
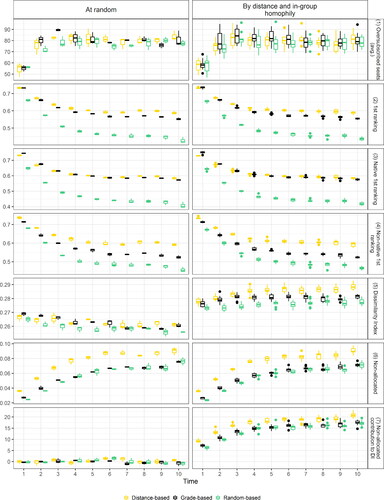
The second effect of oversubscription is an increase in the proportion of non-allocated students –the number of students not accepted by any of their ranked options after the allocation procedure ends (Row 6 in ). We test two reassignments to these students. At-random (first column in ), students are randomly assigned to schools, and By-distance-and-in-group-homophily (second column in ), students are placed in schools as a function of school-home proximity and in-group ethnic homophily. Both reassignments only consider schools with available seats. As indicated in row 7 of , the contribution of By-distance-and-in-group-homophily to school segregation is more decisive than the At-random assignment, considering that under the former, it is more likely that, for example, native students are placed in nearby and native-dominated schools. Interestingly, the second effect of oversubscription suggests that, in general, school segregation depends more on how non-allocated students are re-assigned than on the type of priority rule (row 5 in ).
Part 3. Student preferences for schools’ ethnic composition and residential segregation
In this section, we evaluate the effect of the three priority rules in light of two dominant explanations of school segregation: residential segregation and students´ school ethnic preferences. Results are based on the large-scale simulation model presented in the previous section. We take as a reference model the simulation results shown in column By-distance-and-in-group-homophily in , which is the basic model for the experiments shown in . Then, we seek to evaluate two counterfactual scenarios under two theory-driven interventions. In the first, the distance intervention, students form school rankings without considering the spatial distance to schools. We operationalize this intervention by multiplying the distance coefficient in the conditional logit model by zero (deactivating) and keeping others equal. The rationality of this intervention consists of detaching school segregation from residential segregation, given the strong tendency of students to apply to nearby schools, as shown in Panel c in . The second intervention, the ethnic homophily intervention, follows the same logic; however, in this case, students form rankings without considering the ethnic share of schools while keeping other coefficients equal. Given that the intervened models and the basic model are identical, except for the specific interventions, the difference between the basic model (landmark model) and the distance and ethnic homophily intervention models quantify the effect of both residential segregation and students’ schools’ ethnic preferences on school segregation.
Figure 5. Schools’ priority rules, residential segregation, and students’ schools’ ethnic preferences. The boxplots show the dispersion of 30 executions for each parameter combination. The assignment of nonallocated students followed the By-distance-and-in-group-homophily criteria for all the simulations. (1) The average number of seats oversubscribed across schools. (2) Share of students getting their first option. (3) Share of native students getting their first option. (4) Share of non-native students getting their first option. (5) School segregation (dissimilarity index). (6) Share of non-allocated students. (7) Contribution of nonallocated students to school segregation measured in percentages by comparing the level of segregation between a stochastic reassignment (reference level) and the non-allocation reassignment procedures.
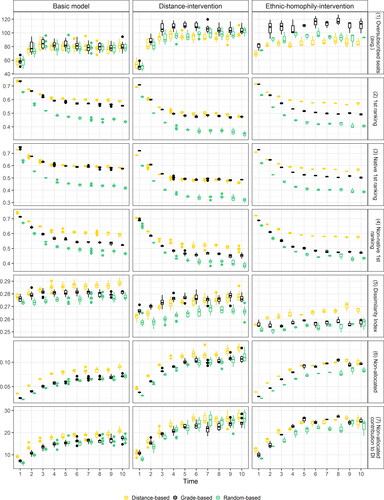
As we observe in , both interventions, compared to the basic model, produce higher levels of oversubscriptions (row 1 in ), especially in the grade-based priority setting. This result indicates that home proximity and ethnic preferences have a constraining effect on the growth of oversubscription: when they are not considered in students´ ranking formation, students give more value to other school traits that make them coincide more with their school preferences. For example, in the distance intervention, two students living in separate neighborhoods might select the same high-performance school – rising oversubscription – instead of other high-performance schools close to their residency.
As explained in the previous section, oversubscription leads to diminishing the proportion of students getting their first option and increasing the proportion of non-allocated students. Looking at rows 2, 3, and 4 in , across the three allocation criteria and the two interventions, the proportion of students getting their first preferences also goes down, being nevertheless lower in the intervened models.
When we look at how the interventions affect school segregation (row 5 in ), we see that they lower school segregation compared to the basic model. Yet, those differences are expected to be more pronounced given how much the non-allocated students’ re-assignment contributes to intensifying segregation (row 7 in ). In unveiling those effects on school segregation, our school ethnic composition hierarchy and the nearby-to-home allocation mechanisms certainly account for part of that increase. However, given that distance and ethnic homophily interventions change students’ ranking formation, we examine how those rankings are modified under each intervention.
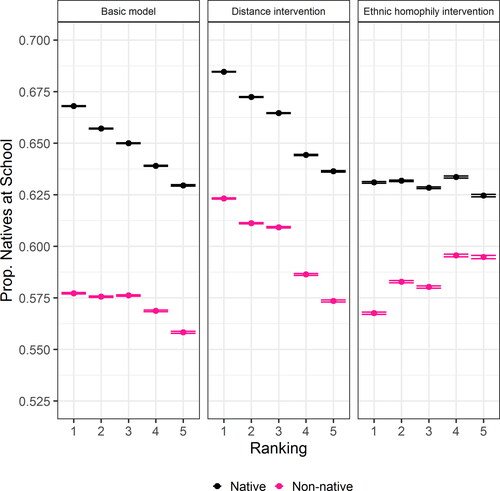
The column Basic Model in displays the school-ethnic-composition hierarchy in the native population. When native students do not consider home-school distance in their ranking formation – the effect of residential segregation is removed – the school-ethnic-composition hierarchy still holds and becomes moderately sharpened (the column Distance-Intervention in ). However, the change for non-native students is accentuated and makes them form their rankings with schools with a higher proportion of natives. This change means that reduction in segregation under this intervention seems to be driven more by non-native students because they will end up in less segregated schools regardless of the ranking they obtain. On the other hand, when removing the school ethnic composition dimension from students’ ranking formation, the school-ethnic-composition hierarchy vanishes for native students –they rank ethnically mixed schools more often– and non-native students rank native-dominated schools more often, especially on rankings below the first. This change suggests that the drop in school segregation under this scenario is driven more by natives ranking mixed schools more often, regardless of what option they get after the allocation process. Interestingly, this intervention produces a lower level of segregation than the distance intervention, as shown in .
Figure 6. Students´ ethnic school preferences by rankings and ethnic groups. Boxplots show the dispersion of 30 executions for each parameter combination.
In summary, the results shown in and suggest that the segregating effect of the grade-based and distance-based priority rules on school segregation, compared to random-based allocation, still holds when we control for residential segregation and students’ ethnic school preferences. Interestingly, both aspects have a greater impact on reducing the levels of school segregation than any priority rule criterion analyzed in this study.
Conclusion and discussion
This study examines how school priority rules shape ethnic school segregation. We argue that this component of the school choice paradigm has received little attention in the segregation literature, despite it being the last filter to understand student distribution across schools. Our analytical strategy consists of three approaches and uses Swedish register data on students’ rank-ordered lists of schools to apply to upper secondary education in Stockholm. In the first approach, we study how the two most common admission rules applied in European countries – grade-based and distance-based – determine school segregation patterns by comparing them with a random-based criterion. In the second approach, we implement a large-scale simulation model to evaluate the effects of the three priority rules from a dynamic perspective. Finally, in the third approach, we controlled our results for two well-established causes of school segregation: residential segregation and students’ school preferences.
Our findings show that grade-based and distance-based priority rules intensify school segregation compared with the random-based setting across all analytical approaches. We show that both criteria increase segregation through distinct mechanisms. In the grade-based priority, the grade disparity between ethnic groups and the school-ethnic-composition hierarchy of native students are responsible for this effect. However, home-proximity assignments and the correlation between school and residential segregation explain the increase in the distance-based criterion. From a dynamic perspective, we find that students’ school preferences foster oversubscription. This effect makes it more difficult for students to get their first-ranked options and increases the number of students not getting any of their preferences. Finally, our results are robust after controlling for residential segregation and students’ school preferences. However, both factors are more determinant in explaining school segregation patterns than all priority rules investigated.
Our study is not free of limitations. In our first approach, we did not control for the effect of other relevant aspects that can play a role in school segregation, such as a change in student demographics, opening-closure of new schools, or change in program supply. We maintain these aspects constant in the simulations. Even though the effect of grade-based and distance-based priority rules holds under the simulation approach, we find that, in general, school segregation depends on how non-allocated students are re-assigned to schools. This finding could help us understand why some studies find the school choice model to be segregation-promoting (Böhlmark, Holmlund, and Lindahl Citation2016; Söderström and Uusitalo Citation2010) while others do not (Gorard and Fitz Citation2000; Noden Citation2000). School segregation dynamics involve complex interactions among students’ school preferences, the student allocation system, and priority rules. The rationality of setting aside other relevant factors from the simulation responds to parsimonious principles in simulation designs that make modelers focus on a narrow set of parameters. However, we believe that other factors that affect the dynamics of school segregation should be integrated into future models as they could potentially trigger different dynamics. Finally, despite the good performance of our statistical and simulation models, we are aware that, in real life situations, students could react differently to new admission rules than those predicted by our statistical models. Nonetheless, our findings have implications for segregation scholars and policymakers.
Our study shows that the two most common admission criteria for allocating students in Europe foster school segregation. These results have substantial implications for understanding how the design of educational institutions plays a role in student outcomes and shed light on the elements policymakers should consider when designing more egalitarian educational policies. Grade-based priorities should be reconsidered given that grade disparity among native and non-native students is a widespread phenomenon in European and US educational contexts (Heath and Brinbaum Citation2014), which prevents minorities from getting into better schools, causing a cumulative detrimental effect on their educational outcomes. Besides, studies show unfair grading practices among ethnic groups and school types (Vlachos Citation2018; Kisfalusi, Janky, and Takács Citation2021; Triventi Citation2020). On the other hand, distance-based priorities will accentuate school segregation as long as residential segregation exists. Policymakers should be aware that the priority rules used to allocate students are not segregation-neutral. Therefore, the design of other priorities, or their reform, is needed and must consider structural aspects, such as residential segregation or grade and income disparities among students. In addition, particular attention must be paid to how non-allocated students are re-assigned to schools, given how much their reassignment affects school segregation.
Lastly, this study contributes to understanding how the school choice paradigm exacerbates school segregation and, consequently, to understanding educational inequality. In particular, our study disentangles one aspect of school choice – priority rules – that has not been studied before and introduces two mechanisms (school ethnic composition hierarchy and nearby-to-home allocation) whereby school choice models lead to school inequality.
Supplemental Material
Download PDF (2.7 MB)Disclosure statement
The authors claim that there is no conflict of interest related to the content of the manuscript.
Additional information
Funding
References
- Abrassart, A., M. R. Busemeyer, M. A. Cattaneo, and S. C. Wolter. 2017. “Do Migrants Prefer Academic to Vocational Education? The Role of Rational Factors vs. social Status Considerations in the Formation of Attitudes toward a Particular Type of Education in Switzerland.” Economics of Education Working Paper Series Num. 0128, University of Zurich, Department of Business Administration (IBW).
- Adams, R., and E. Hawkins. 2018. One-third of London families miss out on first choice of secondary school. The Guardian. March 1. https://www.theguardian.com/education/2018/mar/01/secondary-school-admissions-england-london-first-choice
- Allen, R. 2007. “Allocating Pupils to Their Nearest Secondary School: The Consequences for Social and Ability Stratification.” Urban Studies 44 (4): 751–770. doi:10.1080/00420980601184737.
- Andersson, E., B. Malmberg, and J. Östh. 2012. “Travel-to-School Distances in Sweden 2000-2006: Changing School Geography with Equality Implications.” Journal of Transport Geography 23: 35–43. doi:10.1016/j.jtrangeo.2012.03.022.
- Andersson, E., J. Östh, and B. Malmberg. 2010. “Ethnic Segregation and Performance Inequality in the Swedish School System: A Regional Perspective.” Environment and Planning A: Economy and Space 42 (11): 2674–2686. doi:10.1068/a43120.
- Arvidsson, M., F. Collet, and P. Hedström. 2021. “The Trojan-Horse Mechanism: How Networks Reduce Gender Segregation.” Science Advances 7 (16): eabf6730. doi:10.1126/sciadv.abf6730.
- Bell, C. A. 2009. “All Choices Created Equal? The Role of Choice Sets in the Selection of Schools.” Peabody Journal of Education 84 (2): 191–208. doi:10.1080/01619560902810146.
- Ben-Akiva, M. E., and S. R. Lerman. 1985. Discrete Choice Analysis : theory and Application to Travel Demand. MIT Press, Cambridge, Massachusetts.
- Bifulco, R., H. F. Ladd, and S. L. Ross. 2009. “The Effects of Public School Choice on Those Left behind: Evidence from Durham, North Carolina.” Peabody Journal of Education 84 (2): 130–149. doi:10.1080/01619560902810104.
- Billingham, C. M., and M. O. Hunt. 2016. “School Racial Composition and Parental Choice.” Sociology of Education 89 (2): 99–117. doi:10.1177/0038040716635718.
- Böhlmark, A., H. Holmlund, and M. Lindahl. 2015. School Choice and Segregation: Evidence from Sweden. Uppsala: Institute for Evaluation of Labour Market and Education Policy (IFAU). http://hdl.handle.net/10419/129385www.econstor.eu.
- Böhlmark, A., H. Holmlund, and M. Lindahl. 2016. “Parental Choice, Neighbourhood Segregation or Cream Skimming? An Analysis of School Segregation after a Generalized Choice Reform.” Journal of Population Economics 29 (4): 1155–1190. doi:10.1007/s00148-016-0595-y.
- Bonal, X., A. Verger, and A. Zancajo. 2017. “Making Poor Choices? Demand Rationalities and School Choice in a Chilean Local Education Market.” Journal of School Choice 11 (2): 258–281. doi:10.1080/15582159.2017.1286206.
- Bonal, X., A. Zancajo, and R. Scandurra. 2019. “Residential Segregation and School Segregation of Foreign Students in Barcelona.” Urban Studies 56 (15): 3251–3273. doi:10.1177/0042098019863662.
- Bonal, X., A. Zancajo, and R. Scandurra. 2021. “Student Mobility and School Segregation in an (un)Controlled Choice System: A Counterfactual Approach.” British Educational Research Journal 47 (1): 42–64. doi:10.1002/berj.3694.
- Boyle, C. 2016. Lotteries for Education: Origins, Experiences, Lessons. Andrews UK Limited, UK.
- Branden, M., and M. Bygren. 2018. School Choice and School Segregation: Lessons from Sweden’s School Voucher System. Linköping University Electronic Press, Sweden.
- Burgess, S., and E. Greaves. 2021. “School Choice and Accountability.” Oxford Research Encyclopedia of Economics and Finance, Sep 29. doi:10.1093/acrefore/9780190625979.013.650.
- Burgess, S., B. McConnell, C. Propper, and D. Wilson. 2007. “The Impact of School Choice on Sorting by Ability and Socio‐Economic Factors in English Secondary Education.” In Schools and the Equal Opportunity Problem, 273–292, edited by L. Woessmann, and P. Peterson. Cambridge, MA: MIT Press.
- Card, D., A. Mas, and J. Rothstein. 2008. “Tipping and the Dynamics of Segregation.” Quarterly Journal of Economics 123 (1): 177–218. doi:10.1162/qjec.2008.123.1.177.
- Cordini, M. 2019. “School Segregation: institutional Rules, Spatial Constraints and Households’ Agency.” International Review of Sociology 29 (2): 279–296. doi:10.1080/03906701.2019.1641276.
- Council of Europe. 2017. Fighting School Segregationin Europe Throughinclusive Education: A Position Paper. Council of Europe, France.
- Fandrem, H., H. Jahnsen, S. E. Nergaard, and K. Tveitereid. 2021. “Inclusion of Immigrant Students in Schools: The Role of Introductory Classes and Other Segregated Efforts.” International Journal of Inclusive Education : 1–16. doi:10.1080/13603116.2021.1950222.
- Fjellman, A.-M., K. Yang Hansen, and D. Beach. 2019. “School Choice and Implications for Equity: The New Political Geography of the Swedish Upper Secondary School Market.” Educational Review 71 (4): 518–539. doi:10.1080/00131911.2018.1457009.
- Forsey, M., Davies, S., & Walford, G. (Eds.). 2008, May. The Globalisation of School Choice?. Symposium Books Ltd, United Kingdom.
- Gale, D., and L. S. Shapley. 1962. “College Admissions and the Stability of Marriage.” The American Mathematical Monthly 69 (1): 9–15. doi:10.2307/2312726.
- Gorard, S., and J. Fitz. 2000. “Investigating the Determinants of Segregation between Schools.” Research Papers in Education 15 (2): 115–132. doi:10.1080/026715200402452.
- Gortázar, L., D. Mayor, and J. Montalbán. 2020. “School Choice Priorities and School Segregation: Evidence from Madrid.” Working Paper Series
- Heath, A., and Brinbaum, Y. (Eds.). 2014. Unequal Attainments. Ethnic Educational Inequalities in Ten Western Countries. Proceedings of the British Academy.
- Hedström, P. 2005. Dissecting the Social. Cambridge: Cambridge University Press. doi:10.1017/CBO9780511488801.
- Hedström, M., and P. Mutgan, S. 2019. “Skolsegregation: En Dynamisk Mikro-Makroanalys.” In Segregation: Slutrapport Från Ett Forksningsprogram, p28–38, edited by P. Hedström. Riksbankens Jubileumsfonds Skriftserie: 16.
- Holm, A.-S. 2013. “A Sea of Options. Student Perspectives on Market Competition in Upper-Secondary Schools in Sweden.” Nordic Studies in Education 33 (04): 284–299. doi:10.18261/ISSN1891-5949-2013-04-04.
- Holm, A.-S, and L. Lundahl. 2019. “A Stimulating Competition at the Swedish Upper Secondary School Market?.” In Neoliberalism and Market Forces in Education: Lessons from Sweden, p141–155, edited by M. Dahlstedt and A. Fejes. Routledge, United Kingdom.
- Holmlund, H. 2016. “Education and Equality of Opportunity: What Have we Learned from Educational Reforms?” (Working paper no. 5).
- James, D., and K. Taeuber. 1985. “Measures of Segregation.” Sociological Methodology 15: 1–32. doi:10.2307/270845.
- Jasarovic, D. 2020, September 25. “Trollhättan vill motverka segregation genom att stänga skolor.” Sverigesradio
- Jonsson, J. O., and F. Rudolphi. 2011. “Weak Performance-Strong Determination: School Achievement and Educational Choice among Children of Immigrants in Sweden.” European Sociological Review 27 (4): 487–508. doi:10.1093/esr/jcq021.
- Kessel, D. 2018. School Choice, School Performance and School Segregation: Institutions and Design, Diss. Department of Economics, Stockholm University, Sweden.
- Kisfalusi, D., B. Janky, and K. Takács. 2021. “Grading in Hungarian Primary Schools: Mechanisms of Ethnic Discrimination against Roma Students.” European Sociological Review 37 (6): 899–917. doi:10.1093/esr/jcab023.
- Kornhall, P., and G. Bender. 2019. School Segregation in Sweden: Evidence from the Local Level. NESET Ad hoc report Num. 1.
- Lallinger, S. 2020, June 23. “America’s Segregated Schools: We Can’t Live Together Until we Learn Together.” USA Today.
- Lidström, L., A.-S. Holm, and U. Lundström. 2014. “Maximising Opportunity and Minimising Risk?” YOUNG 22 (1): 1–20. doi:10.1177/1103308813512932.
- Malmberg, B., E. K. Andersson, and Z. Bergsten. 2014. “Composite Geographical Context and School Choice Attitudes in Sweden: A Study Based on Individually Defined, Scalable Neighborhoods.” Annals of the Association of American Geographers 104 (4): 869–888. doi:10.1080/00045608.2014.912546.
- Musset, P. 2012. “School Choice and Equity: Current Policies in OECD Countries and a Literature Review.” OECD Education Working Papers Num. 66.
- National Agency for Education 2012. “Likvärdig utbildning i svensk grundskola? En kvantitativ analys av likvärdighet över tid.” report 374.
- Noden, P. 2000. “Rediscovering the Impact of Marketisation: Dimensions of Social Segregation in England’s Secondary Schools, 1994-99.” British Journal of Sociology of Education 21 (3): 371–390. doi:10.1080/713655353.
- OECD. 2004. Completing the Foundation for Lifelong Learning: An OECD Survey of Upper Secondary Schools. Studienverlag Ges. m.b.H., Innsbruck/OECD Publishing, Paris.
- OECD. 2017. School Choice and School Vouchers: An OECD Perspective. Secretary-General of the OECD.
- OECD. 2018. “PISA Database.” Teacher questionnaire data file. OECD.
- Oosterbeek, H., S. Sóvágó, and B. van der Klaauw. 2021. “Preference Heterogeneity and School Segregation.” Journal of Public Economics 197: 104400. doi:10.1016/j.jpubeco.2021.104400.
- Östh, J., E. Andersson, and B. Malmberg. 2013. “School Choice and Increasing Performance Difference: A Counterfactual Approach.” Urban Studies 50 (2): 407–425. doi:10.1177/0042098012452322.
- PISA in Focus. 2015. What Do Parents Look for in Their Childs School? PISA in Focus, No. 51, OECD Publishing, Paris, https://doi.org/10.1787/5js1qfw4n6wj-en.
- Plank, D. N., and Sykes, G. (Eds.). 2003. Choosing Choice: School Choice in International Perspective. Teachers College Press.
- Rangvid, B. S. 2010. “School Choice, Universal Vouchers and Native Flight from Local Schools.” European Sociological Review 26 (3): 319–335. doi:10.1093/esr/jcp024.
- Riedel, A., K. Schneider, C. Schuchart, and H. Weishaupt. 2009. “School Choice in German Primary Schools: How Binding Are School Districts?” Schumpeter Discussion Papers N0.2009-011, Schumpeter School of Business and Economics, University of Wuppertal.
- Rosenqvist, E. 2018. “Two Functions of Peer Influence on Upper-Secondary Education Application Behavior.” Sociology of Education 91 (1): 72–89. doi:10.1177/0038040717746113.
- Saporito, S., and A. Lareau. 1999. “School Selection as a Process: The Multiple Dimensions of Race in Framing Educational Choice.” Social Problems 46 (3): 418–439. doi:10.2307/3097108.
- Söderström, M., and R. Uusitalo. 2010. “School Choice and Segregation: Evidence from an Admission Reform.” Scandinavian Journal of Economics 112 (1): 55–76. doi:10.1111/j.1467-9442.2009.01594.x.
- Tapia, E. 2021. “Groups’ Contribution to Shaping Ethnic Residential Segregation: A Dynamic Approach.” Journal of Computational Social Science 5 (1): 565–589. doi:10.1007/s42001-021-00136-6.
- Thelin, M., and T. Niedomysl. 2015. “The (ir)Relevance of Geography for School Choice: Evidence from a Swedish Choice Experiment.” Geoforum 67: 110–120. doi:10.1016/j.geoforum.2015.11.003.
- Train, K. 2009. Discrete Choice Methods with Simulation. Cambridge University Press, United Kingdom.
- Triventi, M. 2020. “Are Children of Immigrants Graded Less Generously by Their Teachers than Natives, and Why? Evidence from Student Population Data in Italy.” International Migration Review 54 (3): 765–795. doi:10.1177/0197918319878104.
- Trumberg, A. 2011. Den Delade Skolan: Segregationsprocesser i Det Svenska Skolsystemet. Doctoral dissertation, Örebro universitet, Sweden.
- Trumberg, A., and S. Urban. 2021. “School Choice and Its Long-Term Impact on Social Mobility in Sweden.” Scandinavian Journal of Educational Research 65 (4): 569–583. doi:10.1080/00313831.2020.1739129.
- Vlachos, J. 2018. Trust Based Evaluation in a Market Oriented School System. Research Papers in Economics No 2018:1, Stockholm University, Department of Economics.
- Yang Hansen, K., and J.-E. Gustafsson. 2016. “Causes of Educational Segregation in Sweden – School Choice or Residential Segregation.” Educational Research and Evaluation 22 (1-2): 23–44. doi:10.1080/13803611.2016.1178589.