
Abstract
Going to university is a key route to enhancing life opportunities for young people and for promoting social mobility. Despite the action of widening participation programs, substantial sociodemographic inequalities in participation persist. Few studies have focused on the role that school attended may play in exacerbating or mitigating these inequalities. We explore these issues for England via analysing student-level linked DfE-Ofqual-UCAS administrative data. We find substantial variation in application rates across schools, particularly regarding applications to Russell Group institutions. Crucially, meaningful school differences persist even after adjustment for school differences in student prior achievement and sociodemographics. These findings suggest that unmodelled school-level policies, practices, and context may be influencing students’ decision-making. We conclude that policymakers and university admissions teams would benefit from closer monitoring of differences in application rates across schools and potentially using this information when devising interventions to widen participation and act on higher education inequalities.
Introduction
Overview
The higher education (HE) sector in the UK has seen substantial expansion and a move to a mass university system over the past 60 years (Baker Citation2020; Blanden and Machin Citation2013). However, socioeconomically disadvantaged students continue to be underrepresented in HE, particularly at the most elite or prestigious universities (Boliver Citation2017; Boliver and Powell Citation2023; Dilnot Citation2018; Harrison Citation2011; Gorard et al. Citation2019; Marginson Citation2016; UCAS Citation2021). For instance, the gap in HE entry rates between 18-year-olds in England who are eligible for Free School Meals (FSM) and those who are not increased from 15.6 percentage points in 2013, to 16.9 in 2017 and 18.1 in 2022 (UCAS Citation2023a). The drive to increase the national skill and knowledge base to support the economy, and the widespread understanding of HE as a route to social mobility (Blanden and Machin Citation2013; Boliver Citation2011; Britton, Drayton, and van der Erve Citation2021; Shiner and Noden Citation2015) makes widening participation a continuing goal of educational policy (Archer and Hutchings Citation2000; Dilnot and Boliver Citation2018; Greenbank Citation2006; Harrison Citation2011; Younger et al. Citation2019). The Office for Students (OfS), the regulatory body for HE in England, has set national widening access targets to encourage more rapid action to address inequalities. These include reducing the ratio of participation at high tariff universities between areas with the highest and lowest young participation in HE from 5:1 (in 2017) to 3:1 by 2024/2025, and to eliminate the gap by 2038/2039 (Office for Students Citation2018). Therefore, the continued assessment of socioeconomic and other inequalities in university participation remains important. Many factors determine whether a student attends university. However, the role of schools is understudied in quantitative research. This paper addresses this by investigating school differences in whether and to which types of universities students apply to study.
The UK university admissions system
In the UK, admissions to HE providers, whether these be universities or other institutions offering alternative degree-level courses, are administered by the Universities and Colleges Admissions Service (UCAS). Students typically apply during Year 13 of schooling (age 17/18), and so before receiving their A-level grades or other end-of-school qualifications. The process is multistage: (1) students apply to up to five universities or HE courses; (2) admissions selectors use a range of information including predicted grades, personal statements, and school references to decide whether or not to offer the applicant a place (typically conditional on achieving certain grades); (3) applicants make firm (preferred) and insurance (back-up) choices, with all other offers declined; (4) on results day, students achieving their required grades accept their offered places, else they apply for an unfilled space at a different establishment through a process known as ‘clearing’.
Sociodemographic inequalities in university participation
Final participation inequalities will develop across these admission stages. For example, research has suggested that whilst ethnic minorities apply for university in large numbers, they are at a disadvantage relative to their White counterparts in receiving offers (Boliver Citation2016; Noden, Shiner, and Modood Citation2014; Shiner and Modood Citation2002). In contrast, Del Bono et al. (Citation2022) show that Black and South Asian students were more successful at securing a place through clearing than White students, going some way to offset offer differences. Researchers have emphasised that participation inequalities for socioeconomically disadvantaged students may be most evident at the application stage (Anders Citation2012; Boliver Citation2013). Disadvantaged students may also apply for less ambitious and lower quality courses than their achievement record suggests (Campbell et al. Citation2022; Del Bono et al. Citation2022). Students being well-matched to their degree courses potentially impacts on returns to higher education, with mismatched students tending to underperform. Campbell et al. (Citation2022) demonstrate that socioeconomically disadvantaged students consistently undermatch to their degrees across the achievement spectrum, both in terms of academic qualifications and graduate earnings. They find that the secondary school a student attends has a large degree of explanatory power for explaining this mismatch gap, suggesting features of schools, such as school ethos, support around career advice, and peer effects play an important role in influencing degree matching (Campbell et al. Citation2022).
Crucially, an understudied aspect of participation inequalities is the decision to apply to university at all. Partly, this results from the dominance of the administrative data provided for reanalysis by UCAS, which restricts researchers to analysing what happens to the subset of students who applied to university. For example, Boliver (Citation2013) explores the probability of applying to the Russell Group conditional on applying to university at all, while Del Bono et al. (Citation2022) explore differences in the ‘ambition’ of course applications (measured through the difference between a student’s predicted tariff score and that of those accepted in the previous year). One exception is Anders (Citation2012) who, via analysing the Longitudinal Survey of Young People in England, showed a large socioeconomic gap in the probability of university application. However, they gave limited attention to variation between schools and their data was drawn before the introduction of higher tuition fees in 2012 which may have influenced the relationship of disadvantage with university applications. Other studies make use of linkages between student cohorts and data from the Higher Education Statistics Agency (HESA) which enables exploration of university participation for a wider group of students than just those who apply. For example, Crawford et al. (Citation2016) demonstrate socioeconomic differentials in entry to university for a cohort of state school students (free to attend schools) taking their GCSEs (national age 15/16 examinations) in 2008 in England. However, as HESA data pertains to students who attend university, they do not consider the process of applying in the first instance. UCAS does provide statistical releases which give breakdowns of application rates by various student characteristics using population estimates, but these are in the form of unadjusted, raw rates (UCAS Citation2023b). We will contribute to the study of university participation by drawing on new linked administrative data to explore school differences in the decision to apply to university at all and how this interacts with socioeconomic characteristics for all A-level students in England in 2019.
Explaining socioeconomic inequalities
The decision to apply to university at all is the first step to enabling disadvantaged students to realise the benefit of HE. Previous studies highlight the role of low achievement in explaining socioeconomic differentials in university participation, with many studies showing diminished or non-significant relationships between socioeconomic status and attendance after controlling for prior achievement (Anders Citation2012; Chowdry et al. Citation2013; Marcenaro-Gutierrez, Galindo-Rueda, and Vignoles Citation2007). However, research also emphasises the extra pressures and difficulties facing disadvantaged students that leave them less likely to take up HE opportunities, and to receive the full benefit of these (Crawford Citation2014; Gorard et al. Citation2019). These wider issues help explain the gulf between the ‘promise’ of university expansion and the persistence of inequalities (Brown Citation2013; Thompson and Simmons Citation2013). Qualitative studies have indicated the range of motives and factors that could play a role in application decisions for socioeconomically disadvantaged students. For instance: attitudes to financial risk which may also shape the locality of institutions applied to; the prospect of ‘fitting-in’ at a chosen institution; access to and weight placed on ‘hot’ knowledge (acquired through professional and peer networks) vs. ‘cold’ knowledge (from prospectuses or websites); and differences in institutional habitus to orientate towards more elite choices compared with more advantaged students (Bathmaker, Ingram, and Waller Citation2013; Baker Citation2020; Reay et al. Citation2001; Shiner and Noden Citation2015; Slack et al. Citation2014).
The role of schools
Schools differ in the sociodemographic make-up of their cohorts, and thus schools with larger numbers of disadvantaged students would be expected to show lower overall application rates given the national underrepresentation of disadvantaged students at university. Identifying variation across schools that remains once we have accounted for student disadvantage, prior achievement, and other demographic characteristics, may further understandings of participation inequalities. The greater the remaining variation across schools the more support for the argument that schools’ policies, practices, and context directly influence students’ application decisions. This in turn would support those promoting ‘school-based’ strategies for widening participation (Younger et al. Citation2019). Equally, by studying the remaining variation across schools, one can identify schools with unusually high or low participation rates for further investigation. School performance is officially monitored in terms of student destinations post-16–18 study, including progression to higher education or training (Department for Education Citation2022), however, this takes the form of unadjusted ‘raw’ rates.
Differences in school culture and support may help to explain identified associations where students attending grammar or independent schools are more likely to apply to the Russell Group (Boliver Citation2013), and have a higher likelihood of receiving an offer (Noden, Shiner, and Modood Citation2014), and of being admitted to HE (Anders Citation2012; Marcenaro-Gutierrez, Galindo-Rueda, and Vignoles Citation2007). Schools may also create institutional habitus and practices that influence university decision-making. For instance, teachers may foster early expectations for applying to ‘Oxbridge’ (Oxford or Cambridge University) (Donnelly Citation2014), whilst other schools will not have the same culture of support around HE prospects, meaning students must rely on other social networks (Reay Citation1998). The provision of specific subject teachers, curricula, and support around choices at transition phases means schools may also play a role in determining the subjects that students apply to study at university (Iannelli Citation2013). Subject choice has been highlighted as a key factor in bridging or barring university applications (Dilnot Citation2018) and is related to broader career aspirations (Baker Citation2020), where the subject studied at university may also impact on later earnings (Belfield et al. Citation2018; Britton, Drayton, and van der Erve Citation2021). Research notes how students from disadvantaged backgrounds are less likely to choose A-level subjects deemed helpful in facilitating entry to selective universities (Dilnot Citation2016) and draw attention to the differentials between state and independent schools (private fee-paying schools) in the availability of such subjects (Dilnot Citation2015). However, how schools influence application choices in terms of the subject studied is not our focus here.
In all these studies, the discussion of the role of schools is commonly framed in terms of differences between school types; there is far less work focusing on the unique effects of individual schools. Where studies have acknowledged individual school effects, they have done so for the purpose of statistical control rather than to explore the magnitude of these school differences (Chowdry et al. Citation2013). This study addresses this gap using multilevel models to describe and explain variations in application rates across schools.
Considering different types of applications
The effects of schools on university applications may operate differently for different types of institutions. Despite the union of university provisions under the Further and Higher Education Act 1992, there remains a division between so-called ‘old’ and ‘new’ universities (Boliver Citation2015). Many older institutions and the 24 research-intensive universities comprising the ‘Russell Group’ routinely feature in the top half of prominent university league tables (Shiner and Noden Citation2015). There may be a particular concern for how well schools support applications to these most prestigious establishments, given their greater underrepresentation of disadvantaged students (Boliver Citation2017; Dilnot Citation2018; Gorard et al. Citation2019) and the links between these universities and higher labour market outcomes (Belfield et al. Citation2018; Bratti et al. Citation2004). We, therefore, explore school effects on university applications across the institution ‘status’ range.
Research questions
This study contributes to research exploring participation inequalities in HE by investigating school effects on university applications for students in England. We focus on the decision to apply to university at all, as well as exploring which students applied to the Russell Group, conditional on making any application. We address the following research questions: (1) What is the extent of school-level variation in applying to university and to what extent do student characteristics explain these school differences? (2) What are the associations of student and school characteristics with university applications and how does this vary between types of application?
Data
Source
This analysis uses the GRading and Admissions Data for England (GRADE) dataset (ONS Citation2021) (see https://www.gov.uk/government/collections/grade-data-sharing-project for more information). This is a novel data collaboration between the Office for Qualifications and Examinations Regulation (Ofqual), the Department for Education (DfE), and UCAS, covering GCSE (age 16) and A-level (age 18) grades for English students between 2017 and 2020. The dataset combines information on GCSE and A-level examinations and qualifications collected from awarding organisations (the Ofqual component), extracts from the National Pupil Database (NPD) containing sociodemographic student characteristics (the DfE component), and data from the university application process (the UCAS element).
Sample
To analyse school differences in university applications, we use the NPD student census to identify a sample of 17/18-year-old A-level students from the 2018/19 academic year. This is the most recent ‘normal’ year (where students last sat examinations before the Covid-19 pandemic) provided in the GRADE dataset. We link these students with their examination results from the Ofqual dataset and information from UCAS where students made a university application. Our sample, therefore, does not include independent school students (who are not captured by the NPD), those taking solely qualifications other than A-levels, or participating in alternative 16–19 education routes, such as apprenticeships. The final sample consists of 145,179 students, nested within 1930 schools. We use schools throughout to refer to the educational establishments that students attend and in which they take their A-level examinations. However, these represent a range of educational centres including sixth form and further educational colleges.
Outcomes
Our outcomes are measured at the student level, and we focus on application to universities, as opposed to other types of HE establishments. These represent the vast majority of applications (90.2% of all HE applications for our student cohort). Whilst our student sample is based in England, we include applications to any UK universities. There are 136 universities represented in our sample, 24 of which comprise the Russell Group (see the Supplementary Material for the university list). We explore three outcomes: (1) whether the student makes any application to a university course, (2) whether they apply to at least one Russell Group university, and (3) whether they apply to three or more Russell Group universities.
Student characteristics
We obtain a set of sociodemographic student characteristics from the NPD student census dataset. These are the student’s gender (Male, Female), ethnicity (White, Black, Asian, Chinese, Mixed, Other, Unclassified), Special Educational Needs (SEN) status (No SEN, SEN), speaking English as an Additional Language (EAL) (Not EAL, EAL), Income Deprivation Affecting Children Index (IDACI) quintile of their home neighbourhood, and Free School Meal eligibility (Non-FSM, FSM).
IDACI quintile and FSM status are the main measures of socioeconomic disadvantage used in this analysis. We do not utilise other measures of disadvantage commonly used in the assessment of widening access, notably the POLAR (participation of local areas) classification which groups areas based on the proportion of young people participating in higher education. This measure was only available with the UCAS dataset and therefore limited to the subset of students who apply to university, whilst by using the socioeconomic variables available in the NPD dataset we could maintain consistency across all outcomes. Additionally, recent work has shown that the POLAR classification may incorrectly identify individuals as socioeconomically disadvantaged at an unacceptably high rate (Boliver, Gorard, and Siddiqui Citation2022). This same work recommends the use of individual-level indicators of socioeconomic disadvantages, such as FSM eligibility (Boliver, Gorard, and Siddiqui Citation2022).
From the Ofqual component of the GRADE dataset, we utilise a mean GCSE score summarising the average achievement of the student across their GCSE examinations, split into quintiles. We also record whether the student took one, two, or three or more ‘facilitating’ subjects at A-level. The facilitating subjects are a set of subjects considered as most often preferred or required by universities and thus stand students in good stead for future options (NFER Citation2019). The subjects are English literature, mathematics and further mathematics, physics, chemistry, biology, history, geography, and modern or classical languages. We do not adjust for A-level examination results as applications are typically made before these examinations are taken.
School characteristics
The Ofqual dataset also provides some information on the school a student attends. We utilise information on school region and school type. The region is summarised as London, North East, North West, Yorkshire and the Humber, East Midlands, West Midlands, East of England, South East, and South West. We categorise school type into Academies (schools funded directly by the Government with more control over how they run), Comprehensives (schools run by the Local Authority), Selective (Grammar schools that actively select students based on high achievement), Sixth Form Colleges (those that only teach ages 16–19 for advanced school-level qualifications), Further Education Colleges/Tertiary (covering other studies which are post-secondary but not part of HE) and an Other category to cover remaining establishments.
Methods
In this analysis, we explore the effect of schools on the decision to apply to university. Firstly, we use descriptive statistics to summarise both school-level variation in application rates and the variation in application rates by student characteristics. Secondly, we use multilevel models to explore the variation in our application outcomes positioned at the school level (a more detailed explanation of the models involved is given in the Supplementary Material). We explore a series of models to address our research questions. Model 1 is an unadjusted model with no covariates, used to establish the baseline variation across schools in the probability of applying to university. Models 2 and 3 add, firstly the sociodemographic characteristics of students, and then student prior achievement and facilitating subjects taken, to evaluate how school-level variation reduces on accounting for these student characteristics. As we progressively adjust our models, we aim to move closer to isolating the impact of schools’ policies and practices on our chosen outcomes, separated from simple school differences in student intake. However, we cannot rule out the possibility that the identified school effects are reflections of other unobserved student characteristics. Model 4 controls for the school characteristics, and so we shift focus from trying to isolate the impact of schools to starting to examine the degree to which variation across schools may be predicted by features of the schools themselves. To gain further insight into application inequalities, we also repeat our main analysis for the larger sample of students (511,706 students) present for their GCSE examinations (age 15/16) two years earlier in 2017. In this way, we can assess application rates before the decisions for further study at A-level are made.
Our outcomes are binary, whether a student makes a certain type of application or not. We explore relationships to university applications using multilevel linear probability models. These models are simpler to work with than multilevel logistic regression and offer a close approximation of results when the overall probability of the binary outcome is not extreme (generally between 0.25 and 0.75) (Scott Long, Citation1997). The overall rates for our outcomes are 0.72 for applying to any university, and, conditional on applying, 0.71 for applying to at least one Russell Group university, and 0.40 for applying to three or more Russell Group universities.
Results
Descriptive results
Overall, 72.2% of students made applications to universities in the 2019 application cycle. Conditioning on making an application to university, 70.9% of students apply to at least one Russell Group university, whilst 40.1% apply to three or more Russell Group universities. The breakdown of application rates by the number of Russell Group applications is given in the Supplementary Material (Supplementary Table S1).
provides the application rates for our three outcomes (applying overall, to at least one Russell Group, and to at least three Russell Group universities) by the student characteristics. It shows that ethnic minority students show the highest application rates overall (relatedly EAL students also show higher rates of application than non-EAL students). In the case of Russell Group applications, Chinese students are particularly more likely to apply (both for making at least one (88.6%) or three or more Russell Group applications (65.3%) in comparison to White students (68.9 and 39.4%). Asian and other ethnicity students also show some of the highest application rates to the Russell Group. Despite high overall application rates, Black students show the lowest rates when we consider applying to three or more Russell Group universities (35.0%). Students with SEN show lower application rates across all three outcomes compared to non-SEN students.
Table 1. Application rates by student characteristics for applying to any university, applying to at least one Russell Group university or three or more Russell Group universities.
Students eligible for FSM are only marginally less likely to apply to university overall (71.1% compared with 72.3% for non-FSM students), but the difference is larger as we consider applying to three or more Russell Group establishments (around 8.1 percentage points). Likewise, there is only a 0.9 percentage-point difference between the most and least deprived students in the overall application rate, but this increases to 5.9 percentage points for applying to at least one Russell Group and to 13.8 percentage points for applying to three or more Russell Group universities. Therefore, socioeconomic differentials appear more prominent when considering elite university applications. However, it is important to remember that our student sample is conditional on staying in school post-16 and studying A-levels. The equivalent application rates taking the sample of students present at GCSE (age 15/16, 511,706 students) are given in Supplementary Table S2. From this, we can see much more dramatic differences in application rates across the socioeconomic measures. The FSM gap is 16.7 percentage points (36.1 for non-FSM, 19.4 for FSM students) compared with just a 1.2 percentage-point difference for the A-level sample. Likewise, the gap in overall application rates between the most and least deprived IDACI quintiles for the GCSE sample is 19.1 percentage points, larger than that seen for Russell Group applications conditional on applying. Therefore, the underrepresentation of students of lower socioeconomic status at universities is an issue that emerges earlier in the educational life course and is likely related to the underperformance of disadvantaged students, giving rise to decisions not to study for A-levels or to leave the education system altogether at the end of secondary schooling.
Additionally, shows the application rates by quintiles of mean GCSE score and the number of ‘facilitating’ subjects taken. These variables show the most dramatic differences in application rates. Students in the lowest quintile of GCSE score have a 54.6% overall application rate, whilst those in the top quintile show an application rate of 88%. The differences are further exaggerated as we consider applications to Russell Group universities. For example, there is a 76.1 percentage-point difference between the lowest and highest GCSE score quintiles when considering applying to three or more Russell Group establishments, and a 59.1 percentage-point difference in application rate between those taking no facilitating subjects and those taking three or more for the same outcome. The descriptive statistics for the A-level and GCSE samples are provided in Supplementary Tables S3 and S4.
Table 3. School and student variances, percentage of total variance at the school-level, and percentage change in school-level variance from the previous model for making any application to university, to at least one Russell Group university and three or more Russell Group universities.
In terms of school characteristics (), we see that those in academically selective schools show the highest rates of application overall (82.4%) and to the Russell Group (85.6% for at least one Russell Group application made, 59.2% for three or more). In contrast, students in typical comprehensives, academies, or sixth form colleges show relatively lower application rates to Russell Group institutions (68.7, 70.2, and 68.4% for making at least one Russell Group application, respectively). The differential between selective schools and other school types is more stark when we consider the GCSE sample (Supplementary Table S5) where the overall application rate is 72.6% for selective schools compared with 34.6% for academies, for example. There is some regional variation evident for our main A-level sample as well. Students in the South West (66.1%), North West (66.9%), and North East (67.3%) show the lowest overall application rates, whilst those in London (76.4%) and the West Midlands (77.0%) show the highest. However, considering applications made to the Russell Group, it is those in the East Midlands who show the lowest application rates (62.2 and 32.2% for at least one and for three or more Russell Group applications), compared with 77.6 and 46.2% shown for London (which shows high application rates across all three outcomes). As these descriptive summaries do not take other factors into account, the higher rates of application in London may be an effect of the greater proportion of ethnic minority students (which we have already seen are more likely to apply) in this region.
Table 2. Application rates by school characteristics for applying to any university, applying to at least one Russell Group university or three or more Russell Group universities.
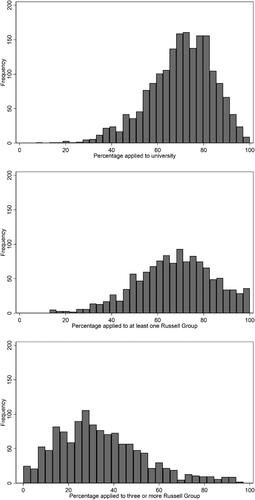
shows the percentage of students within schools making applications to university. Overall, in many schools, most students apply for university (peak at around 70–80%). However, there is a long tail of schools where the percentage of making applications is much lower. Conditional on making an application to university at all, there is a large spread of schools with differing percentages of students applying to at least one or three or more Russell Group universities. A long tail of schools with very high percentages of students applying to three or more Russell Group institutions is present, and there is a substantial number of schools where all students are applying to at least one Russell Group university. Altogether, there appears to be a considerable degree of school-level variation in university applications.
Figure 1. School-level histograms of the percentage of students applying to university overall (top), to at least one Russell Group university (middle), and to three or more Russell Group universities (bottom) within schools.
Research Question 1: What is the extent of school-level variation in applying to university and to what extent do student characteristics explain these school differences?
Firstly, in Model 1 (the unadjusted model, see ) we find a reasonable degree of school-level variation in the probability of applying to university, and particularly so as we consider making more Russell Group applications. For applications overall, 7.5% of the variation in the probability of applying to university relates to school-level differences in application rates, compared with 12.1% for making at least one Russell Group application and 13.9% for making three or more such applications. The addition of student sociodemographic characteristics in Model 2 explains a small degree of the school-level variation in the probability of applying. The sociodemographic characteristics explain 20% of the school-level variation for overall applications, 4% for applying to at least one Russell Group, and 6.1% for applying to three or more Russell Group universities. Therefore, other features of schools (apart from the sociodemographic mix of their cohorts) may be accounting for the differences we see between schools. For instance, some schools may have a stronger culture orientating students towards elite universities, stronger links to local institutions, or a broader vocational direction that influences application decisions.
More dramatic reductions in school variation are seen in Model 3 where we additionally control for mean GCSE score and the number of facilitating subjects taken at A-level, particularly in the case of our two Russell Group outcomes. For example, the school-level variation in the probability of applying to at least one Russell Group university drops by 66.7% from Model 2 to Model 3, whilst the decrease is 71.0% for applying to three or more Russell Group universities. This leaves 5.4 and 5.7% of the total variation in the probability of applying positioned between schools for these outcomes, respectively. Therefore, the achievement profile of students within a school is a powerful factor in explaining differences between schools in applications. In Model 4, we shift focus to relating the variation in school effects to variation in school characteristics. We find that school type and region explain a further small proportion of school-level variation in application rates, and more so for Russell Group applications.
In additional analyses predicting overall applications to university with the sample of students present at GCSE (Supplementary Table S6) we see a slightly higher degree of school level variation in the unadjusted model (12.4% at the school level vs. 7.5% for the A-level sample). However, we also find that more school-level variation is explained by the student sociodemographics (48.4% change from the unadjusted model vs. 20.0% for the A-level sample) and by prior achievement/facilitating subjects (77.7 vs. 25.0% for the A-level sample). This suggests that the factors influencing selection into A-level study play an important role in overall university application rates.
Though the variation between schools in our adjusted models is considerably smaller than in the unadjusted models, we can still identify considerable heterogeneity between schools. In our adjusted model we have, in effect, statistically equated the student body in each school and so the school differences remaining reflect factors beyond those captured by our rich set of control characteristics. Examining the difference between schools lying at the 25th and 75th percentiles from Model 3 we find an ∼10 percentage-point difference in the application rate across all three outcomes. Comparing schools lying at the 10th and 90th percentile, we see a 19 percentage-point difference across all three outcomes (see Supplementary Table S7). These school differences are larger than many of the differences between student characteristics shown in . Furthermore, for applying to any university, 38.0% of school effects are significantly different from the average in Model 1, but 21.7% of schools still have effects significantly different from the average in Model 4. Similar results are found for applications to at least one Russell Group university (39.4 and 16.2%) and to three or more Russell Group universities (39.1 and 18.4%). When we examine the differences between schools across the percentile distribution in our analysis of the GCSE sample (Supplementary Table S8), we see smaller differences than present for the A-level analysis (a 6 percentage-point difference between the 25th and 75th percentiles, and 13 percentage-points between schools at the 10th and 90th from Model 3). This matches up with the extra explanatory power we see for student sociodemographic characteristics and prior attainment in the GCSE sample.
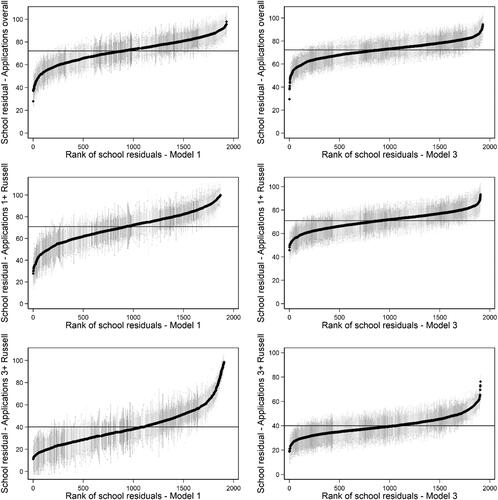
provides the caterpillar plots of the predicted application percentages at the school level from Models 1 and 3 for all outcomes, where we have centred these around the overall national mean application percentage (indicated by the horizontal line on the plot). We have restricted the plot to those school effects whose predicted application percentages are within the 0–100 range (the overwhelming majority), however, some effects still show confidence intervals outside this range, a limitation of using a linear probability model. The range of effects is larger in the unadjusted model than in the adjusted version, as we would expect. For example, for applications to at least one Russell Group university, the predicted school application rates lie between 50 and 80%, whereas, in Model 3, this reduces to between 60 and 70%. There is a noticeable tail of schools with particularly high percentages of applicants to three or more Russell Group universities in the unadjusted model, and whilst diminished, a small set remains in the adjusted model. Similarly, there is an outlying school with a particularly low application rate for overall applications. Examination of the underlying data reveals this to be an all-boys school. We do not have further detail on the school, for instance, whether it is particularly vocationally orientated which could contribute to the lower rates seen. This outlier highlights the utility of examining individual school effects: the ability to identify unusual cases for further investigation. Overall, schools appear to remain an important source of variability in university application rates, even in our model adjusted for student sociodemographic characteristics, prior achievement, and taking facilitating subjects.
Figure 2. Predicted percentage rates of application for schools in rank order for models unadjusted (Model 1, left) and adjusted for student sociodemographics, prior achievement, and facilitating subjects taken (Model 3, right) for applying to university overall (top), applying to at least one Russell Group university (middle), and applying to three or more Russell Group universities (bottom).
Research Question 2: What are the associations of student and school characteristics with university applications and how does this vary between types of application?
Examination of the model results in Supplementary Tables S9–S11 reveals how the student and school characteristics related to university applications, conditional on students staying in school post-16 and doing A-levels. The regression coefficients measure the change in the predicted probability of applying associated with the presence of each characteristic, conditioning on the other characteristics. In Model 2, it is apparent that Black, Asian, and Chinese students have the highest likelihood of applying overall, with regression coefficients relating to a 0.12, 0.11, and 0.10 higher probability of applying in comparison with White students. Chinese students show a substantially higher likelihood of applying to Russell Group universities, for instance, their regression coefficient shows a 0.13 increase in probability over White students in applying to three such institutions. EAL students also show higher probabilities of applying overall and to at least one Russell Group, but these differences are smaller in magnitude. SEN students show a consistently lower probability of applying, with a stronger association as students apply to more prestigious universities. Female students are more likely to apply overall, however, they have a lower probability for Russell Group applications (regression coefficients of −0.02 for both Russell Group outcomes).
In Model 2, across the IDACI quintiles, the results suggest students in more deprived areas have a lower probability of applying, and this is most pronounced for applying to three or more Russell Group universities. The regression coefficient for students in the most deprived areas shows a 0.08 decrease in probability in comparison with those in the least deprived areas, whereas for students in the second least deprived area, the difference is only 0.03. By FSM status we identify small but significant decreases in comparison with non-FSM students for all the outcomes. Our sample consists of those that stayed on to study A-levels post-16. When we repeat the analysis with the larger sample of students present age 16 at GCSE (see Supplementary Table S6) the results strengthen. The FSM gap is now 0.09 and the difference between the least and most deprived areas increases to 0.15 in Model 2. Clearly, disadvantaged students are already choosing a more vocational rather than academic track before the decision to apply to university (Baker Citation2020).
Model 3 includes controls for student prior achievement at GCSE and the number of facilitating subjects studied at A-level. As expected, these appear strongly related to the probability of applying to university. Having a mean GCSE score in the top quintile relates to a 0.22 probability increase in applying overall compared to those scoring in the lowest quintile, all else equal. This increases to a 0.48 and a 0.59 probability increase when we consider applying to at least one or three or more Russell Group universities. Taking facilitating subjects at A-level also appears strongly related to applications, where students taking three or more of these subjects show a 0.17 increase in the probability of applying overall compared with those not taking any facilitating subjects (accounting for all other student characteristics). The educational history of students is clearly important to their probability of application.
The addition of prior achievement and facilitating subjects in the model also impacts on the other associations. The coefficients for Chinese students are reduced in size from an increase of 0.13 in probability over White students in applying to three or more Russell Group universities to a 0.07 higher probability. In the case of Black students, we find in Model 3 that the associations for this group increase, most notably for applications to the Russell Group. For applying to at least one Russell Group, Black students move from a 0.02 higher probability to a 0.08 higher probability, whereas for applying to three or more Russell Group universities the change is from a negative coefficient (-0.03) to a positive relationship (0.03). This shows that Black students may be making ambitious university choices in comparison to White students when considering their educational track record and subject choice. With the additional controls in Model 3, we find no significant association with FSM status, and there is little differentiation seen across the IDACI quintiles. It may be that disadvantaged students who stay on to study A-levels post-16 share other unmeasured characteristics that relate to university application decisions.
Finally, in Model 4 we add school characteristics. Students in selective schools show a higher probability of applying (all else equal) for all three outcomes compared with those in academies with this being most evident in relation to applying to three or more Russell Group applications (0.05). As with the descriptive results, when we repeat the analyses with the larger sample of students present at GCSE, the association for selective schools is slightly stronger than that we see for the main A-level sample (0.07 for applying overall vs. 0.03 at A-level). Students in the North East and North West are less likely to apply overall (−0.04 and −0.06), but this relationship does not hold for our two Russell Group outcomes conditional on the other student characteristics. When considering applications to three or more Russell Group universities, almost all the regions show significantly lower application probabilities than London (the reference).
Discussion
In this study, we capitalise on a new linked administrative dataset to investigate school differences in university applications, including the decision to apply at all, and so we address two previously understudied aspects of participation inequalities. We identify substantial heterogeneity between schools in the probability of making applications to university, and this is particularly the case regarding applying to Russell Group universities. In the unadjusted models, we find 12.1% of the variation in the likelihood of applying to at least one Russell Group university is positioned between schools, rising to 13.9% for applying to three or more of these prestigious establishments. Importantly, significant differences across schools remain in accounting for key student characteristics, including their prior achievement at GCSE and taking ‘facilitating’ subjects at A-level. For instance, in the fully adjusted models, we find an ∼10 percentage-point difference between schools at the 25th and 75th percentiles of application rates across all three outcomes. These differences across schools are apparent despite the likely mitigating impact of widening participation policies currently in operation, which we are not able to document or control for with our dataset.
Our results also demonstrate the benefit of examining school effects to identify unusual cases. For instance, those with particularly low rates, even given the sociodemographic and achievement composition of their students. Whilst we cannot rule out the possibility that the identified school effects are reflections of other unobserved student characteristics, outlying schools may still offer useful information which can be used to target further investigations and interventions for improving university participation. This could be, for instance, establishing widening participation connections with universities, and creating networks to facilitate the transfer of ‘hot’ knowledge to prospective applicants (Slack et al. Citation2014). Unusual schools may also serve as useful case studies for understanding the operation of different application support systems.
Additionally, our findings further understandings of sociodemographic inequalities in university admissions by demonstrating differences at the application stage. Previous research has indicated ethnic inequalities in university participation, with minorities at a disadvantage, particularly regarding admission to high-status universities (Boliver Citation2016; Noden, Shiner, and Modood Citation2014). We show that ethnic minority students were more likely to make applications overall and particularly to apply to Russell Group universities. Ethnic inequalities in university participation are therefore likely to emerge at the latter stages of the admissions process, suggesting further review of the process may be required. As with previous studies (Chowdry et al. Citation2013) our models indicated that prior achievement is a vitally important factor for application decisions, diminishing much of the differences between schools and reducing associations of student sociodemographics with applications. Critically, in our additional analyses using the larger GCSE sample we demonstrated that student disadvantage was more strongly related to the likelihood of applying to university than we saw at A-level. Therefore, it would appear many disadvantaged students are selecting off the A-level post-16 academic track, limiting options for university application and ultimate attendance at HE. Therefore, researchers should remain aware of these earlier processes when studying later participation inequalities. Moreover, the findings indicate that earlier intervention to support educational achievement for the most disadvantaged groups may be an effective tool to increase university participation and support social mobility.
Considering the role of prior educational records in university applications is complicated by the role of subject choice in limiting or facilitating a student’s options, and this applies throughout time from GCSE choices to A-level to university decisions (Dilnot and Boliver Citation2018). We accounted for the number of ‘facilitating’ subjects a student took at A-level, however, future research would benefit from using the GRADE dataset to explore how more detailed subject choices relate to university/course combinations for different student groups. Previous work has indicated that socioeconomic gaps may vary according to the subject studied (Britton, Drayton, and van der Erve Citation2021) and that there may be differences in university and subject choices between students from vocational or academic educational tracks (Baker Citation2020). In the analysis of subject choice, the role of schools could also be important, given potential differences in teacher and curriculum provision, as well as support for informed choices earlier in secondary schooling (Dilnot Citation2015).
Furthermore, we had a limited set of school characteristics to draw upon for this analysis, future analyses could explore which features of schools are associated with particularly low or high application rates. It would be useful to know school attitudes to university, whether the school has a particular vocational focus, and what widening participation schemes the school may be involved in, for example. Our main analyses of A-level students focused on school type at this timepoint, however, were we to consider any selection of students between pre-16 and post-16 educational establishments this could change the degree of school variation we identified. For example, some of the differences between schools could be suppressed if parents of privately educated students are attempting to take advantage of perceived positive discrimination towards state schools by moving their children to state schools for post-16 education (The Telegraph Citation2023).
Additionally, work by Donnelly and Gamsu (Citation2018) emphasises the importance of geography and the historic spatialisation of social identities to higher education choices, and how (im)mobility in university choice plays a role in the reproduction of disadvantage. We paid limited attention to the geographic aspects of university applications in this analysis, but future work would benefit from building on such insights. We were also limited in respect of the geography of application choices in that our sample pertained only to students from England, whereas students from across the UK also apply to attend the studied universities and there may be important social and educational differences between the UK nations in terms of the role schools play in these application choices.
Overall, there is considerable school-level variation in student applications to university, and this varies according to the type of application students are making. In the pursuit of understanding and acting on inequalities in university participation, it may be beneficial for researchers and policymakers to pay attention to schools as sites for widening participation activities. That is, it may not be sufficient or effective to simply target underrepresented or disadvantaged students without also being aware of their institutional environment. More broadly, whilst the decision to apply at all is a crucial step in university participation, and thus supporting applications should aid in addressing participation inequalities, it is important to not fall into the trap of thinking this will unproblematically translate to improvements for social mobility. As others have highlighted (Byrom and Lightfoot Citation2013; Crawford Citation2014; Gorard et al. Citation2019), disadvantaged students face a remit of heightened challenges in progressing successfully through university and into the labour market, therefore, addressing wider social inequalities, alongside a focus on university participation, should remain a key goal.
Supplemental Material
Download MS Word (64 KB)Acknowledgements
This work was produced using statistical data from ONS which is Crown Copyright. The use of the ONS statistical data in this work does not imply the endorsement of the ONS in relation to the interpretation or analysis of the statistical data. This work uses research datasets that may not exactly reproduce National Statistics aggregates.
Disclosure statement
No potential conflict of interest was reported by the author(s).
Additional information
Funding
References
- Anders, J. 2012. “The Link between Household Income, University Applications and University Attendance.” Fiscal Studies 33 (2): 185–210. https://doi.org/10.1111/j.1475-5890.2012.00158.x
- Archer, L., and M. Hutchings. 2000. “Bettering Yourself’? Discourses of Risk, Cost and Benefit in Ethnically Diverse, Young Working-Class Non-Participants’ Constructions of Higher Education.” British Journal of Sociology of Education 21 (4): 555–574. https://doi.org/10.1080/713655373
- Baker, Z. 2020. “The Vocational/Academic Divide in Widening Participation: The Higher Education Decision Making of Further Education Students.” Journal of Further and Higher Education 44 (6): 766–780. https://doi.org/10.1080/0309877X.2019.1599328
- Bathmaker, A.-M., N. Ingram, and R. Waller. 2013. “Higher Education, Social Class and the Mobilisation of Capitals: Recognising and Playing the Game.” British Journal of Sociology of Education 34 (5–6): 723–743. https://doi.org/10.1080/01425692.2013.816041
- Blanden, J., and S. Machin. 2013. “Educational Inequality and the Expansion of UK Higher Education.” Scottish Journal of Political Economy 60 (5): 578–596. https://doi.org/10.1111/sjpe.12024
- Belfield, C., J. Britton, F. Buscha, L. Dearden, M. Dickson, L. van der Erve, L. Sibieta, A. Vignoles, I. Walker, and Y. Zhu. 2018. The Relative Labour Market Returns to Different Degrees: Research Report. London: Institute for Fiscal Studies. Accessed November 7, 2022. https://assets.publishing.service.gov.uk/government/uploads/system/uploads/attachment_data/file/714517/The_relative_labour_market-returns_to_different_degrees.pdf
- Boliver, V. 2011. “Expansion, Differentiation, and the Persistence of Social Class Inequalities in British Higher Education.” Higher Education 61 (3): 229–242. https://doi.org/10.1007/s10734-010-9374-y
- Boliver, V. 2013. “How Fair Is Access to More Prestigious UK Universities?” The British Journal of Sociology 64 (2): 344–364. https://doi.org/10.1111/1468-4446.12021
- Boliver, V. 2015. “Lies, Damned Lies, and Statistics on Widening Access to Russell Group Universities.” Radical Statistics 113: 29–38.
- Boliver, V. 2016. “Exploring Ethnic Inequalities in Admission to Russell Group Universities.” Sociology 50 (2): 247–266. https://doi.org/10.1177/0038038515575859
- Boliver, V. 2017. “Misplaced Optimism: How Higher Education Reproduces Rather than Reduces Social Inequality.” British Journal of Sociology of Education 38 (3): 423–432. https://doi.org/10.1080/01425692.2017.1281648
- Boliver, V., S. Gorard, and N. Siddiqui. 2022. “Who Counts as Socioeconomically Disadvantaged for the Purposed of Widening Access to Higher Education?” British Journal of Sociology of Education 43 (3): 349–374. https://doi.org/10.1080/01425692.2021.2017852
- Boliver, V., and M. Powell. 2023. “Competing Conceptions of Fair Admissions and Their Implications for Supporting Students to Fulfil Their Potential at University.” Perspectives: Policy and Practice in Higher Education 27 (1): 8–15.
- Bratti, M., A. McKnight, R. Naylor, and J. Smith. 2004. “Higher Education Outcomes, Graduate Employment and University Performance Indicators.” Journal of the Royal Statistical Society Series A: Statistics in Society 167 (3): 475–496. https://doi.org/10.1111/j.1467-985X.2004.0apm1.x
- Britton, J., E. Drayton, and L. van der Erve. 2021. Which University Degrees Are Best for Intergenerational Mobility? London: Institute for Fiscal Studies. Accessed November 7, 2022. https://ifs.org.uk/sites/default/files/output_url_files/Which-university-degrees-are-best-for-intergenerational-mobility.pdf
- Brown, P. 2013. “Education, Opportunity and the Prospects for Social Mobility.” British Journal of Sociology of Education 34 (5–6): 678–700. https://doi.org/10.1080/01425692.2013.816036
- Byrom, T., and N. Lightfoot. 2013. “Interrupted Trajectories: The Impact of Academic Failure on the Social Mobility of Working-Class Students.” British Journal of Sociology of Education 34 (5–6): 812–828. https://doi.org/10.1080/01425692.2013.816042
- Campbell, S., L. Macmillan, R. Murphy, and G. Wyness. 2022. “Matching in the Dark? Inequalities in Student to Degree Match.” Journal of Labor Economics 40 (4): 807–850. https://doi.org/10.1086/718433
- Chowdry, H., C. Crawford, L. Dearden, A. Goodman, and A. Vignoles. 2013. “Widening Participation in Higher Education: Analysis Using Linked Administrative Data.” Journal of the Royal Statistical Society Series A: Statistics in Society 176 (2): 431–457. https://doi.org/10.1111/j.1467-985X.2012.01043.x
- Crawford, C. 2014. Socio-economic Differences in University Outcomes in the UK: Drop-Out, Degree Completion and Degree Class. IFS Working Papers, No. W14/31. London: Institute for Fiscal Studies (IFS). Accessed November 28, 2022. https://ifs.org.uk/sites/default/files/output_url_files/WP201431.pdf
- Crawford, C., P. Gregg, L. Macmillan, A. Vignoles, and G. Wyness. 2016. “Higher Education, Career Opportunities, and Intergenerational Inequality.” Oxford Review of Economic Policy 32 (4): 553–575. https://doi.org/10.1093/oxrep/grw030
- Del Bono, E., L. Fumagalli, A. Holford, and B. Rabe. 2022. University Access: The Role of Background and COVID-19 throughout the Application Process. ISER Working Paper Series, No. 2022-7. Colchester: Institute for Social and Economic Research.
- Department for Education. 2022. Official Statistics: Destinations of Key Stage 4 and 5 Students: 2021 [Website]. London: Department for Education. Accessed December 5, 2022. https://www.gov.uk/government/statistics/destinations-of-key-stage-4-and-5-students-2021
- Dilnot, C. 2015. A Taxonomy of A-Level Subjects according to the Expressed Preferences of Russell Group Universities: Who Does What? Department of Quantitative Social Science Working Paper No. 15-12. London: Institute of Education.
- Dilnot, C. 2016. “How Does the Choice of A-Level Subjects Vary with Students’ Socio-Economic Status in English State Schools?” British Educational Research Journal 42 (6): 1081–1106. https://doi.org/10.1002/berj.3250
- Dilnot, C. 2018. “The Relationship between A-Level Subject Choice and League Table Score of University Attended: The ‘Facilitating’, the ‘Less Suitable’, and the Counter-Intuitive.” Oxford Review of Education 44 (1): 118–137. https://doi.org/10.1080/03054985.2018.1409976
- Dilnot, C., and V. Boliver. 2018. “Admission to Medicine and Law at Russell Group Universities: The Impact of A-Level Subject Choice.” In Evaluating Equity and Widening Participation in Higher Education, edited by P. J. Burke, A. Hayton, and J. Stevenson, 59–87. London: Trentham Books.
- Donnelly, M. 2014. “The Road to Oxbridge: Schools and Elite University Choices.” British Journal of Educational Studies 62 (1): 57–72. https://doi.org/10.1080/00071005.2014.902028
- Donnelly, M., and S. Gamsu. 2018. “Regional Structures of Feeling? A Spatially and Socially Differentiated Analysis of UK Student Im/Mobility.” British Journal of Sociology of Education 39 (7): 961–981. https://doi.org/10.1080/01425692.2018.1426442
- Gorard, S., V. Boliver, N. Siddiqui, and P. Banerjee. 2019. “Which Are the Most Suitable Contextual Indicators for Use in Widening Participation to HE?” Research Papers in Education 34 (1): 99–129. https://doi.org/10.1080/02671522.2017.1402083
- Greenbank, P. 2006. “The Evolution of Government Policy on Widening Participation.” Higher Education Quarterly 60 (2): 141–166. https://doi.org/10.1111/j.1468-2273.2006.00314.x
- Harrison, N. 2011. “Have the Changes Introduced by the 2004 Higher Education Act Made Higher Education Admissions in England Wider and Fairer?” Journal of Education Policy 26 (3): 449–468. https://doi.org/10.1080/02680939.2010.513742
- Iannelli, C. 2013. “The Role of the School Curriculum in Social Mobility.” British Journal of Sociology of Education 34 (5–6): 907–928. https://doi.org/10.1080/01425692.2013.816031
- Marcenaro-Gutierrez, O., F. Galindo-Rueda, and A. Vignoles. 2007. “Who Actually Goes to University?” Empirical Economics 32 (2–3): 333–357. https://doi.org/10.1007/s00181-006-0090-5
- Marginson, S. 2016. “The Worldwide Trend to High Participation Higher Education: Dynamics of Social Stratification in Inclusive Systems.” Higher Education 72 (4): 413–434. https://doi.org/10.1007/s10734-016-0016-x
- NFER. 2019. A Level Entry Patterns: How Much Influence Did the Russell Group’s List of Facilitating Subjects Have? Berkshire: National Foundation for Educational Research. Accessed November 7, 2022. https://www.nfer.ac.uk/news-events/nfer-blogs/a-level-entry-patterns-how-much-influence-did-the-russell-group-s-list-of-facilitating-subjects-have/
- Noden, P., M. Shiner, and T. Modood. 2014. “University Offer Rates for Candidates from Different Ethnic Categories.” Oxford Review of Education 40 (3): 349–369. https://doi.org/10.1080/03054985.2014.911724
- Office for National Statistics. 2021. ONS SRS Metadata Catalogue, GRading and Admissions Data England-Ofqual-DfE-UCAS, dataset, released 14 December 2021. https://doi.org/10.57906/k68n-bt74
- Office for Students. 2018. A New Approach to Regulating Access and Participation in English Higher Education: Consultation Outcomes. OfS 2018.53. London: Office for Students. Accessed June 1, 2023. https://www.officeforstudents.org.uk/media/546d1a52-5ba7-4d70-8ce7-c7a936aa3997/ofs2018_53.pdf
- Reay, D. 1998. “Always Knowing’ and ‘Never Being Sure’: Institutional and Familial Habituses and Higher Education Choice.” Journal of Education Policy 13 (4): 519–529. https://doi.org/10.1080/0268093980130405
- Reay, D., J. Davies, M. David, and S. J. Bell. 2001. “Choices of Degree or Degrees of Choice? Class, ‘Race’ and the Higher Education Choice Process.” Sociology 35 (4): 855–874.
- Scott Long, J. 1997. Regression Models for Categorical and Limited Dependent Variables. Advanced Quantitative Techniques in the Social Sciences Number 7., Sage Publications, Thousand Oaks, CA.
- Shiner, M., and T. Modood. 2002. “Help or Hindrance? Higher Education and the Route to Ethnic Equality.” British Journal of Sociology of Education 23 (2): 209–232. https://doi.org/10.1080/01425690220137729
- Shiner, M., and P. Noden. 2015. “‘Why Are You Applying There?’: ‘Race’, Class and the Construction of Higher Education ‘Choice’ in the United Kingdom.” British Journal of Sociology of Education 36 (8): 1170–1191. https://doi.org/10.1080/01425692.2014.902299
- Slack, K., J. Mangan, A. Hughes, and P. Davies. 2014. “‘Hot’, ‘Cold’ and ‘Warm’ Information and Higher Education Decision-Making.” British Journal of Sociology of Education 35 (2): 204–223. https://doi.org/10.1080/01425692.2012.741803
- The Telegraph. 2023. Private School Pupils More Likely to Get into Cambridge If They Move to State Sixth Form. London: The Telegraph. Accessed July 3, 2023. https://www.telegraph.co.uk/news/2023/05/16/private-schools-university-entry-cambridge-state-schools/
- Thompson, R., and R. Simmons. 2013. “Social Mobility and Post-Compulsory Education: Revisiting Boudon’s Model of Social Opportunity.” British Journal of Sociology of Education 34 (5–6): 744–765. https://doi.org/10.1080/01425692.2013.816038
- UCAS. 2021. What Happened to the Covid Cohort? Lessons for Levelling Up in 2021 and Beyond. Cheltenham: Universities and Colleges Admissions Service. Accessed June 1, 2023. https://www.ucas.com/file/396231/download?token=qcQl7Fyy
- UCAS. 2023a. UCAS Undergraduate End of Cycle Data Resources 2022. Cheltenham: Universities and Colleges Admissions Service. Accessed June 1, 2023. https://www.ucas.com/data-and-analysis/undergraduate-statistics-and-reports/ucas-undergraduate-end-cycle-data-resources-2022
- UCAS. 2023b. UCAS Cycle Applicant Figures – 25 January Deadline. Cheltenham: Universities and Colleges Admissions Service. Accessed June 2, 2023. https://www.ucas.com/data-and-analysis/undergraduate-statistics-and-reports/ucas-undergraduate-releases/ucas-undergraduate-applicant-releases-2023-cycle/2023-cycle-applicant-figures-25-january-deadline
- Younger, K., L. Gascoine, V. Menzies, and C. Torgerson. 2019. “A Systematic Review of Evidence on the Effectiveness of Interventions and Strategies for Widening Participation in Higher Education.” Journal of Further and Higher Education 43 (6): 742–773. https://doi.org/10.1080/0309877X.2017.1404558