
Abstract
This paper investigates the level of LGBT+ representation among staff and students in higher education in England and Wales. We compare data from the 2021 England and Wales Census to Higher Education Statistics Agency (HESA) data. We find that LGBT+ people are more highly represented in higher education among all staff groups and students than in relevant comparator groups according to age and educational level in the general population. LGBT+ representation among students and STEM academics is modestly higher than the general population comparator group, while representation among non-STEM academics is substantially higher than one would expect from the general population comparator group. We found no statistically significant under-representation in any particular higher education institution.
Keywords:
Introduction
Higher Education institutions rightly seek to be diverse and inclusive. Many initiatives focus on LGBT+ people as a group which is presumed to be underrepresented. For example, university job adverts often include an EDI statement encouraging applications from groups deemed to be underrepresented, including LGBT+ applicants.Footnote1
For the first time, it is possible to assess the state of LGBT+ (Lesbian, Gay, Bisexual, Trans and others whose orientation is stated as other than heterosexual) representation in Higher Education in England and Wales.
The 2021 census for England and Wales was the first to include questions on sexual orientation and gender identity. This provides a vital resource for equalities monitoring, because, without population data, we have nothing to compare institutional and sector data to.
Our analysis examines staff representation across academic and non-academic roles and seniority levels, and looks at both staff and student representation for STEM and non-STEM subjects. The disciplinary breakdown is of interest because there have been claims that LGBT+ people are particularly underrepresented in Science, Technology, Engineering and Mathematics (STEM) (Freeman Citation2018). For example, the Royal Society of Chemistry (RSC) has announced a programme of grants funded by the government Department of Science Innovation and Technology to address LGBT+ under-representation in STEM.Footnote2 An RSC submission to a parliamentary enquiry into Diversity and Inclusion in STEM stated ‘As our data and evidence shows, LGBT+ individuals are a group facing significant barriers to representation, progression and retention in STEM.’Footnote3 Yet the report (Dyer et al. Citation2019) they refer to does not quantify representation, progression or retention. The institute of Physics (IOP) informed the same enquiry that there is ‘significant underrepresentation’ of ‘those who identify as LGBT+’Footnote4 but provided no evidence to support this, and their own evidence on trans representation appears to contradict their claim.
While under-representation and discrimination are not synonymous, if a group is under-represented, discrimination would represent one possible explanation for this. Another explanation which is often put forward is a lack of role models for under-represented groups. A systematic review of the literature on role models in STEM (Gladstone and Cimpian Citation2021) notes enthusiasm among educators for the view that ‘you can’t be what you can’t see,’ but acknowledges that the evidence base for the effectiveness of role models is mixed.
The Government Equalities Office (GEO) commissioned the National Institute of Economic and Social Research (NIESR) to conduct a review of the evidence base regarding inequality experienced by lesbian, gay, bisexual and transgender people in the UK (Hudson-Sharp and Metcalf Citation2016). This review noted that much of the extant literature relies on bespoke surveys using unrepresentative samples which may be biased towards activist respondents. Despite Hudson-Sharp and Metcalf noting the problems with unrepresentative bespoke surveys, GEO responded by commissioning ‘The National LGBT Survey’ (Government Equalities Office Citation2018a; Government Equalities Office Citation2018b). This online survey was a self-selection sample of ‘individuals aged 16 or over who were living in the UK and self-identified as LGBT or intersex,’ and gathered 108,100 responses (Government Equalities Office Citation2018b). Despite being a large sample, this does not overcome the problems inherent in unrepresentative and potentially biased samples, and the lack of non-LGBT respondents for comparison purposes.
The study of LGBTQ+ issues in education and society has become a substantial field in sociology (Allen Citation2015; Serrano Amaya and Rios Gonzalez Citation2019). However, there is a limited literature on LGB+ labour market outcomes in the UK using high quality data. We describe the results of some of the key studies below.
As Hudson-Sharp and Metcalf (Citation2016) point out in their systematic review, ‘Much of this evidence points towards higher employment rates, occupational levels and earnings for LGB people than for heterosexual people.’ (Hudson-Sharp and Metcalf Citation2016, p.iii). However, there are some differences in findings across studies.
For example, a report of the Equalities and Human Rights Commission (EHRC) (Ellison and Gunstone Citation2009) finds a substantial pay advantage both for gay men and lesbians compared to their heterosexual counterparts. This is reduced but remains apparent once educational qualifications are accounted for. Among those with NVQ4 level qualifications, 62% of gay men compared to 54% of straight men and 42% of lesbians compared to 29% of heterosexual women, earned over £26,000 per annum. This study was based on a 2009 Yougov survey with respondents recruited from a self-selected online research panel with a random sample of heterosexual controls. The results were weighted by age, sex, employment, socio-economic classification, region and educational level. While this is superior to a self-recruiting convenience sample such as that used in the National LGBT Survey, it is not a nationally representative population study.
In a separate report for EHRC, Li, Devine, and Heath (Citation2008) analyse the General Household Survey (GHS) and Labour Force Survey (LFS), comparing same-sex and opposite-sex couple households, and find that ‘People in same-sex couples are more likely to be highly educated, in employment, earning more money, and occupying higher class positions’ (p.7). In 2004/05, women in same-sex partnership households had substantially higher weekly earnings than women in opposite-sex partnership households (£437 compared to £293). In contrast to Ellison and Gunstone, they find the LGB advantage is largely accounted for by the higher educational credentials of LGB respondents. Li et al.’s study has the advantage of being nationally representative, but the disadvantage of only identifying sexuality via the proxy of the sex of a co-habiting partner, thus excluding single people.
There is evidence of variability between the lesbian, gay and bisexual populations. Studies generally point towards an advantage for gay and lesbian people, but those studies which treat bisexuals as a distinct group tend to find that they are at a disadvantage compared to same-sex attracted people and heterosexuals. For example, Aksoy, Carpenter, and Frank (Citation2018) find that gay men earn more than heterosexual men and lesbians earn more than heterosexual women, but bisexual men earn less than heterosexual men and bisexual women’s earnings are not statistically significantly higher than those of heterosexual women. They suggest that the lesbian advantage over heterosexual women may be explained partly by differences in the domestic division of labour. Aksoy et al. find that women cohabiting in same-sex couples earn more than women in heterosexual couples, whereas men in co-habiting same-sex couples earn less than men who cohabit with a female partner. This may suggest that the presence of a female partner is beneficial for both males and females. A distinctive pay disadvantage for bisexual (but not homosexual) men is also found by Bryson (Citation2017).
We focus here on the UK literature, but it is worth noting a highly-cited US study which puts forward the view that employers have a ‘taste for discrimination’ against gay employees (implying that employers discriminate due to their own preferences rather than efficiency considerations) (Badgett Citation1995). Badgett has argued that the idea that gay people are relatively affluent is a myth (Badgett Citation1997). Her 1995 study uses the pooled US General Social Survey (GSS) for 1989-91. A marked difference with other labour market studies is the question on sexuality used by the GSS, which is about behaviour rather than sexual orientation. Respondents were asked ‘Now thinking about the time since your 18th birthday (including the past 12 months) how many male [female] partners have you had sex with?’ Respondents were told that ‘frank and honest’ responses were important for understanding how to deal with the AIDS epidemic. The response rate to this question does not appear to be noted in the paper. Four different operationalisations of being behaviourally gay/bisexual are presented in the paper. For the unadjusted analysis, respondents who reported at least one same-sex partner were coded as behaviourally gay/bisexual, with no distinction between these categories, and no account taken of the total number of sexual encounters, which may be associated with a higher chance of at least one same-sex encounter. 34 women and 47 men out of a sample of 1,680 respondents were categorised as LGB according to this criterion. Even in the unadjusted data, Badgett finds a pay disadvantage for both lesbian/bisexual women and men compared to their straight counterparts. Badgett’s research was of course constrained by the data available at the time. We have not seen this result replicated elsewhere in the literature.
The wider literature shows that, beyond the labour market, there are areas of life where LGBT people are clearly disadvantaged to varying degrees. In an analysis of Understanding Society, the UK Household Longitudinal Study, (Booker, Rieger, and Unger Citation2017), bisexual respondents were found to have substantially worse physical and mental health than heterosexuals, with gay and lesbian respondents in between. Analysis of the Millennium Cohort Study (Khanolkar et al. Citation2023) shows that the mental health disadvantage affecting sexual minorities persists among young people born in 2000–2001 in the UK. There may be reciprocal relationships between health and employment outcomes.
As far as we are aware, the only previous study of the representation of LGB people in UK Higher Education is based on a survey of six universities carried out by the Association of University Teachers (AUT) in 2000/2001(Frank Citation2006). This online survey achieved a response rate of 15%, yielding 813 responses from both academic and professional staff, including 110 LGB respondents. Frank finds no evidence among for a pay differential among LGB men or LGB women compared to their heterosexual counterparts. Combining academic and non-academic positions into a combined set of seniority ranks, Frank finds that, conditioning on a range of factors, LGB males are more likely to be in the lower ranks. However, no statistically significant LGB differential is found in a separate analysis of academics only. Following Badgett (Citation1995) Frank puts forward an explanation of his results in terms of a ‘taste for discrimination’ by employers against gay men, though this would appear to entail a specific prejudice against LGB men and not women, and not leading to pay discrimination.
It is worth noting that studies reflect the context of their time and place, and we may well expect the position of LGBT employees to have changed over time with changing social mores and legal changes. In the UK, relevant legislation from 2000 onwards includes: Equalisation of the age of consent (2000); Civil Partnerships (2004); Same Sex Marriage (2013); Gender Recognition Act (2004); the EU Equality Employment Framework Directive which extended legal protection in the workplace to cover sexual orientation (2003); and the Equality Act (2010). Attitudes to same-sex relationships have changed dramatically over time. According to the British Social Attitudes survey, in 2000, just over a third of respondents (34%) thought that sexual relations between two adults of the same sex was ‘not wrong at all’ (as opposed to rarely, sometimes, mostly or always wrong). By 2022, 67% of respondents said same-sex relations were ‘not wrong at all’ (NatCen Social Research Citation2023).
Rationale
The current paper is the first to assess LGBT+ representation in UK Higher Education in comparison to population data. We compare Higher Education Statistics Agency (HESA) data and 2021 Census data for England and Wales to assess the level of representation of staff and students according to sexual orientation and gender identity. We examine the representation of staff across academic and non-academic roles, professorial and senior-leadership positions, STEM and non-STEM subjects. We examine the representation of students in STEM and non-STEM subjects. We disaggregate according to the component categories of LGBT+: lesbian, gay, bisexual, trans and ‘plus’ in order to understand how representation may vary across these diverse groups. We also examine variability in LGBT+ representation across Higher Education Institutions.
Universities are engaged in various activities to promote Equality, Diversity and Inclusion (EDI). It is desirable that the prioritisation of such activities should be evidence-led. Many universities are members of the Stonewall Diversity Champions and Workplace Equality Index (WEI) schemes. Some submissions to the WEI assume that LGBT+ people are an underrepresented group and describe positive action measures that the university is taking to address this.Footnote5 Universities rely heavily on evidence from Stonewall which is based on its own bespoke surveys reporting on the subjective perceptions of respondents (Bachmann and Gooch Citation2018). Objective data on representation may be helpful in interpreting such data on subjective experiences.
Data
The decennial census for England and Wales took place in March 2021. Most respondents completed the census online, but a paper option was also available. The Census Act 1920 makes it compulsory for everyone in England and Wales to take part in the census in accordance with the Order and Regulations. The response rate was 97% (ONS Citation2022). Some census questions are compulsory, but the questions on sexuality and gender identity are optional.
HESA collects, assures and disseminates data about higher education in the UK. Higher education (HE) providers in the UK have statutory requirements to submit student data.Footnote6 All HE Providers in Wales must submit data on both academic and non-academic staff. All approved (fee cap) HE Providers in England must submit data on academic staff, and may choose whether to submit data on non-academic staff.Footnote7 We use HESA data for 2021/22. HESA data has been used extensively to examine inequalities in Higher Education, for example in research on widening student participation (Boliver, Gorard, and Siddiqui Citation2021; Fuller Citation2001; Waters et al. Citation2013) and on staff representation (Baltaru Citation2024; Marini Citation2018).
Our key variables of interest are sexuality and gender identity. We analyse these in the context of other variables, described below.
To provide baseline data on the proportion of LGB+ individuals in England and Wales, we used data from the 2021 census. This was a custom census data set containing counts at local tier local authority level categorized by: 7 age categories; sexual orientation; sex; and highest level of qualification. The two categories of qualification that we used in our analysis are ‘Level 3 qualifications’ which includes 2 or more A-levels and ‘Level 4 qualifications or above’ which includes a degree. We computed a numeric value for the age for individuals under 75 by taking the midpoint of each age category.
For baseline data on the number of trans individuals in England and Wales we again used census data, but in this case we used two publicly available data sets which disaggregate the data by age and by highest level of qualification, using the same categories as above. We coded individuals who are classified in the census as ‘Gender identity the same as sex registered at birth’ as ‘Not trans,’ those who didn’t answer as unknown trans status and all other categories as ‘trans.’
The ONS sexual orientation question is: ‘Which of the following best describes your sexual orientation?’ The response categories are: Straight/heterosexual; Gay or lesbian; Bisexual; Other sexual orientation (write in). The estimates on sexual orientation in the census appear to be broadly in line with the ONS Annual Population Survey (APS) data (Office for National Statistics Citation2023). The question recommended by HESA is similar to the ONS question: ‘What is your sexual orientation?’ The response categories are: Bisexual; Gay man; Gay woman/lesbian; Heterosexual; Other.
We acknowledge that the question on gender identity used by the Office for National Statistics (ONS) is flawed. The question ‘Is the gender you identify with the same as your sex registered at birth?’ appears to have confused some respondents, leading to false positives, particularly for people who are not fluent in English or lack basic educational qualifications (Biggs Citation2024). HESA used an almost identical question ‘Does your gender identity match your sex as registered at birth?’ Given that the HESA sample is more highly educated than the general population, the HESA estimate of the trans population is likely to be more accurate than the census figures. Given the concerns that have been raised about the accuracy of the census data on trans identification, we did not feel it was appropriate to perform as detailed an analysis of the trans data as we performed of the LGB+ data.
We compared the census data with custom data sets prepared by HESA from their full-person-equivalent data sets on both staff and students. In these data sets, counts are scaled according to the proportion of time an individual is contracted in their role. Where necessary, we rounded the data to the nearest integer.
The staff data set included additional fields indicating: higher education provider; age; sex; sexual orientation; contract level; cost centre (‘STEM,’ ‘Non STEM’); academic employment marker (academic or not); and gender reassignment.
The student dataset included: the higher education provider; sex; sexual orientation; cost centre; and gender reassignment fields only.
From the name of the higher education provider, we identified the best matching local tier local authority within the census dataset to enable comparisons with census data in the local area. Where possible this was done by using the postcodes found in a HESA table of metadata about universities. Where this failed, we searched for the provider using Google and used the first postcode we found on the institutional website. This also allowed us to identify higher education providers that are not based in England and Wales and discard these from our data sets.
Missing data
The question on sexual orientation in the census is optional. 7.47% of census respondents did not provide their sexual orientation. The level of non-response varies somewhat with age and in a non-linear fashion, with 16-24 year olds and those aged over 75 being least likely to respond (9.6% and 10.4% non-response respectively). The level of non-response does not vary substantially with sex. The gender-identity question in the census is also optional and was not answered by 6% of respondents.
The sexual orientation of 7.84% of HESA respondents is categorized as ‘Information refused’ and as ‘Unknown/Not applicable’ for 40.2% of respondents. The non-response levels vary with age from 5.85% for the youngest age group to 11.6% for those over 66. The unknown levels vary from 32.4% for those aged 26-35 to 50.5% for those over 66.
Descriptive Statistics
shows the high-level descriptive statistics for LGBT+ representation in higher education institutions in England and Wales and compare them against census data. We use the abbreviation LGB+ to refer to those who identify as Lesbian or Gay Woman (L), Gay man (G), Bisexual (B) or Other (+). The columns show: LGB+ as an aggregate; lesbians; gay men; bisexuals (both male and female); LGB females; LGB males; Trans.
Table 1. High-level descriptive statistics showing LGBT+ populations in England and Wales and in HEIs.
The proportions in are based only on records where a respondent’s sexuality or trans status is known. In the Appendix A, we compute reweighted estimates to account for the missing data in our sample to see if demographic patterns in non-response may be biasing our statistics. We found that the difference between these reweighted estimates and the raw data is negligible.
Before analysing the data, we need to consider what comparators to use. In analyses of the labour market representation of particular groups, the simple overall representation of the group in the general population is often taken as the comparator. For example, a recent analysis of ethnic minority representation in UK Higher Education takes this approach (Gibney Citation2022) and concludes that people of Black Caribbean, Bangladeshi and Pakistani ethnicities are under-represented. Conversely, some studies of LGBT+ labour market outcomes present models which appear over-specified, making the results difficult to interpret. For example, a study using the Labour Force Survey to examine the relationship between sexual orientation and wages (Arabsheibani, Marin, and Wadsworth Citation2005) includes current occupational class and labour market sector among a raft of other controls. Controlling for closely related labour market outcomes in a regression on wages seems inappropriate and makes the meaning of the results difficult to interpret.
The LGBT+ population is on average younger and more highly educated than the general population. Therefore, in what follows, we draw comparisons with appropriate groups in terms of age and educational level.
Staff LGB+ data
In the 2021 England and Wales census, 3.42% of the population said they were LGB+, but this rose to nearly 4.95% of the population of working-age people with level 4 (degree equivalent) qualifications. We treat this as the baseline for comparison for staff.
The HESA data reveal that for Higher Education staff, this rose to over 8%, with LGB+ staff disproportionately represented in every category. 6.87% of staff in STEM subjects are LGB+, which is higher than the general population, but not dramatically so. In non-STEM subjects, over 10% of staff are LGB+, more than twice the figure one might expect from the general population.
We see that there is statistically significant LGB+ over-representation at all levels of seniority and among both academic and non-academic staff at a confidence level of p ≤ 0.001.
Although LGBT+ is often used as an umbrella term, there is no reason to assume that each category under this umbrella shares a similar experience. We find that the level of representation varies between these groups. For example, gay men are 2.9 times and lesbians 1.8 times more represented as senior managers than one would expect, whereas bisexual people are not over-represented. We find statistically significant over-representation in most categories except among bisexual senior managers and professors and ‘plus’ senior managers. The under-representation of bisexual senior managers and professors is statistically significant, but, as we show below, is an artefact of the age distribution.
In we show the proportion of bisexual professors and senior managers by age which shows that there is no under-representation of professors once age is taken into account. Nevertheless, there still is an apparent under-representation of senior managers, but it is clear from that a more appropriate baseline in this case would be the proportion of the population aged between 36 and 65 who are bisexual. Using this as a baseline, the p-value of the Fisher exact test is 0.57, so there is no statistically significant under-representation of bisexuals in senior management.
Table 2. Percentage of bisexual professors and senior managers by age, compared to the percentage of bisexuals with level 4 qualifications or above.
We conclude that there is no evidence of sector-wide underrepresentation of LGB+ staff in any of the categories we have considered. Taken as a group, there is considerable over-representation of LGB+ staff at all levels when compared to the baseline of degree holders.
Student LGB + data
For students, we have defined our baseline using the set of individuals aged 16-24 with level 3 qualifications or above. We find that there is a statistically significant over-representation of LGB+ students both in STEM and non-STEM disciplines at a confidence level of p ≥ 0.001.
When the data is broken down into separate categories of lesbian, bisexual, gay and ‘plus’ there is a modest under-representation of lesbians in both STEM and non-STEM disciplines. However, this is more than compensated for by the over-representation of ‘plus,’ and there is no under-representation of LGB+ females. The apparent under-representation of lesbians may be due to same-sex attracted women who attend university being less likely to use the term ‘lesbian’ to describe their sexuality compared to those who do not attend university. Same-sex attracted female students may be more likely to use other terms such as ‘queer’ in comparison to 16–24 year olds with level-3 qualifications who are not higher education students.
Trans data
We have not shown statistical significance calculations for trans staff or students. This is because there are known to be inaccuracies in the census estimates which are likely to have caused the trans population to be over-estimated.
The proportion of the population with level 4 qualifications or above is 0.47%. Using this as a baseline, the data suggest that trans staff are somewhat over-represented except at professorial level, and highly over-represented in senior management, where there are 7.5 times more trans people than one might expect from the baseline data. This over-representation in senior management compared to other staff is statistically significant at the 0.001 level using the Fisher exact test. The data suggest that trans staff are over-represented among non-STEM academics, but that the representation trans staff among STEM academic is broadly similar to the population baseline.
Among students, the number of trans students is slightly lower than the population estimate. It seems plausible that the difference might be explained by the uncertainties in the census estimates.
Because of the uncertainties in the census data on trans status, we will not attempt to analyse the data on gender identity beyond these descriptive statistics.
A logistic regression analysis predicting LGB + status
To examine whether there is evidence of under-representation of LGB+ staff and whether there is evidence of discrimination in promotion we fit a logistic regression model. This model also helps address the concerns arising from the fact that missing data varies with age.
To develop our model, we created a combined data set containing both the census data for our staff LGB+ baseline (individuals aged 16-64 with a level 4 qualification or above) and the HESA staff data. We added a Boolean field ‘Staff’ to indicate whether the data was from our staff data set or the census data set. In order to prevent double-counting of academic staff, we subtracted the number of academic staff within each grouping from the census data.
Our outcome variable was whether an individual was LGB+. We used as explanatory variables: age; sex; the ‘staff’ flag; an individual’s contract level, whether they are employed in a STEM or non-STEM cost centre; and whether they are academic staff. We also looked at interaction terms between pairs of categories. There were numerous interactions but we found that often these indicated that a particular explanatory variable only appeared to affect one subgroup. shows the coefficients of our final model once insignificant terms were removed.
Table 3. Exponentiated logistic regression coefficients for combined census data (individuals aged 16–64 with level 4 qualification and above) and HESA staff data.
Rows 1–3 of apply to the census data and, as expected, show that younger cohorts are more likely to identify as LGB+ than older cohorts. In addition, males are more likely to be LGB+ than females.
The remaining rows 4–10 of apply to staff members and indicate how university staff differ from the census baseline. To aid interpretation, we have selected the default categories so that all these coefficients are positive. Similarly, we have chosen to represent age as a variable ‘years to retirement’ which is always positive and equal to zero at retirement. Because of these observations we are now able to interpret the positive coefficient in row 4 as showing over-representation of LGB+ staff across STEM and non-STEM disciplines, across all contract levels, and for both academic and non-academic staff. Similarly, all the remaining coefficients we will now discuss show further increases of LGB+ over-representation above this baseline.
The interaction term in row 5, while statistically significant, is small. Thus, the dependence of LGB+ status on age is broadly similar in the census data and in the data on university staff.
The interaction term in row 6 shows a small general increase in the number of LGB+ staff outside of STEM disciplines. However, the interaction term in row 7 is much larger, and shows a substantial increase in LGB+ identification among Non-STEM academic staff.
Row 8 indicates that senior managers are more likely to be LGB+ than other contract levels. Row 9 indicates that non-STEM professors are more likely to be LGB+.
Row 10 indicates that males with non-academic contracts are more likely to be LGB+.
Institutional data
Neither the descriptive data we have examined, nor our logistic regression results indicate any under-representation of LGBT+ staff at a sector level. Nevertheless, it is possible that there may be under-representation in some institutions.
In , we plot the proportion of LGB+ staff in each cost centre against a local baseline proportion. This is the proportion of individuals in the local tier local authority of the university who have a level 4 qualification or higher and are aged 16–64.
Figure 1. Scatter plot showing the proportion of staff who are LGB+ against the proportion of degree holders aged 16–64 in the local tier local authority where the higher education provider is based. STEM and non-STEM cost centres are plotted separately. The horizontal line is our benchmark of the proportion of LGB+ degree holders aged 16–64 in England and Wales.
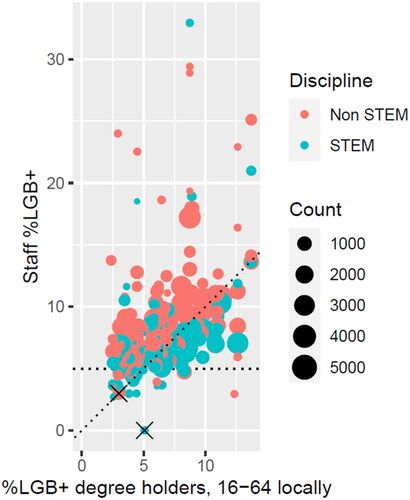
The horizontal line shows the baseline proportion of degree holders aged 16–64 in the UK who are LGB+. Since higher education providers typically recruit staff from across the UK, we believe that to identify under-representation, we should look for those cost centres which fall significantly below this baseline. For each cost centre, we can compute the probability of them recruiting the given level of LGB+ staff or less assuming that they recruit randomly at the baseline level. In , we have marked with a cross the two cost centres for which this probability is less than 5%. The computed probabilities for these two centres are 0.9 and 1.2%. Since our plot contains 201 points, we conclude that a couple of outliers such as these are to be expected. We conclude that we have found no evidence of statistically significant LGB+ under-representation at any institution.
Logistic regression models for contract level
As discussed in the introduction, using data from 2000/1, Frank reported evidence of a ‘gay glass ceiling,’ suggesting that gay men in HE were less likely to achieve promotion.
To test this, we built a logistic regression model with being a professor as the outcome variable. This model used the HESA academic staff data for staff whose sexuality is known, and considered age, sex, sexual orientation and cost centre as possible predictors. We also built a second logistic regression model with being a senior manager as outcome variable. In this model, all HESA data for staff whose sexuality is known was included, and so we additionally used the academic employment marker as a possible predictor.
The results of these regressions are shown in . There was no significant interaction term between sex and discipline in the model for senior managers, so this coefficient was not included in that model. There was no significant interaction between discipline and sexuality in either case so this was not included in the model.
Table 4. Exponentiated logistic regression coefficients with outcome variables of being a professor and being a senior manager. In each model, the base case is of a male heterosexual non-STEM academic.
We find with p < 0.001 that lesbians are more likely to be professors than heterosexual women, and that gay men are more likely to be senior managers than heterosexual men. We also find, with p < 0.05, that bisexuals are less likely, and lesbians more likely, to be senior managers. Given the exploratory nature of our analysis, the latter results should be treated with caution. In addition, we note that our analysis is not longitudinal, so the differences we observe may not necessarily be due to differences in promotion prospects. In particular, senior managers may well be recruited from outside academia and not all staff members will aspire to be promoted to senior management.
Our results do not reproduce Frank’s finding of a ‘gay glass ceiling.’ There are differences between our analysis and Frank’s, but even if we follow Frank’s analysis as closely as is possible, we do not reproduce this finding. One possible reason is that levels of discrimination have decreased since Frank’s study. Another possibility is type I error: Frank’s models include 10 coefficients relevant to the hypothesis of glass ceilings with four having the opposite sign to that predicted by this hypothesis, two being significant at the level p < 0.05 and one being significant at the level p < 0.01. A surprising feature of Frank’s models is that age was not found to be a significant predictor of a more senior contract, and it would seem necessary to understand this difference between our studies before drawing any conclusions on changes in the level of discrimination.
Summary and discussion
Our analyses reveal a positive picture for the higher education sector, suggesting that fears of LGBT+ underrepresentation are unfounded. LGBT+ representation among university staff is high, particularly in non-STEM subjects. These results do not appear to support a narrative of marginalisation of LGBT+ people in recruitment, retention or promotion in Higher Education. Qualitative research has suggested that LGBT people may avoid certain sectors and occupations where they expect to face discrimination, such as manual work, the police force, the armed forces, and teaching (Ellison and Gunstone Citation2009). The high representation of LGBT+ staff and students overall may be due to a range of factors, including higher education being perceived as a tolerant and inclusive environment.
Within STEM subjects, LGBT+ representation is close to population levels, reflecting a typical baseline level of LGBT+ representation among a highly-educated demographic. Researcher sexuality does not typically inform academic practice, and as a result it would seem difficult for recruitment, promotion and grant-awarding panels and peer reviewers to obtain information about academics’ sexuality. Similarly, when recruiting students, sexuality is not likely to be known. In this context, the lack of evidence of LGBT+ under-representation could arguably be seen as predictable.
LGBT+ representation in non-STEM subjects is substantially higher than one would expect from the general population. It is possible that this over-representation may be uneven, with certain academic niches in the arts, humanities and social sciences driving disproportionate representation across non-STEM subjects. Our finding that professors in non-STEM subjects are more likely to be LGB+ than more junior colleagues and the greater over-representation among staff than students suggests that it is not simply a matter of LGB+ individuals being more likely to choose to pursue these subjects. A detailed investigation of the possible drivers of the representation of LGB+ people in non-STEM subjects is beyond the scope of this paper. Both longitudinal research and analyses at the disciplinary level could shed further light on this.
Organisations in the UK are obliged not to discriminate against individuals due to their protected characteristics under the 2010 Equality Act. Positive action can be taken to support under-represented groups. However, in the absence of evidence of LGBT+ under-representation, it seems likely that such ‘positive action’ may be unlawful. Any practices or programmes which are predicated on an assumption of LGBT+ under-representation should be reconsidered in the light of evidence that no such underrepresentation exists. This would include special efforts to advertise roles to LGBT+ audiences for example.
Variability in the representation of the groups under the LGBT+ umbrella suggests that it is important to disaggregate using meaningful categories in order to understand the diverse experiences of these groups. For example, it should not be assumed that lesbians have the same experiences as gay men, and bisexuals may fare worse than gays and lesbians. This suggests that universities should analyse their equalities monitoring data on LGBT+ at a high enough level to make a detailed breakdown possible without running into problems with small cell sizes and identifiability. For example, data analysis at a divisional level may prove more useful than analysis at a departmental level. Universities are bound by the Public Sector Equality Duty which entails a duty to monitor outcomes according to the protected characteristics. In the spirit of this duty, inequalities between different minority sexual orientations should be monitored and data should be disaggregated according to distinct characteristics.
Our findings illustrate the value of census data as a baseline for equalities monitoring. Our analysis also illustrates the value of HESA data in analysing equalities in higher education. Given the importance of open data for the replication and critical analysis of findings, we suggest that HESA should consider making their aggregate-level data available to researchers without charge. By enhancing the level of use of the data, this could also encourage higher education staff to see value in HESA data collection exercises, potentially boosting response rates.
In conclusion, our analysis finds a high level of LGBT+ representation across the higher education sector. Nevertheless, we note that groups which are highly represented can still experience discrimination in many forms, and universities have a duty to promote inclusion for the full diversity of staff and students.
Acknowledgements
We acknowledge the support of ESRC grant reference ES/W013142/1. We are grateful to Michael Biggs and Vikki Boliver for comments on an earlier draft of this paper.
Disclosure statement
No potential conflict of interest was reported by the author(s).
Additional information
Funding
Notes
1 For example, job adverts at UCL state ‘We therefore particularly encourage applications from candidates who are likely to be underrepresented in UCL’s workforce. These include people from Black, Asian and ethnic minority backgrounds; disabled people; LGBTQI+ people; and for our Grade 9 and 10 roles, women.’
2 Royal Society of Chemistry ‘£485,000 of grants awarded to five UK-US partnerships in boost to LGBT+ inclusion in STEM’ £485,000 of grants awarded to five UK-US partnerships to boost LGBT+ inclusion in STEM (archive.org).
3 Written Evidence Submitted by the Royal Society of Chemistry (DIV0032) January 2022 committees.parliament.uk/writtenevidence/42479/pdf/, to the Science and Technology Committee inquiry into Diversity and Inclusion in STEM https://publications.parliament.uk/pa/cm5803/cmselect/cmsctech/95/report.html#:∼:text=We%20launched%20our%20inquiry%20into,in%20STEM%20education%2C%20STEM%20research.
4 Institute of Physics (IOP) Response to the House of Commons Science and Technology Committee Inquiry into Diversity in STEM IOP-response-to-house-of-commons-science-technology-committee-inquiry-into-diversity-in-STEM.pdf.
5 For example, see KCL 2021 submission pages 26, 63, 79 and 149 https://web.archive.org/web/20240608131654/ https://web.archive.org/web/20240608131654/ https://www.whatdotheyknow.com/request/participation_in_stonewall_workp/response/2108077/attach/5/20220824%20Appendix.pdf?cookie_passthrough=1.
References
- Aksoy, Cevat G., Christopher S. Carpenter, and Jeff Frank. 2018. “Sexual Orientation and Earnings: New Evidence from the United Kingdom.” ILR Review 71 (1): 242–272. https://doi.org/10.1177/0019793916687759.
- Allen, Louisa. 2015. “Queering the Academy: New Directions in LGBT Research in Higher Education.” Higher Education Research & Development 34 (4): 681–684. https://doi.org/10.1080/07294360.2015.1055052.
- Arabsheibani, G. Reza, Alan Marin, and Jonathan Wadsworth. 2005. “Gay Pay in the UK.” Economica 72 (286): 333–347. https://doi.org/10.1111/j.0013-0427.2005.00417.x.
- Bachmann, Chaka L., and Becca Gooch. 2018. “LGBT in Britain: Work Report”. London, England: Stonewall.
- Badgett, M. V. Lee. 1995. “The Wage Effects of Sexual Orientation Discrimination.” ILR Review 48 (4): 726–739. https://doi.org/10.1177/001979399504800408.
- Badgett, M. V. Lee. 1997. “Beyond Biased Samples: Challenging the Myths on the Economic Status of Lesbians and Gay Men.” In Homo Economics: Capitalism, Community, and Lesbian and Gay Life, edited by A. Gluckman and B. Reed, 65–71. New York: Routledge.
- Baltaru, Roxana D. 2024. “Minority Ethnic Staff in Universities: Organisational Commitments, Reputation and the (Re) Structuring of the Staff Body.” Sociology 58 (1): 66–82. https://doi.org/10.1177/00380385231163107.
- Biggs, Michael. 2024. “Gender Identity in the 2021 Census of England and Wales: How a Flawed Question Created Spurious Data.” Sociology. https://doi.org/10.1177/00380385241240441.
- Boliver, Vikki, Stephen Gorard, and Nadia Siddiqui. 2021. “Using Contextual Data to Widen Access to Higher Education.” Perspectives: Policy and Practice in Higher Education 25 (1): 7–13. https://doi.org/10.1080/13603108.2019.1678076.
- Booker, Cara L., Gerulf Rieger, and Jennifer B. Unger. 2017. “Sexual Orientation Health Inequality: Evidence from Understanding Society, the UK Longitudinal Household Study.” Preventive Medicine 101: 126–132. https://doi.org/10.1016/j.ypmed.2017.06.010.
- Bryson, Alex. 2017. “Pay Equity after the Equality Act 2010: Does Sexual Orientation Still Matter?” Work, Employment and Society 31 (3): 483–500. https://doi.org/10.1177/0950017016664678.
- Dyer, J., A. Townsend, S. Kanani, P. Matthews, and A. Palermo. 2019. Exploring the Workplace for LGBT+ Physical Scientists: A Report by the Institute of Physics. London, England: Institute of Physics, Royal Astronomical Society, and Royal Society of Chemistry.
- Ellison, Gavin, and Briony Gunstone. 2009. Sexual Orientation Explored: A Study of Identity, Attraction, Behaviour and Attitudes in 2009. Manchester, England: Equality and Human Rights Commission.
- Frank, Jeff. 2006. “Gay Glass Ceilings.” Economica 73 (291): 485–508. https://doi.org/10.1111/j.1468-0335.2006.00516.x.
- Freeman, Jon. 2018. “LGBTQ Scientists Are Still Left out.” Nature 559 (7712): 27–28. https://doi.org/10.1038/d41586-018-05587-y.
- Fuller, Alison. 2001. “Credentialism, Adults and Part-Time Higher Education in the United Kingdom: An account of Rising Take up and Some Implications for Policy.” Journal of Education Policy 16 (3): 233–248. https://doi.org/10.1080/02680930110041042.
- Gibney, Elizabeth. 2022. “How UK Science is Failing Black Researchers-in Nine Stark Charts.” Nature 612 (7940): 390–395. https://doi.org/10.1038/d41586-022-04386-w.
- Gladstone, Jessica R., and Andrei Cimpian. 2021. “Which Role Models Are Effective for Which Students? A Systematic Review and Four Recommendations for Maximizing the Effectiveness of Role Models in STEM.” International Journal of STEM Education 8 (1): 59. https://doi.org/10.1186/s40594-021-00315-x.
- Government Equalities Office. 2018a. “National LGBT Survey: Research Report.” GEO research Report. https://www.gov.uk/government/publications/national-lgbt-survey-summary-report.
- Government Equalities Office. 2018b. “National LGBT Survey: Summary Report.” Government Equalities Office Research Brief. https://assets.publishing.service.gov.uk/media/5b3cb6b6ed915d39fd5f14df/GEO-LGBT-Survey-Report.pdf.
- Hudson-Sharp, Nathan, and Hilary Metcalf. 2016. Inequality among Lesbian, Gay Bisexual and Transgender Groups in the UK: A Review of Evidence. London, England: National Institute of Economic and Social Research NIESR.
- Khanolkar, Amal R., David M. Frost, Evangeline Tabor, Victoria Redclift, Rebekah Amos, and Praveetha Patalay. 2023. “Ethnic and Sexual Identity-Related Inequalities in Adolescent Health and Well-Being in a National Population-Based Study.” LGBT Health 10 (1): 26–40. https://doi.org/10.1089/lgbt.2021.0473.
- Li, Yaojun, Fiona Devine, and Anthony Heath. 2008. Equality Group Inequalities in Education, Employment and Earnings: A Research Review and Analysis of Trends over Time. Manchester, England: Equality and Human Rights Commission.
- Marini, Giulio. 2018. “Higher Education Staff and Brexit. Is the UK Losing the Youngest and Brightest from Other EU Countries?” Tertiary Education and Management 24 (4): 409–421.
- NatCen Social Research. 2023. “British Social Attitudes Survey” [data series]. 3rd Release. UK Data Service. SN: 200006. https://doi.org/10.5255/UKDA-Series-200006.
- Office for National Statistics. 2023. “Sexual Orientation, UK: 2021 and 2022: Sexual Orientation in the UK in 2021 and 2022 by Region, Sex, Age, Legal Partnership Status, Ethnic Group and Socio-Economic Classification, Using Data from the Annual Population Survey (APS). Experimental Statistics.” https://www.ons.gov.uk/peoplepopulationandcommunity/culturalidentity/sexuality/bulletins/sexualidentityuk/2021and2022#comparing-aps-estimates-with-census-2021.
- ONS. 2022. “Maximising the Quality of Census 2021 Population Estimates.” Office for National Statistics. https://www.ons.gov.uk/peoplepopulationandcommunity/populationandmigration/populationestimates/methodologies/maximisingthequalityofcensus2021populationestimates.
- Serrano Amaya, José Fernando, and Oriol Rios Gonzalez. 2019. Introduction to the Special Issue: Challenges of LGBT Research in the 21st Century, 371–381. London, England: SAGE Publications.
- Waters, Mary C., Anthony Heath, Van C. Tran, and Vikki Boliver. 2013. “Second Generation Attainment and Inequality: Primary and Secondary Effects on Educational Outcomes in Britain and the United States.” In The Children of Immigrants at School, edited by R. Alba and J. Holdaway, 120–159. New York: New York University Press.
Appendix A.
Reweighted proportions to account for missing data
Given the large proportion of staff records where data on sexuality is missing, one must consider the possibility that this has introduced a systematic bias into our estimates. To examine this we grouped our data by age, sex, cost centre, contract level and academic employment marker and computed the proportion of respondents whose sexuality was known who were LGB+ within each group. If we assume that there is no systematic bias in non-response once these factors are accounted for, one can compute a weighted mean of these proportions to compute an adjusted estimate for the proportion who are LGB+ within the population. In the event that a group was so small that we did not know the sexuality of any of the respondents within that group, that group was excluded from the computation of the weighted mean.
The resulting weighted means are shown in where they are compared with the raw proportions of respondents in each category. There is only a negligible difference between the raw proportions and the weighted means, so we conclude that missing data on the sexuality question has not been significantly biased by differences in the level of missing data in our groupings.
It is possible that there are systematic biases in levels of non-response by sexuality. One might expect that any bias caused by a reluctance to reveal one’s sexuality to be similar in both census and HESA data. Data missing for other reasons is likely to be independent of the other factors and so should not cause bias.
Table A1. Comparison of percentages in each LGB+ category when computed using raw data (top lines, upright text) and when computed using weightings to account for missing data (bottom lines, italic text).