
 ?Mathematical formulae have been encoded as MathML and are displayed in this HTML version using MathJax in order to improve their display. Uncheck the box to turn MathJax off. This feature requires Javascript. Click on a formula to zoom.
ABSTRACT
In many regions, the scenic beauty of landscapes, and a high degree of ‘naturalness’, are paramount for tourism. The focus of the paper is on empirical estimates of the benefits of nature conservation programs in regard to different degrees of naturalness in two regions in the Austrian Alps. The results of an on-site survey indicate that most respondents would accept stricter nature conservation policies including restrictions of access to ecologically sensitive areas. The respondents indicated a willingness to pay of at least EUR 1.50 per person a night for improved conservation programs. The results suggest that these tourists not only prefer policies that improve naturalness, they actually expect them. It should be noted that the preferences of tourists differ between regions, as well as socio-economic attributes. The concept of the degree of naturalness may facilitate the transfer of benefits to other regions.
1. Introduction and background
Tourism in Alpine regions is an important economic activity in Austria. The regions of Pinzgau and Salzkammergut in the Federal Provinces of Salzburg and Upper Austria, respectively, are among the most visited tourism destinations. Both areas are typical Alpine landscapes, which include forests, meadows, high alpine rocky areas, glaciers, waterfalls and lakes, and contain protected areas such as national parks, Natura 2000 sites, nature conservation areas, and natural monuments. Such diverse landscapes support all kinds of cultural ecosystem services (CES) (cf. Arriaza, Canas-Ortega, Canas-Adueno, & Ruiz-Aviles, Citation2004; Lee & Han, Citation2002; Schirpke, Timmermann, Tappeiner, & Tasser, Citation2016) and thus are paramount for ecotourism and landscape-based tourism (Hernández-Morcillo, Plieninger, & Bieling, Citation2013; Schägner, Brander, Maes, Paracchini, & Hartje, Citation2016; Smith & Ram, Citation2016).
While natural environments such as forests are relevant factors when people choose a region as a tourist destination (e.g. Tyrväinen, Buchecker, Degenhardt, & Vuletic, Citation2009), conflicts between nature conservation and tourism are evident. For instance, new cable cars, hotels, and mountain roads are subject to intense public debates in regard to the acceptability of new infrastructures in the light of an increased scarcity of untouched natural environments. The European Union (EU) Directive on Environmental Impact Assessments (2011/92/EU) prescribes the assessment of direct and indirect effects of certain infrastructure projects; among others, the effects on landscapes including visual ones, have to be ascertained.
The Austrian Federal Forests (Österreichische Bundesforste, ÖBf) own major shares of the land both in the Pinzgau and the Salzkammergut regions. In total, the ÖBf own about 15% (510,000 hectares) of all forests in Austria, and about 10% of Austrian land. Questions are frequently raised in the public debate whether the ÖBf as the Republic of Austria’s State-owned forest company should change its current management regime of multifunctional forestry. Two exclusive lines of development are debated: (1) the intensification of commercial forestry, or (2), more strict nature conservation policies. Both imply, of course, different changes of the full range of ecosystem services originating from the ecosystems on ÖBf land (cf. the CICES classification according to the European Environment Agency (EEA), Citation2017). While Getzner, Gutheil-Knopp-Kirchwald, Kreimer, Kirchmeir, and Huber (Citation2017) discussed implications of changes in the management for the protective function of Alpine forests, Getzner, Meyerhoff, and Schläpfer (Citation2018a) estimated the additional non-use values (e.g. existence value of increased biodiversity) of nature conservation policies on ÖBf land. This paper explores the perception of landscapes by tourists visiting the two tourism regions mentioned above in regard to changes of the naturalness of the landscapes caused by different management strategies. The research questions of this paper are:
How important are natural landscapes for destination choice?
Which degree of naturalness do tourists attribute to landscapes?
Is there a willingness-to-pay for nature conservation policies?
Would tourists accept spatial or temporal restrictions of access?
This paper explores these questions via the results of an on-site survey of tourists in the Pinzgau and Salzkammergut regions. It reveals new empirical evidence on the perception and acceptance of tourists in regard to nature conservation, and it is the first to link a direct elicitation of willingness-to-pay in these regions with a quantifiable degree of naturalness based on ecological models. The results are relevant since changes of the landscape are in the first place perceived as visual changes. Many public agencies have implemented similar procedures to assess such changes (e.g. NCHRP, Citation2013). This paper therefore adds to the literature on the valuation of landscapes and provides an approach which may be transferred to other regional contexts by taking the values elicited at the study site and transfering these to a policy site (see Johnston, Rolfe, Rosenberger, & Brouwer, Citation2015).
The structure of the paper is as follows: The method of the empirical survey is presented in Section 2. Descriptive and econometric results are discussed in Section 3, while in Section 4, the results are summarised and conclusions are drawn.
2. Methods
2.1 Environmental valuation approaches, visualisation and naturalness
Methodologically, two main groups of valuation methods can in principle be distinguished for valuing changes of landscapes and forest ecosystems in regard to CES such as recreation and existence values (Riera et al., Citation2012). On the one hand, travel cost and destination choice models include the valuation of the status quo as well as hypothetical scenarios by means of contingent behaviour. Such indirect valuation approaches ascertain revealed preferences and regularly use verbal as well as visual representations of scenarios (environmental programmes), for instance, by presenting photos of the landscape that have been altered in order to visually describe the changes of the landscape (Barroso, Pinto-Correia, Ramos, Surová, & Menezes, Citation2012; Dramstad, Tveit, Fjellstad, & Fry, Citation2006).
On the other hand, there are studies that also include direct valuation methods eliciting stated preferences, such as contingent valuation and choice experiments, for valuing landscape changes (e.g. Barrio & Loureiro, Citation2010; Bartkowski, Lienhoop, & Hansjürgens, Citation2015; Dupras, Laurent-Lucchetti, Revéret, & DaSilva, Citation2018). Numerous papers deal with the direct valuation of biodiversity in forests and natural landscapes (Bartkowski et al., Citation2015; Czajkowski, Buszko-Briggs, & Hanley, Citation2009; Soliva & Hunziker, Citation2009; Tagliafierro, Longo, Van Eetvelde, Antrop, & Hutchinson, Citation2013). Many scholars have concluded that preferences for conservation are stronger for environments and landscapes with a higher degree of naturalness (for Alpine landscapes, e.g. Lindemann-Matthies, Briegel, Schüpbach, & Junge, Citation2010). van Zanten, Verburg, Koetse, and van Beukering (Citation2014) found similar results in their meta-analysis of case studies dealing with values for different European landscapes.
However, the environmental evaluation that ought to be useful for planning and management decisions rests on a careful draft of (management) scenarios, an understandable and plausible presentation, and a level of information that is both accurate and also comprehensible for respondents (Johansson, Citation1993; Johnston et al., Citation2017; Markussen et al., Citation2003). In addition, problems such as double counting or additionality of values have to be accounted for in the design of environmental valuation instruments (Whitehouse, Citation2017). In this paper, there are two core methodological elements of the empirical on-site survey.
First, the visual presentation of management scenarios, as well as the change of the degree of naturalness, was based on ecological and GIS modelling, and photo manipulation of the forests, high-alpine meadows and rocky areas. Grêt-Regamey, Bishop, and Bebi (Citation2007) chose a similar approach (see also Campbell, Citation2007; Fry, Tveit, Ode, & Velarde, Citation2009; Getzner & Svajda, Citation2015; Ode, Fry, Tveit, Messager, & Miller, Citation2009). Tahvanainen, Tyrväinen, Ihalainen, Vuorela, and Kolehmainen (Citation2001) used visual and verbal information to assess scenic beauty, as well as the recreational benefits of forests. They recommend using photos to describe the effects of different forest management practices (see also Bell, Citation2001).
Many studies also use drawings or depictions (renderings) to elicit the preferences and willingness-to-pay of the respondents. For instance, Filyushkina, Agimass, Lundhede, Strange, and Jacobsen (Citation2017) study the preferences for different types of forest stands and conclude that respondents prefer diverse combined stands with mixed tree species and varying heights. Nakamae, Qin, and Tadamur (Citation2001) discuss different techniques of visualisation and conclude that—while there is no general recommendation with regard to the use of certain images or pictures—panoramic images might give respondents a fairly lifelike impression (Nakamae et al., Citation2001, p. 31). It is important to consider the scale when mapping the respective ecosystem services that are to be valued (Grêt-Regamey et al., Citation2014; Zoderer, Tasser, Erb, Lupo Stanghellini, & Tappeiner, Citation2016). Studies have shown that respondents perceive naturalness and cultural ecosystem services rather at the habitat or landscape level (King et al., Citation2017).
Second, in order to draft potential landscape developments and the changes of the degree of naturalness, the approach includes information at the level of single forest stands; and computes an index value (degree) of naturalness for a whole landscape shown in the photo used to describe the status quo and the scenarios.
The starting point is an assessment of the degree of naturalness of the status quo. As described in Getzner, Huber, Jäger, Kirchmeir, and Wuttej (Citation2018b), the current state of the environment at the location of the landscape scenery as depicted in the photo can be valued by 2.5 on a 5-point Likert scale (with 5 = landscapes and environments in a natural state, and 1 = artificial environments with heavy human influence). This scale corresponds to the degree of naturalness of the ecosystems and is, among other things, based on the concept of hemeroby. Hemeroby is a concept of ecological sciences and measures the human influence on a natural environment by a wide range of indicators (e.g. Grabherr, Koch, Kirchmeir, & Reiter, Citation1998; McRoberts, Winter, Chirici, & LaPoint, Citation2012; Winter, Citation2012). Frank, Fürst, Koschke, Witt, and Makeschin (Citation2013) also base their landscape metrics on the hemeroby concept and conclude that photos are very useful for explaining what the differences are in the perception of each respondent. Schirpke, Meisch, Marsoner, and Tappeiner (Citation2018) use this concept to assess the role of landscapes for outdoor recreation. A higher degree of naturalness, however, does not necessarily lead to higher biodiversity. While the degree of naturalness also includes biodiversity indicators, high biodiversity in Alpine meadows might be reduced by natural succession. Naturalness according to this concept therefore describes the intensity of human influence and intervention into the ecosystem.
2.2 Management scenarios and the empirical on-site survey
In order to answer the research questions outlined in Section 1, the questionnaire of the on-site survey the Pinzgau and Salzkammergut regions included a total of 33 questions (both open-ended and closed questions, some of which included Likert scales). Pre-testing took place in the form of focus groups and the involvement of social scientists reviewing drafts of the questionnaire. Some questions were also adapted from prior research projects (e.g. Bednar-Friedl, Gebetsroither, & Getzner, Citation2009; Getzner & Svajda, Citation2015).
Eight interviewers carried out the survey in the two regions in July 2018. In all, 1,432 questionnaire were collected (806, i.e. 56.3%, in Pinzgau; 626, i.e. 43.7%, in Salzkammergut). As many tourists are foreigners, the questionnaire was printed in several languages (German, English, Dutch, Danish, Chinese, and Arabic). Potential respondents were randomly selected and approached in person in restaurants, cable cars, parking lots, cafés and hotels. These spots were defined based on assessments of the local tourism associations and personal experience of the researchers. The respondents filled in the questionnaires that were handed to them by the survey team. 65% of the tourists that were contacted in this way were willing to answer the questions and were handed the questionnaire, of which 99.5% were returned. It took the respondents about 10 to 15 minutes to fill in the questionnaire. The interviewers also recorded the location of the interview, weather conditions and any other issues that occurred.
The questionnaire opened with a range of questions in regard to general personal information, motivation and activities of the respondents, and also asked them to estimate travel distances, other data describing their stay (e.g. family/group size, length of stay), and spending during their stay. In addition, the respondents were asked if they were satisfied with their holiday or not. They were also asked to state the perceived degree of naturalness of the region.
To elicit the preferences of the respondents in regard to changes in the landscape either in terms of more tourism infrastructure or intensified nature conservation policies, the survey included a verbal and visual presentation of both the status quo as well as three potential ways of development (scenarios). presents the environmental programmes that would change the appearance of the landscape, as well as the possibilities to enjoy a range of activities during the (summer) vacations. In order to present respondents with the status quo in addition to possible landscape development scenarios, the description and photos have assumed a scale of the surrounding area at one of the hotspots of tourism in the Pinzgau region. The photo that was displayed and subsequently altered () shows the Schmitten Mountain Area that surrounds the tourism town of Zell am See, and the Zeller Lake in the foreground (the photo was taken from the East looking to the West). In order to avoid any distortion owing to the use of different pictures, the surveys in both regions use the same photo without giving information on the exact location of the landscape.
Figure 1. Presentation and description of scenarios 1, 2 and 3 in the survey.
Source: Own concept, 2018.
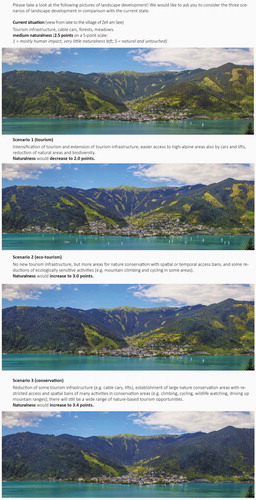
The three scenarios were modelled according to potential changes both in tourism infrastructure as well as ecological management. The scenarios accentuate the diverse trade-offs between the provision of different ecosystem services (e.g. Blattert, Lemm, Thees, Lexer, & Hanewinkel, Citation2017; Briner et al., Citation2013; Cord et al., Citation2017).
Scenario 1 (tourism) was depicted as a scenario that would significantly improve tourism infrastructure, such as high-alpine roads and cable cars. The manipulated photo included new roads, swaths in forests for new lifts, and more hotels near the village. In addition, some potential crowding was displayed by an increase in the number of sailing boats on the lake. The degree of naturalness would decrease to 2.0.
Scenario 2 (ecotourism) waived additional tourism infrastructure and included a modest increase of ecological management leading to an enlargement of protected areas. Mostly, this scenario would not hinder tourism but there might be some spatial or temporal restrictions of access to ecologically sensitive areas. The altered photo reduced some meadows and open spaces transformed into forests. According to the ecological assessment of these policies (see Getzner et al., Citation2018b), the degree of naturalness would improve to 3.0.
Scenario 3 (nature conservation) would place an emphasis on nature conservation at the cost of reducing tourism infrastructure and significantly extending protected areas such as core zones of national parks and the reduction of some locally problematic outdoor activitiesFootnote1. The degree of naturalness would increase to 3.4.
To express willingness-to-pay (WTP) the usual means of payment include admission fees (e.g. to national parks) or additional tourism taxes, such as local fees levied for each overnight stay. Currently, municipalities in the two regions levy an average tourism tax of EUR 1.5 per person a night. To elicit the willingness-to-pay of tourists in the two Austrian regions, the respondents were asked whether or not they would accept an increase of the tourism tax in order to finance the nature conservation programs as depicted in the scenarios. WTP bids were elicited by means of a payment card with amounts ranging from EUR 0.10 to EUR 10 (with an option to insert another WTP amount).
3. Descriptive and econometric results
3.1 Descriptive survey results
Similar to other studies (e.g. Tyrväinen et al., Citation2009), the most important motive to visit one of the two regions (Pinzgau and Salzkammergut) are the natural environments, landscapes and nature conservation areas. Over 80% of the respondents chose these destinations based on this motive, followed by the quiet and relaxed atmosphere, and the infrastructure for tourism.
Most tourists (48% of the respondents) visited the regions for the first time; the mean frequency of visits was 2.69 (std. dev. 2.65, median 2 visits). 62% of the respondents stayed overnight (the length of stay was, on average, 6.5 days, the median amounted to 5 days). 21% of the respondents came from Austria, 23% from Germany, 29% from other EU-countries, and the rest from non-EU countries. Most of the respondents came with their family; the average family (group) size was 3.6 persons.
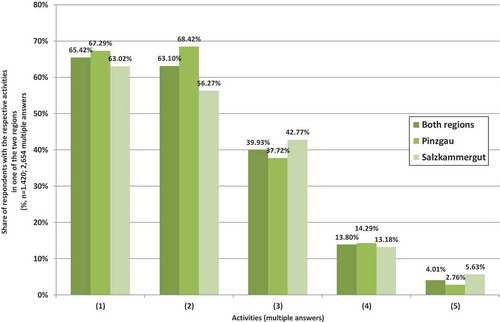
Corresponding to the main motives to visit these regions, the main activities of the respondents were activities in natural environments (e.g. hiking) and enjoying the landscape (e.g. trips on mountain roads, cable cars) (). Corresponding to our finding, the study by Hahn, Heinrup, and Lindborg (Citation2018) also indicates that different user groups prefer various landscapes according to their activities.
Figure 2. Main activities during the summer vacations (multiple answers, % of respondents).
(1) Enjoying the landscape (e.g. vista points, trips on mountain routes, cable cars).(2) Walks and hikes in natural environments (e.g. forests, alpine meadows, high-alpine landscapes).(3) Visits to natural monuments (e.g. waterfalls, gorges, lakes, glaciers).(4) Sports (e.g. mountain biking, jogging, climbing, paragliding, swimming, boating).(5) Other activities.Source: Own survey and calculations, 2018.
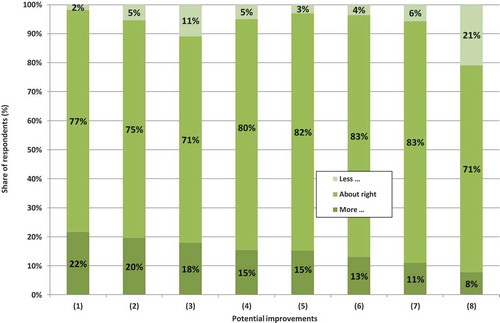
In general, the tourists were very satisfied with their vacations in the two regions. On a 5-point Likert scale (with 1 = very satisfied, 5 = completely unsatisfied), respondents stated a mean value of satisfaction of 1.61 (std. dev. 1.065, median 1.00). This high level of satisfaction, however, has to be differentiated according to the diverse ingredients of satisfying vacations. shows which dimensions respondents would like to change. While around 75% to 83% of the respondents were happy with the degree of naturalness or the provision of hiking trails, around one fifth of the respondents would like to see a higher degree of naturalness, and would like to receive more information on the region. Furthermore, crowding was also an issue for about one fifth of the respondents. They stated that other families and tourists would annoy them.
Figure 3. Potentials for improvements and change to enhance the experience of visitors in the two regions.
(1) Degree of naturalness.(2) Supply of information.(3) Entertainment opportunities.(4) (Public) Transport connections.(5) Hiking trails.(6) Restaurants and high-mountain huts.(7) Sports facilities.(8) Families and other tourists.Source: Own survey and calculations, 2018.
In regard to the perception of the naturalness of the landscapes in the two regions, shows that the respondents assessed naturalness rather high. The mean degree of naturalness was 3.61 on the above-mentioned 5-point Likert scale. This description of naturalness matched the one used for describing the three potential scenarios of development of the landscape. It is, though, interesting to consider the ecological assessment of the study by Getzner et al. (Citation2018b) who assess the landscape (as shown in the photo describing the status quo) with a degree of naturalness of 2.5 based on ecological data and a GIS model.
Table 1. Perceived degree of naturalnessa depending on regions and residence of respondents.
Conforming to ecological assessments, the respondents stated a higher degree of naturalness in the Salzkammergut region than in the Pinzgau. Furthermore, the German and Austrian tourists are more close to the factual ecological assessment than tourists from other EU or non-EU countries. In particular, tourists from Arab countries and from China overestimate naturalness in the two regions. Scholte, van Teeffelen, and Verburg (Citation2015) stress the importance of socio-cultural perspectives with respect to the valuation of ecosystem services. Aasetre, Gundersen, Vistad, and Holtrop (Citation2016) conclude in their study that tourists surveyed in two regions may also choose their destination on the basis of different degrees of naturalness. Thus, a certain self-selection bias may overlay respondents’ assessments.
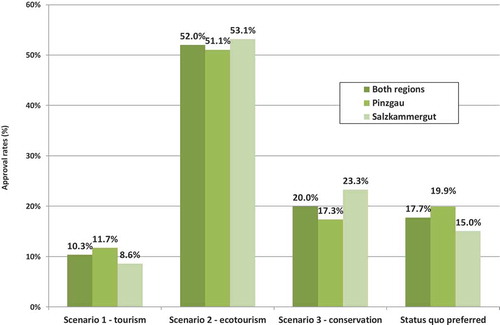
After stating their perceived degree of naturalness, the respondents indicated their preferences for one of the scenarios described in Section 2. shows that scenario 1 which would increase tourism in the region drew the least support from the respondents. On average, the respondents would prefer the status quo to scenario 1. Scenario 2 (eco-tourism) earned a significant majority of 52% of the respondents, while 20% of the respondents preferred scenario 3 (nature conservation). In regard to the differences between the scenarios, the respondents that were surveyed in the Salzkammergut region preferred the third scenario much more than the respondents in the Pinzgau region. These results indicate that there are strong preferences for an improvement in the natural environments in both regions.
Figure 4. Preferences of scenarios 1, 2 and 3, and the status quo (% of respondents).
Source: Own survey and calculations, 2018.
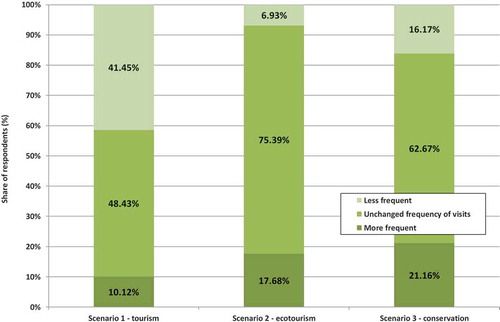
Respondents also stated whether they would change their frequency of visits to the area. The results displayed in imply that a further intensification of tourism (scenario 1) would significantly reduce the frequency of visits to the regions. About 18% of the respondents stated that they would increase their frequency of visits for scenario 2. More than a fifth of the respondents would travel more often to the region in the case of scenario 3. However, some respondents were also aware that the realisation of scenario 3 could reduce some of their preferred activities, since more strict nature conservation policies would be in place. 16% of the respondents stated that they would reduce the frequency of their trips to the regions in scenario 3. In conformity with other recent papers (e.g. Getzner & Svajda, Citation2015), the results also show that many tourists would not change their choice of destination with more or less conservation policies.
Figure 5. Change in the frequency of visits if one of the scenarios were to be realised.
Source: Own survey and calculations, 2018.
3.2 Econometric survey results: determinants of willingness-to-pay
In order to estimate the welfare effects of the scenarios that improve naturalness, the survey included the willingness-to-pay (WTP) question for scenarios 2 (ecotourism) and 3 (nature conservation). As described above, a closed-ended question elicited the willingness-to-pay of respondents by means of a payment card. The chosen payment vehicle consisted of a mark-up on the tourism tax already levied. Of course, the respondents could also choose not to pay, and give their reasons in a separate question.
A large majority of the respondents were actually willing to contribute to one of the programs (scenarios); about 70% of the respondents were willing to pay for scenario 2 while about 61% of respondents would also be willing to fund scenario 3 (see ). The fundamental willingness-to-pay of the respondents was equal between the two regions. However, the willingness-to-pay of the respondents from non-EU countries was below-average (see below, , regarding the determinants of WTP in the econometric estimations).
Table 2. Willingness to pay for one of the scenarios (%).
The mean value of the willingness-to-pay amounted to EUR 1.75 per person a night for the realisation of scenario 2 (EUR 1.49 including zero bids) while WTP was EUR 1.93 per person a night for scenario 3 (EUR 1.55 including zero bids) (). Considering the average length of vacations in these two regions of about 6.5 nights, and a mean size of a family (or group) of 3.6 persons, the respondents showed a willingness-to-pay from EUR 35 (scenario 2) to EUR 37 (scenario 3) for the whole family, and over the entire vacation. In general, the willingness-to-pay of the respondents was at the lower level of comparable forest and landscape evaluation studies (see Barrio & Loureiro, Citation2010, p. 1025). The willingness-to-pay for the two scenarios was not the same in these two regions. While the respondents in the Pinzgau region stated a WTP for scenario 2 of EUR 1.60 (EUR 1.80 for scenario 3), the respondents in the Salzkammergut area were willing to pay between EUR 1.96 (scenario 2) and EUR 2.09 (scenario 3). Interestingly, the Austrian respondents showed a rather high WTP of EUR 2.0 (the same sum for both scenarios) while the willingness-to-pay of the respondents from other countries was lower (). However, the mean value of the WTP was higher for scenario 3 than for scenario 2.
Table 3. Willingness-to-pay for scenarios depending on the location (region) of the survey.
Table 4. Willingness-to-pay for scenarios depending on the residence of respondents.
In order to further explore the differences and determinants of the willingness-to-pay of the respondents, a statistical-econometric model was set up to search for an estimation that would account for the socio-economic characteristics of the respondents, for variables specific to the experiences of the respondents in the region, and general environmental preferences. Thus, the following conceptual model was empirically tested:
with WTPi denoting the respondent’s willingness-to-pay for one of the scenarios. Si is a vector of socio-economic characteristics (such as income), Vi represents the perceptions and experiences of the respondents during their vacation, and Pi are the variables on the expressed environmental preferences. In addition, the regions as well as the scenarios (2 or 3) were included in the estimation. presents the single variables used in the estimations, while presents the descriptive statistics of all dependent variables used in the model.
Table 5. Dependent and explanatory variables.
Table 6. Summary descriptive statistics of explanatory variables.
Equation (1) was empirically estimated by means of a maximum-likelihood Tobit estimation as data is likely truncated (cf. Tobin, Citation1958). The results of this estimation are shown in . The estimation represents the best-fit statistical model for the data collected with only significant, explanatory variables included.
The estimation presented in , indicates that, first of all, the willingness-to-pay was dependent on the respondent’s household income, which provides an indication of the reliability of the data collected in the survey (Johnston et al., Citation2017). The respondents who are below 40 years of age were willing to pay more for one of the two scenarios (cf., Kalivoda, Vojar, Skřivanová, & Zahradník, Citation2014). A membership in an environmental organisation also increased the willingness-to-pay bids of the respondents (cf., Lindemann-Matthies et al., Citation2010). All of the three socio-economic variables proved to be highly significant.
Table 7. Determinants of willingness to pay.
The set of Vi variables accounts, first of all, for the determinants involved in choosing a destination. The respondents who stated that their main motive for travelling to the two regions was to enjoy the natural landscapes, showed a greater willingness-to-pay. Activities are generally considered to be good predictors of the preference for landscapes (Schmidt, Walz, Martín-López, & Sachse, Citation2017). However, the respondents also thought about the total additional expenditure when stating a willingness-to-pay by taking into account the size of their family. The respondents whose family (group) was above average in size showed a smaller willingness-to-pay. The respondents who were taking part in the survey at the beginning of their vacation showed a greater WTP. Last, but not least, the respondents who considered the degree of naturalness to be excellent, also showed a greater WTP, corresponding to the literature on landscape evaluation (e.g. Molina, Rodríguez Y Silva, & Herrera, Citation2016; Tagliafierro, Boeri, Longo, & Hutchinson, Citation2016).
In regard to the environmental policy preferences (vector Pi), two additional variables showed a significant, explanatory power. The respondents who would accept spatial or temporal restrictions of access to ecologically sensitive areas (such as core zones of conservation areas) showed a greater willingness-to-pay. Finally, the respondents who stated that they would also be willing to pay, even if they were to be in a minority, exhibited an above-average WTP.
The descriptive evidence (Section 3.1) also implies that the willingness-to-pay differs between the scenarios and regions. On the one hand, the willingness-to-pay should increase with the scale of the environmental policy programme offered to the respondents. As expected, the estimation in shows that the willingness-to-pay increases with the strength of the nature conservation programme (scenario 3 conserves natural resources more strictly than scenario 2). On the other hand, the estimation also shows that the willingness-to-pay differs in the two regions. The tourists who participated in the survey in the Salzkammergut region showed a greater willingness-to-pay. Interestingly, after including the significant explanatory variables, the differences between the WTP according to the home country of the respondents (e.g. China, Arab countries) vanish. The econometric analysis indicates that the differences are significantly influenced by socio-economic characteristics (income, group size), the landscape and the policy preferences, and to a lesser extent by the origin of the respondents.
4. Discussion, summary and conclusions
Natural landscapes and scenic beauty are the major factors that determine the choice made by tourists in regard to their destination. This study reveals that tourists would be willing to pay around EUR 1.50 to EUR 1.60 per person a night by means of an additional tourism tax, to further increase naturalness and the scenic beauty of the landscape in two Austrian regions, Pinzgau and Salzkammergut. The results are in a similar range of other landscape valuation studies (e.g. Barrio & Loureiro, Citation2010, p. 1025; Molina et al., Citation2016; Tagliafierro et al., Citation2016). Compared to the already existing average tourism tax of EUR 1.50 per person, this willingness-to-pay (WTP) indicates that there are strong preferences towards nature conservation programs. In regard to the changes of the degree of naturalness, and to the number of tourists staying overnight during the summer season, a conservative aggregate estimate of annual benefits of a modest conservation program amounts to EUR 14.4 million. In addition, a significant percentage of the respondents would also accept spatial or temporal restrictions of access to conservation areas.
In regard to the acceptance of the proposed nature conservation programmes, a majority of the respondents would support the modest nature conservation scenario. It is interesting that the respondents would also prefer the strict nature conservation scenario over the status quo. While the modest scenario would stop further extensions of tourism infrastructure, and might lead to some restrictions of access to ecologically sensitive areas, the strict conservation scenario would also lead to a reduction of tourism infrastructure. A majority of the respondents, however, reject extensions of tourism infrastructure at the cost of biodiversity loss.
The socio-economic characteristics of the respondents (e.g. income, age), activities during their stay in the region, as well as individual landscape and policy preferences can explain much of the individual differences of WTP. While these results suggest that benefits of landscape conservation could be transferred to other regions, the location of the survey itself was also a major influencing factor. As theoretically expected, the willingness-to-pay increases with the scale of the nature conservation programme, but the respondents in the Salzkammergut region showed a significantly greater willingness-to-pay than in the Pinzgau region.
Based on this study, a number of general conclusions can be drawn. First of all, it is well known that on-site surveys are not as representative as a household panel survey with stratified samples owing to the self-selection bias of respondents in a certain region.Footnote2 While an on-site survey may therefore elicit the preferences of current tourists, it is, of course, not justifiable to generalise the detailed results as relevant to the whole population or to other tourist destinations. With respect to valuing landscape changes, a direct experience of the environment to be assessed is a significant advantage in terms of the accuracy of estimates. This is especially important for questions that are related to potential restrictions of access to certain ecologically sensitive areas. The degree of naturalness based on the hemeroby concept provides a sound ecological basis for transfering benefits to other regions (cf., Junge, Schüpbach, Walter, Schmid, & Lindemann-Matthies, Citation2013). If socio-economic attributes of tourists are known, WTP can be further refined to account for differences between regions. However, specific conclusions for the management of the landscape, the enhancement of naturalness, or forest policies, outside the two regions are not straightforward. While the results indicate that there is a general acceptance of more strict nature conservation policies in regions with a high scenic beauty, the transfer of exact monetary values from the two regions to others raises some concern. In addition, planning and nature conservation policies might be different between regions.
Secondly, there are many examples of conflicts between the extension of infrastructure for tourism and nature conservation (Briner et al., Citation2013). This study indicates that tourists would be willing to pay for stricter nature conservation policies that would also improve the naturalness of the environment and the aesthestic experiences in mountain landscapes (cf., Vigl, Depellegrin, Pereira, de Groot, & Tappeiner, Citation2017). Tourists, who spend their vacations in these regions, expect scenic beauty, and pursue many activities closely connected to the landscape and the natural resources. Extending tourism infrastructure further might reduce scenic beauty, and thus reduce the number of these tourists visiting the regions. However, such intensification might attract other groups of tourists seeking different types of activities, entertainment and experiences. In addition, the results of this paper are limited to the summer season. The preferences of tourists during the summer might therefore be in clear contrast to tourists in the winter season since both groups ‘use’ the landscape for different purposes.
While this study has provided a further example of modelling and visualising changes of landscapes, there is much room for further research in terms of valuing landscape attributes and elements in order to design effective nature conservation policies and to transfer benefits to other regions. The combination of virtual reality, 3D-presentations in simulation labs, and choice experiments offer new pathways for providing further evidence on the importance of landscape conservation, and the potential conflicts between the naturalness of ecosystems and tourism development.
Acknowledgments
The author thanks F. Schläpfer for comments on a draft of the questionnaire, and M. Huber, H. Kirchmeir, and M. Jäger for support in designing the altered pictures. In addition, thanks are due to the team of interviewers in the two regions, D. Aleman, M. Böhm, M. Jäger, J. Janke, L. Konlechner, V. Oberndorfer, R. Pohl, and G. Withalm. Furthermore, the author is thankful for the support of G. Plattner and colleagues at the Austrian Federal Forests (ÖBf). Financial support of this study by the ÖBf is also gratefully acknowledged. Anonymous reviewers provided many helpful suggestions for substantial improvements of the paper. All errors are, of course, the responsibility of the author.
Disclosure statement
No potential conflict of interest was reported by the author.
Additional information
Notes on contributors
Michael Getzner
Michael Getzner is Professor of Public Finance and Infrastructure Economics, and Chair of the Institute of Spatial Planning at the Vienna University of Technology (TU Wien). He holds a Ph.D. from Vienna University of Economics and Business, and a habilitation in Economics from Klagenfurt University. His main research fields are public finance, infrastructure policy, ecological economics and cultural economics.
Notes
1. Ecologically problematic outdoor activities are, for instance, disturbance of mating and breading wildlife, erosion by walking on sensitive soil, and harvesting of rare plant species. Many protected areas such as national parks restrict certain activities on these grounds, e.g. ski tours, paragliding, hiking and climbing.
2. The differences of representative household survey and on-site survey of visitors are intensively debated by scholars. For instance, González-Sepúlveda and Loomis (Citation2010) present evidence on welfare estimates differing between on-site and household surveys.
References
- Aasetre, J., Gundersen, V., Vistad, O. I., & Holtrop, E. J. (2016). Recreational preferences along a naturalness-development continuum: Results from surveys in two unequal urban forests in Europe. Journal of Outdoor Recreation and Tourism, 16, 58–68.
- Arriaza, M., Canas-Ortega, J. F., Canas-Adueno, J. A., & Ruiz-Aviles, P. (2004). Assessing the visual quality of rural landscapes. Landscape and Urban Planning, 69, 115–125.
- Barrio, M., & Loureiro, M. L. (2010). A meta-analysis of contingent valuation forest studies. Ecological Economics, 69, 1023–1030.
- Barroso, F. L., Pinto-Correia, T., Ramos, I. L., Surová, D., & Menezes, H. (2012). Dealing with landscape fuzziness in user preference studies: Photo-based questionnaires in the mediterranean context. Landscape and Urban Planning, 104, 329–342.
- Bartkowski, B., Lienhoop, N., & Hansjürgens, B. (2015). Capturing the complexity of biodiversity: A critical review of economic valuation studies of biological diversity. Ecological Economics, 113, 1–14.
- Bednar-Friedl, B., Gebetsroither, B., & Getzner, M. (2009). WTP for species conservation programs: Implications for national park management. Eco.Mont Journal of Protected Mountain Areas Research, 1(1), 9–14.
- Bell, S. (2001). Landscape pattern, perception and visualisation in the visual management of forests. Landscape and Urban Planning, 54, 201–211.
- Blattert, C., Lemm, R., Thees, O., Lexer, M. L., & Hanewinkel, M. (2017). Management of ecosystem services in mountain forests: Review of indicators and value functions for model based multi-criteria decision analysis. Ecological Indicators, 79, 391–409.
- Briner, S., Huber, R., Bebi, P., Elkin, C., Schmatz, D. R., & Grêt-Regamey, A. (2013). Trade-offs between ecosystem services in a mountain region. Ecology and Society, 18, 35.
- Campbell, D. (2007). Willingness to pay for rural landscape improvements: Combining mixed logit and random-effects models. Journal of Agricultural Economics, 58, 467–483.
- Cord, A. F., Bartkowski, B., Beckmann, M., Dittrich, A., Hermans-Neumann, K., Kaim, A., … Volk, M. (2017). Towards systematic analyses of ecosystem service trade-offs and synergies: Main concepts, methods and the road ahead. Ecosystem Services, 28, 264–272.
- Czajkowski, M., Buszko-Briggs, M., & Hanley, N. (2009). Valuing changes in forest biodiversity. Ecological Economics, 68, 2910–2917.
- Dramstad, W. E., Tveit, M. S., Fjellstad, W. J., & Fry, G. L. A. (2006). Relationships between visual landscape preferences and map-based indicators of landscape structure. Landscape and Urban Planning, 78, 465–474.
- Dupras, J., Laurent-Lucchetti, J., Revéret, J.-P., & DaSilva, L. (2018). Using contingent valuation and choice experiment to value the impacts of agri-environmental practices on landscapes aesthetics. Landscape Research, 43, 679–695.
- European Environment Agency (EEA) (2017, July 7). Common International Classification of Ecosystem Services (CICES, v. 4.3). European Environment Agency (EEA) (cices.eu, www.eea.europa.eu).
- Filyushkina, A., Agimass, F., Lundhede, T., Strange, N., & Jacobsen, J. B. (2017). Preferences for variation in forest characteristics: Does diversity between stands matter? Ecological Economics, 140, 22–29.
- Frank, S., Fürst, C., Koschke, L., Witt, A., & Makeschin, F. (2013). Assessment of landscape aesthetics – validation of a landscape metrics-based assessment by visual estimation of the scenic beauty. Ecological Indicators, 32, 222–231.
- Fry, G., Tveit, M. S., Ode, Å., & Velarde, M. D. (2009). The ecology of visual landscapes: Exploring the conceptual common ground of visual and ecological landscape indicators. Ecological Indicators, 9, 933–947.
- Getzner, M., Gutheil-Knopp-Kirchwald, G., Kreimer, E., Kirchmeir, H., & Huber, M. (2017). Gravitational natural hazards: Valuing the protective function of alpine forests. Forest Policy and Economics, 80, 150–159.
- Getzner, M., Huber, M., Jäger, M., Kirchmeir, H., & Wuttej, D. (2018b). Bewertung der Ökosystemleistungen der Österreichischen Bundesforste (ÖBf): „Werte der Natur“ – Holz, Tourismus, erneuerbare energien, Ruhe, Kohlenstoffspeicherung. Research report of the Vienna University of Technology and E.C.O. Institute of Ecology (Klagenfurt) to the Austrian Federal Forests.
- Getzner, M., Meyerhoff, J., & Schläpfer, F. (2018a). Acceptance of and willingness-to-pay for nature conservation policies in state-owned forests. Forests, 9, 537.
- Getzner, M., & Svajda, J. (2015). Preferences of tourists with regard to changes in the landscape of the tatra national park in Slovakia. Land Use Policy, 48, 107–119.
- González-Sepúlveda, J. M., & Loomis, J. B. (2010). Do CVM welfare estimates suffer from on-site sampling bias? A comparison of on-site and household visitor surveys. Agricultural and Resource Economics Review, 39, 561–570.
- Grabherr, G., Koch, G., Kirchmeir, H., & Reiter, K. (1998). Hemerobie österreichischer Waldökosysteme [Hemeroby of Austrian forest ecosystems] (Vol. 17). Innsbruck: Publications of the Austrian MaB program, MaB.
- Grêt-Regamey, A., Bishop, I. D., & Bebi, P. (2007). Predicting the scenic beauty value of mapped landscape changes in a mountainous region through the use of GIS. Environment and Planning B: Planning and Design, 34, 50–67.
- Grêt-Regamey, A., Weibel, B., Bagstad, K. J., Ferrari, M., Geneletti, D., Klug, H., … Tappeiner, U. (2014). On the effects of scale for ecosystem services mapping. PloS One, 9(12), e112601.
- Hahn, T., Heinrup, M., & Lindborg, R. (2018). Landscape heterogeneity correlates with recreational values: A case study from Swedish agricultural landscapes and implications for policy. Landscape Research, 43, 696–707.
- Hernández-Morcillo, M., Plieninger, T., & Bieling, C. (2013). An empirical review of cultural ecosystem service indicators. Ecological Indicators, 29, 434–444.
- Johansson, P.-O. (1993). Cost-Benefit Analysis of Environmental Change. Cambridge (UK): Cambridge University Press.
- Johnston, R. J., Boyle, K. J., Adamowicz, W., Bennett, J., Brouwer, R., Cameron, T. A., … Vossler, C. A. (2017). Contemporary guidance for stated preference studies. Journal of the Association of Environmental and Resource Economists, 4, 319–405.
- Johnston, R. J., Rolfe, J., Rosenberger, R. S., & Brouwer, R. (2015). Benefit transfer of environmental and resource values: A guide for researchers and practitioners. Dordrecht: Springer.
- Junge, X., Schüpbach, B., Walter, T., Schmid, B., & Lindemann-Matthies, P. (2013). Aesthetic quality of agricultural landscape elements in different seasonal stages in Switzerland. Landscape and Urban Planning, 133, 67–77.
- Kalivoda, O., Vojar, J., Skřivanová, Z., & Zahradník, D. (2014). Consensus in landscape preference judgments: The effects of landscape visual aesthetic quality and respondents’ characteristics. Journal of Environmental Management, 137, 36–44.
- King, H. P., Morris, J., Graves, A., Bradbury, R. B., McGinlay, J., & Bullock, J. M. (2017). Biodiversity and cultural ecosystem benefits in lowland landscapes in southern England. Journal of Environmental Psychology, 53, 185–197.
- Lee, C. K., & Han, S. Y. (2002). Estimating the use and preservation values of national parks’ tourism resources using a contingent valuation method. Tourism Management, 23, 531–540.
- Lindemann-Matthies, L., Briegel, R., Schüpbach, B., & Junge, X. (2010). Aesthetic preference for a Swiss alpine landscape: The impact of different agricultural land-use with different biodiversity. Landscape and Urban Planning, 98, 99–109.
- Markussen, M., Buse, R., Garrelts, M., Manez Costa, M., Menzel, S., & Marggraf, R. (2003). Valuation and conservation of biodiversity. Berlin, New York: Springer.
- McRoberts, R. E., Winter, S., Chirici, G., & LaPoint, E. (2012). Assessing forest naturalness. Forest Science, 58, 294–309.
- Molina, J. R., Rodríguez Y Silva, F., & Herrera, M. (2016). Integrating economic landscape valuation into mediterranean territorial planning. Environmental Science & Policy, 56, 120–128.
- Nakamae, E., Qin, X., & Tadamur, K. (2001). Rendering of landscapes for environmental assessment. Landscape and Urban Planning, 54, 19–32.
- NCHRP. (2013). Evaluation of methodologies for visual impact assessments, NCHRP Report 741, Washington (D.C.): National Cooperative Highway Research Program.
- Ode, Å., Fry, G., Tveit, M. S., Messager, P., & Miller, D. (2009). Indicators of perceived naturalness as drivers of landscape preference. Journal of Environmental Management, 90, 375–383.
- Riera, R., Signorello, G., Thiene, M., Mahieu, P.-A., Navrud, S., Kaval, P., … Dragoi, S. (2012). Non-market valuation of forest goods and services: Good practice guidelines. Journal of Forest Economics, 18, 259–270.
- Schägner, J. P., Brander, L., Maes, J., Paracchini, M. L., & Hartje, V. (2016). Mapping recreational visits and values of European national parks by combining statistical modelling and unit value transfer. Journal for Nature Conservation, 31, 71–84.
- Schirpke, U., Meisch, C., Marsoner, T., & Tappeiner, U. (2018). Revealing spatial and temporal patterns of outdoor recreation in the European Alps and their surroundings. Ecosystem Services, 31, 336–350.
- Schirpke, U., Timmermann, F., Tappeiner, U., & Tasser, E. (2016). Cultural ecosystem services of mountain regions: Modelling the aesthetic value. Ecological Indicators, 69, 78–90.
- Schmidt, K., Walz, A., Martín-López, B., & Sachse, R. (2017). Testing socio-cultural valuation methods of ecosystem services to explain land use preferences. Ecosystem Services, 26, 270–288.
- Scholte, S. S. K., van Teeffelen, A. J. A., & Verburg, P. H. (2015). Integrating socio-cultural perspectives into ecosystem service valuation: A review of concepts and methods. Ecological Economics, 114, 67–78.
- Smith, M., & Ram, Y. (2016). Tourism, landscapes and cultural ecosystem services: A new research tool. Tourism Recreation Research, 42, 113–119.
- Soliva, R., & Hunziker, M. (2009). How do biodiversity and conservation values relate to landscape preferences? A case study from the Swiss Alps. Biodiversity Conservation, 18, 2483–2507.
- Tagliafierro, C., Boeri, M., Longo, A., & Hutchinson, W. G. (2016). Stated preference methods and landscape ecology indicators: An example of transdisciplinarity in landscape economic valuation. Ecological Economics, 127, 11–22.
- Tagliafierro, C., Longo, A., Van Eetvelde, V., Antrop, M., & Hutchinson, W. G. (2013). Landscape economic valuation by integrating landscape ecology into landscape economics. Environmental Science & Policy, 32, 26–36.
- Tahvanainen, L., Tyrväinen, L., Ihalainen, M., Vuorela, N., & Kolehmainen, O. (2001). Forest management and public perceptions - visual versus verbal information. Landscape and Urban Planning, 53, 53–70.
- Tobin, J. (1958). Estimation of relationships for limited dependent variables. Econometrica, 26, 24–36.
- Tyrväinen, L., Buchecker, M., Degenhardt, B., & Vuletic, D. (2009). Evaluating the economic and social benefits of forest recreation and nature tourism. In S. Bell, M. Simpson, L. Tyrväinen, T. Sievänen, & U. Pröbstl (Eds.), European forest recreation and tourism: A handbook (pp. 35–63). London: Taylor and Francis.
- van Zanten, B. T., Verburg, P. H., Koetse, M. J., & van Beukering, P. J. H. (2014). Preferences for European agrarian landscapes: A meta-analysis of case studies. Landscape and Urban Planning, 132, 89–101.
- Vigl, L. E., Depellegrin, D., Pereira, P., de Groot, R., & Tappeiner, U. (2017). Mapping the ecosystem service delivery chain: Capacity, flow, and demand pertaining to aesthetic experiences in mountain landscapes. Science of the Total Environment, 574, 422–436.
- Whitehouse, A. (2017). Common economic oversights in green infrastructure valuation. Landscape Research, 42, 230–234.
- Winter, S. (2012). Forest naturalness assessment as a component of biodiversity monitoring and conservation management. Forestry, 85, 291–304.
- Zoderer, B. M., Tasser, E., Erb, K.-H., Lupo Stanghellini, P. S., & Tappeiner, U. (2016). Identifying and mapping the tourists’ perception of cultural ecosystem services: A case study from an alpine region. Land Use Policy, 56, 251–261.