
 ?Mathematical formulae have been encoded as MathML and are displayed in this HTML version using MathJax in order to improve their display. Uncheck the box to turn MathJax off. This feature requires Javascript. Click on a formula to zoom.
ABSTRACT
Protecting tranquil areas is becoming an important objective for landscape planning and management. In order to identify where people experience tranquillity, we developed a hybrid approach combining field-based interviews with an analysis of social media content in the form of photographs with associated tags and coordinates from the photo-sharing website Flickr. In a case study in the Loch Lomond and Trossachs National Park in Scotland, interviewed respondents reported high tranquillity ratings even when relatively close to roads and traffic noise. Mapping the distribution of Flickr photographs revealed that many people took photographs and tagged them with words related to tranquillity in easily accessible areas, often close to water bodies. Our results indicate that people find tranquillity in certain landscapes despite the presence of other people or traffic noise, which highlights the importance of taking into account tranquillity ‘as experienced’ for the purposes of planning and policy-making.
1. Introduction
Many people seek tranquillity in natural landscapes as a contrast to their busy life, but what does the term tranquillity mean? In the Oxford English dictionary, tranquillity is defined as ‘The quality or state of being tranquil; freedom from disturbance or agitation; serenity, calmness; quietness, peacefulness’. Based on this definition, tranquillity can be conceptualised as a landscape quality, and this notion is emphasised in place promotion for tourism. Visitors to Scotland, for instance, are enticed to enjoy the ‘peace and tranquillity of sandy beaches, country parks and outstanding nature reserves’ (Visit Scotland, Citation2019). Visiting tranquil landscapes has been shown to provide restoration and to be generally beneficial for human health (Kaplan, Citation2001; Velarde et al., Citation2007; Watts et al., Citation2013). In the context of an increasingly urbanised population, protecting tranquil areas has become an important policy objective. At the European level, the Environmental Noise Directive (END) states the importance of protecting quiet areas (EEA, Citation2016b). And at the national level, for instance in England, the identification and protection of tranquil areas is included in the National Planning Policy Framework (Ministry of Housing Communities and Local Government, Citation2018, p. 180). With the strategic aim of identifying and protecting areas of tranquillity, the need arises to specify what factors influence the experience of tranquillity, and to map where people find tranquillity. This information can then form an integral part of evidence-based landscape planning and decision-making.
Broadly the goals of this study were to explore how people describe what they experience as tranquil and to map where people experienced tranquillity. We take as an example the case of Loch Lomond and The Trossachs National Park (LLTNP) in Scotland, which is a popular recreation area that has included protecting and enhancing areas of tranquillity as a strategic goal. Specifically, the park identified the need for a tranquillity map that took into account people’s experience in order to plan and manage recreational amenities (pers. comm. S. Melville, Landscape Officer LLTNP)—something the park management did not have.
In the following sections, we provide an overview of the literature, and identify the need for research about where people actually experience tranquillity. We then introduce a methodology that combines visitor interviews with analysis of social media data. In doing so, we aim to evaluate the potential of this novel source of data to explore place-based experiences of tranquillity in a cost-efficient way across potentially large areas. We present our results about where people found tranquillity in our study area, before discussing the merits and challenges of this new approach.
1.1. Context and motivation
Tranquillity has been investigated in different fields, including environmental psychology, acoustics, the social sciences, and Geographic Information Science. In the following, we review existing work in these different areas.
In environmental psychology, attention restoration theory (Kaplan & Kaplan, Citation1989) states that natural environments offer escape from our everyday stressful life. When we have to direct our attention, (for instance when we cross a street or drive a car), this fatigues our attentional capacity. We can find relaxation in natural environments, for example, watching a breeze rustle the leaves of a tree. These environments help to restore our attentional capacity, because they are able to hold our attention effortlessly, a concept Kaplan and Kaplan (Citation1989) term ‘soft fascination’. Characteristics of natural environments that provide restoration further include the ability to instil a feeling of being away, and to fascinate or create awe (Kaplan & Kaplan, Citation1989). Based on attention restoration theory, Herzog and Bosley (Citation1992) conducted image rating experiments in which subjects had to identify landscape images they had a preference for. These were compared with images the subjects deemed tranquil in order to explore any correlation between preferred and tranquil images. For different landscape settings, the ratings for preference and tranquillity correlated highly, but in certain settings, tranquillity was rated higher than preference, for instance in scenes depicting large water bodies (Herzog & Bosley, Citation1992). A subsequent study showed that tranquillity was rated significantly higher in natural settings than in urban ones, and that the amount of foliage in natural areas was positively correlated with tranquillity ratings (Herzog & Chernick, Citation2000). Potentially, tranquillity can thus be a quality of any landscape, whether urban or rural.
Early research on tranquillity focused on the visual aspects of landscapes. Various researchers have since explored the connections between anthropogenic and natural soundscapes and tranquillity, for instance by exposing subjects to combinations of imagery and soundscape to test their correlation with tranquillity (Pheasant et al., Citation2008). Experiments in sound chambers with video input revealed that tranquillity ratings can be predicted based on a model that includes the measured naturalness of a scene and sound pressure levels (Pheasant et al., Citation2009). This model revealed that increasing naturalness of the scene depicted in the video resulted in higher tranquillity ratings, and that anthropogenic noise decreased ratings. The model was subsequently refined and used as a predictive tool examining its utility in urban green spaces (Watts et al., Citation2013), in the context of wind farms (Watts & Pheasant, Citation2015a) and more broadly in rural contexts (Watts & Pheasant, Citation2015b).
The importance attributed to noise and naturalness of an area is also reflected in the European-wide Quietness Suitability Index, or QSI (EEA, Citation2016b). The QSI is premised on two ideas: that anthropogenic noise directly distracts from quietness and secondly that land cover and population density indirectly affect the way people perceive noise. For various anthropogenic sources, the QSI combines different noise surfaces on the assumption that sound decays over distance. Utilising existing noise models combined with land use data, the index shows areas that are potentially quiet (EEA, Citation2016b). The QSI map published in 2016 covers all of Europe, but some countries have a longer tradition in mapping tranquillity.
In England, Simon Rendel and ASH consulting produced what can be considered the first tranquillity map for the Department of Transport in 1991. This map showed that a proposed transport corridor in Central England affected significant tracts of undesignated land that was vulnerable to development, which brought to the fore the merits of mapping tranquillity for policy-making and planning (Rendel, Citation1998). The Campaign to Protect Rural England (CPRE) has been active in drawing attention to the protection of tranquil areas since the 1990s, with tranquillity mapping as an important method (CPRE and the Countryside Commission, Citation1995; Jackson et al., Citation2008; MacFarlane et al., Citation2004). The CPRE defines tranquil areas as: ‘places which are sufficiently far away from the visual or noise intrusion of development or traffic to be considered unspoilt by urban influences’ (MacFarlane et al., Citation2004). In the CPRE tranquillity map for England, tranquillity was modelled in terms of distance thresholds to disturbances such as roads, railways, power stations, and large towns (CPRE and the Countryside Commission, Citation1995). On behalf of CPRE, Levett (Citation2000) produced a report detailing limitations of the first CPRE tranquillity map, including fixed distance thresholds from noise sources, and experts defining all criteria and thresholds. While these early tranquillity maps were helpful in identifying areas relatively undisturbed by noise and infrastructure, they portray an expert-based view of tranquillity, which does not necessarily reflect realities on the ground. A subsequent mapping project sought to address these criticisms and in particular, to include the views of the public (MacFarlane et al., Citation2004). In the Northumberland National Park and West Durham Coalfield in England, the public was involved in defining the criteria that impacted tranquillity through a consultation phase. However, most answers from the public were deemed incompatible with the requirements for a Geographic Information System (GIS). The researchers operationalised factors for the GIS themselves, but conducted another public consultation to define the scores for weighting the different GIS layers (MacFarlane et al., Citation2004). A follow-up study developed this approach further and produced a tranquillity map for all of England (CPRE, Citation2007; Jackson et al., Citation2008). For this tranquillity map, over 1000 people in five locations rated the general factors influencing tranquillity (CPRE, Citation2007). The study encompassed photo-rating tasks involving the public, which were used to define thresholds for the criteria represented in the GIS, such as the distance at which the impact of a road decreases tranquillity (Jackson et al., Citation2008). Another study in the Dorset Area of Outstanding Beauty included participatory appraisals with over 800 participants (Hewlett et al., Citation2017). The criteria people deemed important in influencing tranquillity were identified through focus groups, household and on-site surveys with local authorities and agencies, visitors and residents, and those groups typically considered ‘hard to reach’ (Hewlett et al., Citation2017). Criteria identified as contributing to tranquillity included open landscape, absence of anthropogenic noise, absence of traffic and people. From these criteria, researchers then selected the information they deemed quantifiable in a GIS (Hewlett et al., Citation2017). Including the public in the definition of criteria influencing tranquillity is important. However, these methods often elicit responses about an ideal tranquil setting. We would argue that perhaps the experience of tranquillity in the outdoors differs from how one imagines and describes an ideal tranquil setting during an interview situation when at home or in a community hall. We thus propose to distinguish two notions of tranquillity: the first is ‘potential tranquillity’, namely how people imagine a tranquil place to be and how they describe it. This notion of tranquillity can be modelled as areas where tranquillity can be said to potentially exist, using GIS data and criteria such as remoteness from infrastructure and people (Hewlett et al., Citation2017; Jackson et al., Citation2008). The other notion is ‘experienced tranquillity’, namely areas where people actually experience tranquillity. These are areas where tranquillity is consumed, and where the potential for tranquillity meets demand. Based on the need to assess tranquillity as experienced, the two overarching research questions for this study were:
what influences people’s experience of tranquillity in outdoor landscapes?
where do people experience tranquillity?
By focusing on tranquillity as experienced, we need methods to assess this place-based experience, potentially across large areas. Qualitative interviews and detailed surveys are well-established methods suited to elicit information about how and where people experience tranquillity. However, these methods are not scalable, as interviewing people across large areas is often cost-prohibitive. In this regard, the advent of social media where people upload digital content provides us with a novel source of data to analyse the experiences of many people across large tracts of land(Dunkel, Citation2015). These user-generated data are created by non-professionals and shared on social media platforms independently of formal research projects. Such platforms include, for example, the microblogging service Twitter, or the photosharing platforms Flickr and Instagram. The past decade has witnessed a large growth in research exploring such user-generated content (Stieglitz et al., Citation2018), with Twitter and Flickr being two of the most frequently (and readily accessible) sources (Ghermandi & Sinclair, Citation2019). On Flickr, users can share photographs that they can optionally tag with keywords (tags) and coordinates ().
Researchers have used Flickr in landscape-related research, for instance to extract place descriptions (Capineri, Citation2016; Mackaness & Chaudhry, Citation2013; Purves et al., Citation2011), characterise landscapes from the viewpoint of the public (Wartmann et al., Citation2018), or study cultural landscape value (van Zanten et al., Citation2016). With the availability of social media as a data source, questions arise as to how they might complement more conventional methods such as interviews and surveys (Heikinheimo et al., Citation2017; Wartmann et al., Citation2018). In this study, we therefore developed a hybrid methodology that combines field-based interviews and tranquillity ratings with an analysis of social media content as a way of exploring the notion of tranquillity as it is experienced.
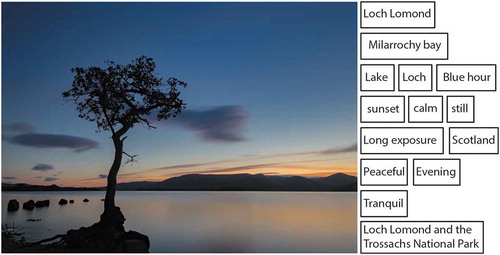
Figure 1. Example of Flickr photograph with associated user-generated tags. Image: ‘Blue Hour at Loch Millarochy’ by Rob Donnelly on Flickr.com, licenced under Creative Commons (CC BY-NC-ND 2.0).
We take as an example the case of Loch Lomond and The Trossachs National Park (LLTNP) in Scotland, which is a popular recreation area that has included protecting and enhancing areas of tranquillity as a strategic goal. Specifically, the park identified the need for a tranquillity map that takes into account people’s experience in order to plan and manage recreational amenities, and to further improve overall recreational service provision in the national park (pers. comm. S. Melville, Landscape Officer LLTNP). We take this as an ideal study site to assess the complementary nature of social media data and its accuracy with respect to interview-based data.
2. Methods
In order to explore how and where people experience tranquillity, we interviewed park visitors and analysed social media data, which we now describe in more detail.
2.1. Overview of methodological approach
First, we conducted interviews at different sites throughout Loch Lomond and Trossachs National Park. The interviews served two purposes. On the one hand, we collected descriptions of people’s experience of tranquillity. On the other hand, we also asked respondents to rate their experience of tranquillity at the interview location. In our hybrid approach, we then compared these tranquillity ratings with a map we produced based on social media data in the form of Flickr photographs and associated tags and coordinates ().
The Flickr repository is searchable for these associated tags and geolocations. We could thus search for all photographs with the tag ‘tranquil’ or ‘tranquillity’ in our study area. Because not everyone is going to use these exact words, we developed a language-based methodology to identify all the terms likely to be used when describing a tranquil place. We selected all terms that interview respondents mentioned to be positively associated with tranquillity. Using a list of these terms, we searched the Flickr repository for georeferenced photographs with such tags associated with tranquillity. Mapping the locations of these photographs allowed us to identify where people experienced tranquillity. But it is not sufficient to simply create a density map of locations that use tranquil tags—this merely creates a map that mirrors those places most frequently visited and photographed. Instead it is necessary to first model the underlying distribution of all Flickr photographs taken, and to identify those regions where tranquillity was either over or under reported relative to the number of images recorded at any given location. We can then compare such a map with the tranquillity ratings collected from our interview respondents in the field. In what follows, we describe in more detail how we applied this methodology to our case study area.
2.2. Loch Lomond and the Trossachs National Park
The Loch Lomond and Trossachs National Park was created in 2002 as the first national park in Scotland and covers an area of 1865 km2. The park is characterised by mountains and glens, as well as many saltwater and freshwater lochs. The vegetation includes native woodlands, plantation forests, meadows and agricultural fields. Importantly, the landscapes in the national park are cultural landscapes that have been shaped by people for generations. Currently, over 15,000 people reside in the park (LLTNP, Citation2017). The landscapes of Loch Lomond have long proved popular for national and international tourists alike, their beauty reflected, for instance, in the writings of Sir Walter Scott (1771-1832). Nowadays the park attracts over 4 million visitors every year (LLTNP, Citation2017). Although some public transport exists, many areas of the park are difficult to reach, and a recent survey found that over 85% of visitors rely on private transport (LLTNP, Citation2017).
2.3. Eliciting descriptions of experienced tranquillity and collecting tranquillity ratings
We conducted field-based interviews with 100 participants recruited on-site at different locations throughout the park (). The goals of the interviews were to i) elicit descriptions of what contributes or detracts from people’s experience of tranquillity in the national park and ii) to collect field-based tranquillity ratings.
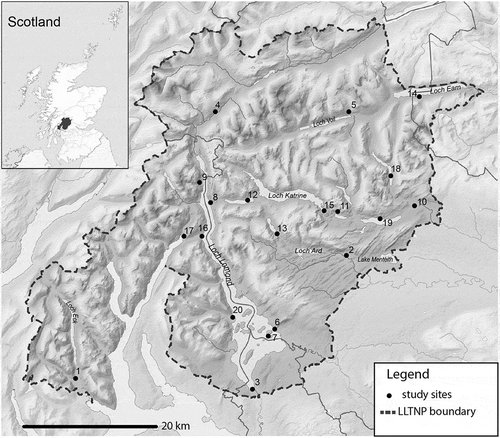
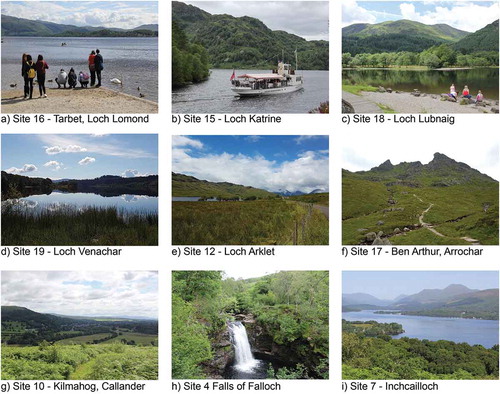
In order to cover a range of different landscape types, we stratified our interview sites using a sample of locations that had been utilised in a viewpoint analysis in the ‘Special Landscape Qualities’ report by Scottish Natural Heritage (SNH, Citation2010). Remote locations were excluded if they did not yield more than a threshold of 2 visitors per hour. Additional sites (Loch Chon, Loch Lubnaig, Loch Venachar) were added on the advice of park managers keen to learn whether recent interventions to improve recreational experiences had improved visitor’s perception of tranquillity. A map of all interview locations is shown in and by way of illustration, the landscapes at some of the interview sites are illustrated in . At each interview site, we drew a convenience sample of five people encountered during field work, while seeking to balance our sample with respect to age and gender. In total we interviewed 100 respondents, 49 women and 51 men.
Figure 2. Locations of interview sites: 1—A’Cruach, 2—Aberfoyle, 3—Balloch, 4—Falls of Falloch, 5—Glen Balquhidder, 6—Balmaha, 7—Inchcailloch, 8—Invernsnaid, 9—Inveruglas, 10—Kilmahog near Callander, 11—Loch Achray, 12—Loch Arklet, 13—Loch Chon, 14—Loch Earn, 15—Loch Katrine, 16—Tarbet, 17—Arrochar, 18—Loch Lubnaig, 19—Loch Venachar, 20—Luss (base map credit: Nilfanion, licenced under Creative Commons CC BY-SA 3.0, contains Ordnance Survey data Qc Crown copyright and database right, image accessed from https://tinyurl.com/y97u9nqv, 23.1.2018).
For eliciting descriptions of tranquillity we chose a free-listing approach (also known as semantic fluency task). In free listing, respondents are asked to list all terms that come to their mind that they associate with a particular semantic field, such as colours or food items (Berlin & Kay, Citation1969; Hough & Ferraris, Citation2010). Free-listing was originally developed in cognitive psychology and has since been successfully adapted to other domains, including social science landscape research, for instance to elicit terms for landscape character and cultural landscape values (Bieling et al., Citation2014; Wartmann & Purves, Citation2018). In this study, we used outdoor free-listing to elicit terms people associated with tranquillity. In order to focus interviews on the respondents’ landscape experience, we started the interview asking people to describe the landscape of the interview location, and any meanings or feelings that they associated with this landscape. All answers to these introductory practice questions were noted down, but not further analysed. Respondents were then asked the main free-listing elicitation statement: ‘what makes this place tranquil?’. After people had finished listing the terms they positively associated with tranquillity, we used the elicitation statement ‘what makes this place less tranquil?’ to also collect terms negatively impacting tranquillity. After these two free-listing tasks, we asked respondents to rate their experience of tranquillity at the interview site ranging from 1—‘not tranquil at all’ to 5—‘very tranquil’. The interview concluded with a set of closed questions on background information, including activities conducted while in the national park, frequency of visits, residency (classified as: within the LLTNP, elsewhere in Scotland, in the UK, outside UK), current place of residence (urban, rural, or in between), age group, and gender. All answers from respondents were noted down on printed-out survey forms and later digitised for subsequent analysis. To reduce the influence of weather conditions and interviewer variation, the first author of this study conducted all interviews on relatively sunny days between 11th July and 3 August 2017.
2.4. Analysing descriptions of experienced tranquillity from field interviews
Based on the two free-listing tasks we collated two lists of terms. The first list contains all answers to the question ‘what makes thisplace tranquil?’. The second list contains answers to ‘what makes thisplace less tranquil?’. We analysed each list using ‘open coding’ (Crang & Cook, Citation2007), a common method in the humanities through which the researchers identify recurring themes in interview data. The themes identified from the interview data were then used as the basis for ‘structured coding’ (Crang & Cook, Citation2007), whereby interview statements were allocated to the previously identified themes. For instance, through open coding of our first list of terms we found mentions including ‘the view is lovely’, ‘gorgeous scenery’ or ‘the view’. We thus identified ‘scenery’ as an emerging theme that contributes to tranquillity. In structured coding, we then identified other interview statements belonging to the ‘scenery’ category as a way of categorising the diverse interview statements. Assuming the more mentions in a theme, the more important it was, we enumerated the number of mentions per theme.
2.5. Analysing and mapping tranquillity ratings from interview respondents
We analysed the tranquillity ratings from interview respondents (on a scale from 1–5) by calculating the mean tranquillity rating for each interview site and visualised these mean ratings per interview site on a map. Furthermore, we tested for significant differences between tranquillity ratings at different interview locations, as well as whether ratings from people living in rural, urban and periurban settings were different. Since the data were not normally distributed, we applied the non-parametric Kruskal-Wallis test using a significance level of 0.05.
Figure 3. Examples of interview sites in different landscape settings in the Loch Lomond and The Trossachs National Park.
2.6. Mapping experienced tranquillity based on Flickr tags
Not every user applies the tag ‘tranquil’ to a photograph of a landscape that was experienced as tranquil. Indeed we only found about 100 photographs with the tags tranquil or tranquillity. We thus needed to use an expanded list of Flickr tags to search for. Because we wanted to use a conceptualisation of tranquillity derived from the bottom-up, we created a list of terms based on our interview responses. We achieved this by selecting all terms that were mentioned as contributing to tranquillity (e.g. peaceful, quiet, relaxation, water). Because we can only use single words for our keyword search in Flickr, we removed negated expressions (e.g. not busy, no people, no trash), so as to avoid including photographs tagged as busy into our sample. Finally, we also removed any words that have no information content for our study (e.g. they, only, it, and). We thus retained single terms that had positive connotations, resulting in a list of 216 terms respondents had mentioned in association with experiencing tranquillity. We used the set of 216 keywords defined from interviews to search for photographs on Flickr with tags that matched at least one of those keywords. We accessed Flickr photographs through the Flickr Application Programming Interface (API), which, for the terms selected, enabled us to retrieve georeferenced photographs falling within a bounding box covering our study area. We accessed the API through a Java programme that we developed specifically for this purpose. To overcome download constraints, we split the list of terms into sets of ten and used multiple queries to download all photographs with the associated tags. We then deleted all duplicate downloads (e.g. if the same photograph with multiple tags was downloaded in different queries) using the unique photograph ID. The resulting data set consisted of meta-information from photographs matching the search criteria in the bounding box, namely a set of decimal degree coordinates for each photograph, tags, title, date taken, the URL of the photograph, the unique ID, and the username of the contributor. As a preprocessing step we filtered bulk uploads, where one user added many images with identical tags (Hollenstein & Purves, Citation2010), which artificially increases the sample size without adding any new information. After the download and the filtering of bulk-uploads and duplicates, our data set contained 22,082 photographs. User contribution to this data set was unequal (max = 780 photographs; min = 1 photograph; mean = 21.80; median = 2; ±5.63) and showed a long-tail. For example, 3537 users each uploaded 10 photographs or less, while 21 users each uploaded over 100 photographs.
If we map the distribution of this data set, we simply map a subset of all Flickr photographs. Since we are interested in where people experience tranquillity, we need to identify places were Flickr photographs with tranquil tags are particularly concentrated as compared to all Flickr photographs. We therefore applied a correction method reported in similar studies that use Flickr data (Hollenstein & Purves, Citation2010), namely to calculate a χ-expectation surface.
This χ-expectation surface represents how unexpected an observed distribution of Flickr photographs is (e.g. only photographs with tranquil tags obs), as compared to the distribution of all Flickr photographs (the expected distribution, exp):
Essentially, the χ- expectation surface highlights where we found more, equal or less content than expected as compared with the all photographs found on Flickr for a certain area. To generate this χ-expectation surface, we also downloaded all Flickr photographs for our bounding box, and filtered this data set again for bulk-uploads and duplicates. The data set contained 46,886 photographs after pre-processing, stemming from 6851 different users (max = 1081 photographs; min = 1 photograph; mean = 6.84; median = 2; ±30.61). For the χ-expectation surface we chose a relatively large raster size of 1 × 1 km grid cells, because the content of a photograph might be reflective of the local environment where the photograph was taken, not just the location itself. We then calculated the number of photographs per grid cell, both for photographs with selected tags (obs) and for all photographs (exp). We normalised the obs grid by multiplying each grid value by the total number of Flickr photographs in the bounding box divided by the total number of Flickr photographs in the data set that contain that selected tag, and then calculated the χ-expectation surface using the formula presented above. For a map visualisation, we represent three classes of values on our map (more than expected, as expected, less than expected), using quantiles to define the classes.
2.7. Comparing tranquillity ratings from interview respondents with a map based on Flickr photographs and the Quietness Suitability Index
In order to check the validity of our results, we compared our tranquillity ratings collected from respondents in the field with our map depicting where we found more or less Flickr photographs with tranquil tags than would be expected. This was undertaken by visual inspection of the differences between the two maps. As a final step, we also compared the tranquillity ratings from respondents with the Quietness Suitability Index EEA (Citation2016b) using the same approach.
3. Results
3.1. Exploring tranquillity through interviews
In total we interviewed 100 people at our 20 different interview locations. The largest part of respondents lived in Scotland (n = 43), followed by international visitors from outside the UK (n = 35). Eighteen respondents lived elsewhere in the UK, and four were residents of the national park. For almost half of the respondents it was their first visit to the park (n = 46). The most frequently stated reason for visiting the park was hiking (n = 38), followed by enjoying the views (n = 32), tranquillity (n = 25) and fresh air (n = 12). Other activities such as fishing, kayaking or camping were also mentioned, but less frequently. When we simply counted the frequency of terms from interview responses to the question: ‘What makes this place tranquil?’, the most frequently mentioned terms included water, tranquil, and nature ().
When we grouped responses into different themes to deal with the use of different terms to describe a similar aspect, we identified several themes (). The absence of people was the most prominent theme, followed by the presence of certain landscape elements, such as water bodies and mountains. The absence of noise from traffic and other disturbances was also important. Other positively contributing factors were the presence of nature and wildlife, as well as scenery and natural sounds. Furthermore, several respondents stated that other people who behaved responsibly, and the absence of trash, contributed to their feeling of tranquillity ().
Table 1. Example of interview responses for the question ‘what makes this place more tranquil?’
In contrast, the presence of people, and traffic, was stated as making interview locations less tranquil (). Windy and rainy weather was also frequently mentioned as decreasing tranquillity, as well as antisocial behaviour and anthropogenic noise.
Figure 4. Wordcloud for words mentioned as contributing to tranquillity (larger size represents more mentions of a word).
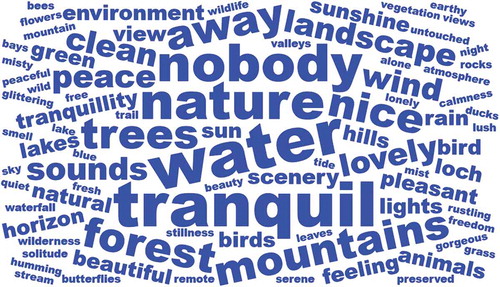
Table 2. Example of interview responses for the question ‘what makes this place less tranquil?’
3.2. Field-based tranquillity ratings
Across the 20 interview locations, the mean perceived tranquillity rating was relatively high with 4.18 out of 5 (±0.92, median = 4; n = 100).
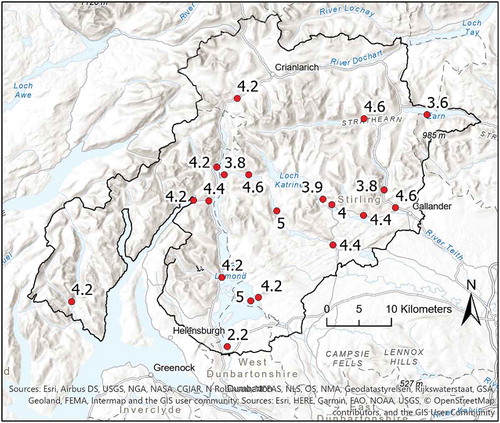
The locations with highest rated tranquillity were the island of Inchcailloch in Loch Lomond and the campsite at the shores of Loch Chon, which were both rated 5 by all respondents (). The lowest mean tranquillity rating for an interview location was 2.2 (±0.45; n = 5) at the shores of Loch Lomond in Balloch (). There were significant differences in tranquillity ratings between interview locations (Kruskal-Wallis χ2 = 32.768; df = 19; p = 0.026). Across all interview locations, we did not find differences in how people living in rural, urban or peri-urban areas perceived tranquillity (Kruskal-Wallis χ2 = 2.646; df = 2; p = 0.266).
Figure 5. Mean tranquillity ratings from respondents at study sites (5: very tranquil, 1: not tranquil).
3.3. Mapping experienced tranquillity based on Flickr tags
People uploaded more Flickr photographs with tags related to tranquillity around Loch Lomond and other freshwater bodies such as Loch Katrine, Loch Venachar and Loch Lubnaig than would be expected from all Flickr photographs uploaded ().
Figure 6. χ-expectation surface for Flickr photographs with tags related to tranquillity.
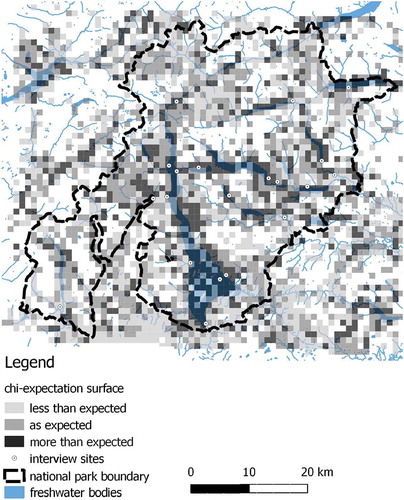
Fewer photographs with tags related to tranquillity than expected from the overall density of Flickr photographs were uploaded around settlements and towns such as Callander, Balloch, and Aberfoyle. At the shores of Loch Lomond near Balloch less content was uploaded than expected, despite the closeness to a water body. Other areas where we observe less photographs than expected despite the presence of water were Lake Menteith and the Western shore of Loch Earn. We also observe ‘white spots’ on the tranquillity map where there are no Flickr photographs available. For these areas we have no information whether they are not photogenic, or not accessed by users inclined to upload photographs. The area North of Loch Katrine is not accessible by motorised transport and is characterised by glens and hills, suggesting this area might be challenging to access for many people. However, for the topographically challenging terrain between the Northernmost point of Loch Lomond and Loch Voil people uploaded content. This area is characterised by negative χ-values, indicating that there is less content related to tranquillity than expected from the overall distribution.
3.4. Comparing different approaches for mapping tranquillity
We first compare our approach based on user-generated content with the insitu ratings we collected, before comparing both these results with the map of ‘quiet areas’ ().
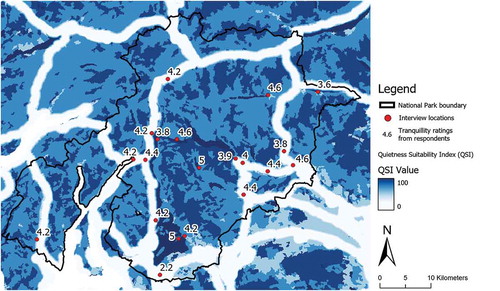
Figure 7. Quietness Suitability Index values (EEA, Citation2016a) overlaid with mean tranquillity ratings from respondents at study sites (5: very tranquil, 1: not tranquil).
Visually comparing the tranquillity ratings from interviews in the field () with the χ-expectation surface of user-generated content () we observe the following: the interview locations are almost all located in grid squares with positive χ-values, indicating more photographs with tags semantically related to tranquillity were uploaded in these squares. The highest tranquillity ratings from respondents coincide with relatively contiguous areas of high χ-values, such as around Loch Chon and Inchcailloch. The lowest tranquillity rating for Balloch is at the border of an area with negative χ-values, suggesting lower perceived tranquillity. The tranquillity ratings collected in the field thus correspond well with the χ-expectation map from user-generated content, with some exceptions. For example, the site A’Cruach at the Southwestern tip of the national park was rated as relatively tranquil (mean rating of 4.2 out of 5), but is located in an area with negative χ-values. The same applies to Kilmahog, near Callander. Thus, while the overall insights we gain about areas perceived as tranquil correspond with the map from user-generated content and respondents’ rating, user-generated content fails to capture finer-grained nuances of the experience of tranquillity gathered through interviews.
Comparing the map of tranquillity ratings from interview respondents with the quiet area map (EEA, Citation2016b), we observe agreement over freshwater bodies, which are considered highly tranquil/quiet, such as Loch Lomond, Loch Katrine and Loch Chon (). However, stark contrasts between the two maps exist in areas where major roads run alongside water bodies. The quiet area map depicts this area with the lowest possible rating of quietness, whereas participants rated most of these areas (except Balloch) as 4 or higher out of 5. In some cases, the entire area of a freshwater body is rated as the lowest quietness index (such as Loch Earn), whereas respondents rated this location as moderately tranquil (mean = 3.6).
4. Discussion
Our aim was to explore how and where people who visit a Scottish national park experience tranquillity. To do so, we developed a novel approach that integrates field-based interviews with the analysis of social media in the form of Flickr photographs. We now discuss these two approaches as complementary sources of information to answer our two main research questions: i) what influences people’s experience of tranquillity in outdoor landscapes? and ii) where do people experience tranquillity?
4.1. Responses from field-based interviews reveal what people experience as tranquil
How respondents described tranquillity highlights that tranquillity is a multi-sensory experience involving sound and sight, but also smell, as well as emotional responses to the environment. These findings are in line with previous research stating that tranquillity was influenced by sounds as well as visual stimuli (Pheasant et al., Citation2010; Watts & Pheasant, Citation2015b), but provide further nuances through the semantically rich descriptions of experienced tranquillity. Respondents stated that viewing water bodies increases tranquillity, which is supported by previous empirical evidence about the importance of water bodies for recreation (Herzog & Bosley, Citation1992; White et al., Citation2010). As factors detracting from tranquillity respondents mentioned, for example, many people and traffic, which are in line with results from previous studies in England (Hewlett et al., Citation2017; Jackson et al., Citation2008). Several respondents mentioned that observing people behave responsibly contributed to tranquillity. Rather than the complete absence of people, the quality of their behaviour seems to be important for tranquillity. This extends findings in previous studies that the material results from antisocial behaviour such as litter and graffiti decreased tranquillity ratings in urban green spaces, where those places were then perceived as less safe (Watts et al., Citation2013).
Even though traffic and people were often mentioned as decreasing tranquillity, this was not reflected in the numerical tranquillity ratings. Respondents rated most interview locations as tranquil, even for interview locations close to roads or in parking lots. This suggests that people were able to stand in a busy parking lot with a nice view, 'see past the noise', and allow the visual stimuli to dominate their experience. In this way, a busy parking lot became a tranquil place. This integrated experience may be different in field settings where people have certain expectations about the areas they visit for recreation, compared with controlled experiments, where anthropogenic noise was shown to reduce tranquillity ratings of natural scenes (Watts & Pheasant, Citation2015b). Our findings from interviews highlighted important differences between what people describe as detracting from tranquillity and their rating of tranquillity in outdoor landscapes. However, because surveys and interviews are time-consuming to conduct, such methods are typically limited to smaller areas. To address this issue, we explored social media as a potential data source for exploring experienced tranquillity.
4.2. Exploring experienced tranquillity through Flickr photographs
Rather than relying on a top-down approach where experts define the terms used to search for social media photographs (e.g. van Zanten et al., Citation2016), our approach is based on first defining the concept of tranquillity from the bottom-up. Using a list of terms that interview respondents associated with tranquillity to search for photographs potentially provides a conceptualisation of tranquillity that is closer to that of the general public. Our map produced from Flickr photographs shows higher concentrations of tranquil photographs than expected in areas around water bodies that are accessible by motorised transport. The absence of motorised transport is thus not a prerequisite for people to experience tranquillity, which was also shown in a study in the Lake District, where user-generated image and descriptions uploaded to the platform Geograph contained references to tranquillity near busy roads (Chesnokova et al., Citation2018). We found high correspondence between the tranquillity map produced from Flickr content and the tranquillity ratings from respondents in the field—suggesting that this form of user-generated content is a meaningful addition to field-based interviews. Importantly, we found marked differences with an existing map of quiet areas (EEA, Citation2016b). Results from interviews and Flickr photographs both indicate people experience tranquillity in accessible places, often irrespective of roads nearby, whereas the map of quiet areas depicts these areas as heavily impacted by noise. One reason for these differences may be that the maps of quiet areas allocate high importance to detractors such as noise, whereas tranquillity as experienced in the field seems to be less influenced by traffic noises, but more by perceived aesthetic qualities of the visible surroundings.
4.3. Implications
In tandem with others, our findings suggest that the areas where tranquillity is experienced do not always overlap with quiet areas where noise is absent. The quiet areas include remote mountain glens and hill tops with unobstructed views across natural landscapes, areas where ‘potential tranquillity’ can be said to exist. These may be very tranquil areas, but few people possess the willingness and abilities to physically reach such areas. Analysis of our data showed that areas where tranquillity is actually experienced by many may be popular parking spots, or at the side of lochs next to roads. Thus many people experience tranquillity at the edges or boundaries of tranquil areas. Those edges are zones that are easily accessed and retain enough properties to make them feel tranquil. We suggest that such tranquil zones are more important to a mass appreciation of tranquillity than the core areas of ‘potential tranquillity’ areas that may have the highest level of a potential for tranquillity (or quietness). Given the emphasis on ‘tranquillity as experienced’, we argue that planning decisions need to take account of the difference between areas most tranquil, and areas where most people experience tranquillity. Levett observed that many visitors to areas valued for their tranquillity ’never venture more than a few hundred yards from car parks on busy roads’ (Levett, Citation2000, p. 13). He concluded that by exploring what kind(s) of access people want could satisfy a large number of visitors without opening up more remote areas. Our findings showed that the provision of amenable infrastructure (e.g. parking, picnic tables, maintained walking paths to loch shores) close to roadsides provides opportunities for many visitors to experience tranquillity. Such observations have important implications for the identification and management of tranquil areas.
It is apparent that park visitors experienced tranquillity along a continuum, and that this experience is subjective. For example, the busy car park on a main road afforded just as much self-reported tranquillity for many people as it did to the few who made the long journey to a remote summit. Accommodating this broad spectrum of experiences within the planning process is very challenging. Do we ‘pave over paradise’ and facilitate access for the many or do we use a notion of tranquillity more akin to wilderness, and safeguard tranquillity by limiting access to, and development of, such areas? We would argue that these questions are best resolved through participatory planning processes and consultations with stakeholders. Environmentally deterministic models (typically using GIS) tend to exclude such experiences and opinions, because of their subjective and qualitative (non-numerical) form that is difficult to represent in GIS (Thatcher et al., Citation2016). Leszczynski (Citation2009) argues that the hunger to formalise tends to rule out the qualitative and that the imposition of quantitative measures acts to constrain a richer description of place. More generally the failure to encapsulate people’s perceptions of place within GIS reflects a complex set of semantic and ontological issues that go beyond qualitative/quantitative debates.
There is therefore increasing acceptance of the need to develop innovative hybrid methodologies that capture the experience of the public alongside those of experts and so increase participation in the decision making process—the benefits being greater transparency and accountability, and shared ownership in the decision making process (Sieber, Citation2006). Our research supports this ambition, with the benefit of accommodating a broader (less exclusionary) definition of tranquillity through the use of social media content. Such broader definitions have the potential to improve the quality of decision-making in landscape management, though there remains the challenge of how to prioritise these varying experiences of tranquillity.
4.4. Limitations and further work
Social media content such as Flickr data is increasingly being used as a cost effective measure of sentiment, trends and activities (Tenkanen et al., Citation2017), though authors have also cautioned against data analysis in the absence of theory in the age of ‘big data’ (Kitchin, Citation2014). The use of Flickr (more specifically the tags and locations associated with the photographs) is biased insofar that it is a sample, shaped by the technology and the data ontology employed (Ghermandi & Sinclair, Citation2019). We chose Flickr for its unique combination of geolocation and semantic content of tags, and although a range of other social media platforms could be tested, they are likely to exhibit similar bias. Nonetheless, research has shown that such data provides information comparable with more cost-intensive approaches (Heikinheimo et al., Citation2017; Mancini et al., Citation2018). By comparing social media outputs with ratings collected in the field, together with the quietness suitability index we have sought to both validate this approach and highlight the nuances of tranquillity as it is experienced. In future work we propose to test further data collection and elicitation methods. This could be done using active inclusion of the public through a citizen science approach, where people are invited to contribute by rating the tranquillity of grid squares on a web map, or through smartphone applications at sample points in the field. Additionally, other forms of user-generated content may be explored, such as full-text hiking blogs, which include accounts of experiences of people actively exploring the landscape (Wartmann et al., Citation2018). We also see value in analysis of the photographs themselves; these can be processed using automated image recognition and annotation to broaden the available data sources and extend our analysis beyond the use of language associated with photographs (Wartmann et al., Citation2019).
5. Conclusion
Tranquillity is recognised as an important landscape quality that helps ameliorate our stressful lives. Therefore various efforts have attempted to incorporate notions of tranquillity into policy-making and planning. One of the challenges is to include those areas where people actually experience (i.e. ‘consume’) tranquillity as opposed to where tranquil areas can potentially be said to exist (i.e. ‘supply of tranquillity’). We argue that in addition to interviews and surveys, digital social media provides exciting possibilities in this regard; the present study constitutes a first step towards harvesting such data sources. The originality of our approach lies in combining field-based assessments of tranquillity to collect natural language terms that people positively associate with tranquillity, and using those to search for user-generated content containing such terms. Such an approach allowed the definition of tranquillity to emerge through the language respondents used in describing the concepts they associated with it, and thus addressed issues involved in expert-led, sometimes narrow, definitions of tranquillity. By using the semantic content of tags to select Flickr photographs, we are able to identify areas of tranquillity that would not otherwise be considered as such. The spatial pattern revealed from mapping Flickr photographs provides an additional and complementary perspective to existing approaches for tranquillity mapping. We would ascribe to the idea that research on environmental applications of social media is only in its infancy with future research required to address issues of data quality (linked to a deeper understanding of the type of contributors and their motivations). We also argue that this research illustrates the value of social media data in deepening our understanding of people’s experience of tranquillity and shows how associated analysis can complement existing bottom-up/top-down approaches to understanding human-environment interactions.
Disclaimer
The views and opinions expressed in this article are those of the authors alone, and do not necessarily reflect those of the institutions they work for or those of the Loch Lomond and the Trossachs National Park.
Acknowledgments
This work was financially supported by the Swiss National Science Foundation [grant no. 171911]. We thank members of staff at the Loch Lomond and the Trossachs National Park for insightful discussions and feedback on the results of this study, particularly Sara Melville, Fiona Stewart, and Alan Bell. We are grateful to Emily Brady for insightful discussions during the course of this study and three anonymous reviewers for their comments on a previous version of this manuscript. Any mistakes are our own.
Disclosure statement
No potential conflict of interest was reported by the authors.
Additional information
Funding
Notes on contributors
Flurina M. Wartmann
Dr Flurina M. Wartmann currently works at the Swiss Federal Research Institute for Forest, Snow and Landscape. Her research focuses on interdisciplinary approaches to study cultural landscape values and sense of place using public surveys, social media data and GIS analysis. Particularly, she is interested in how we can extract and spatialise landscape descriptions through ethnographic and digital text data sources, and ultimately, how such information can be used for landscape policy-making and planning.
William A. Mackaness
Dr William A. Mackaness is a senior lecturer in Geographical Information Science at The University of Edinburgh in the School of GeoSciences. His research interests are in ideas of ‘place’ and development of intuitive modes of interacting in worlds now mediated by location based technologies. His research in vernacular geographies has emerged from research in text based descriptions of place and the automatic construction and delivery of wayfinding instructions through mobile devices. Current research is focused around applying text based exploratory analysis techniques to geolocated social media as a way of understanding how people variously experience the world around them.
References
- Berlin, B., & Kay, P. (1969). Basic color terms: Their universality and evolution. University of California Press.
- Bieling, C., Plieninger, T., Pirker, H., & Vogl, C. R. (2014). Linkages between landscapes and human well-being: An empirical exploration with short interviews. Ecological Economics, 105, 19–30. doi:10.1016/j.ecolecon.2014.05.013
- Capineri, C. (2016). Kilburn High Road Revisited. Urban Planning, 1(2), 128. doi:10.17645/up.v1i2.614
- Chesnokova, O., Taylor, J. E., Gregory, I. N., & Purves, R. S. (2018). Hearing the silence: finding the middle ground in the spatial humanities? Extracting and comparing perceived silence and tranquillity in the English Lake District. International Journal of Geographical Information Science, 33(12), 2430–2454, doi:10.1080/13658816.2018.1552789
- CPRE. (2007). Campaign to Protect Rural England and Countryside Commission.
- CPRE and the Countryside Commission. (1995). Tranquil areas: England map. Retrieved April 3, 2020 from https://www.cpre.org.uk/wp-content/uploads/2019/11/intrusion_map_england_1990_1.pdf
- Crang, M., & Cook, I. (2007). Doing ethnographies. Sage.
- Dunkel, A. (2015). Visualizing the perceived environment using crowdsourced photo geodata. Landscape and urban planning, 142, 173–186. doi:10.1016/j.landurbplan.2015.02.022
- EEA. (2016a). Quiet areas in Europe dataset. European Environment Agency (EEA). Accessed April 3, 2020 from https://www.eea.europa.eu/data-and-maps/data/quiet-areas-in-europe-2
- EEA. (2016b). Quiet areas in Europe — The environment unaffected by noise pollution. EEA Report No 14/2016 (Tech. Rep.). European Environment Agency. https://www.eea.europa.eu/publications/quiet-areas-in-europe
- Ghermandi, A., & Sinclair, M. (2019). Passive crowdsourcing of social media in environmental research: A systematic map. Global environmental change, 55, 36–47. doi:10.1016/j.gloenvcha.2019.02.003
- Heikinheimo, V., Minin, E. D., Tenkanen, H., Hausmann, A., Erkkonen, J., & Toivonen, T. (2017). User-Generated Geographic Information for Visitor Monitoring in a National Park: A Comparison of Social Media Data and Visitor Survey. ISPRS International Journal of Geo-Information, 6(3), 85. doi:10.3390/ijgi6030085
- Herzog, T. R., & Bosley, P. J. (1992). Tranquility and preference as affective qualities of natural environments. Journal of Environmental Psychology, 12(2), 115–127. doi:10.1016/S0272-4944(05)80064-7
- Herzog, T. R., & Chernick, K. K. (2000). Tranquility and danger in urban and natural settings. Journal of Environmental Psychology, 20(1), 29–39. doi:10.1006/jevp.1999.0151
- Hewlett, D., Harding, L., Munro, T., Terradillos, A., & Wilkinson, K. (2017). Broadly engaging with tranquillity in protected landscapes: A matter of perspective identified in GIS. Landscape and Urban Planning, 158, 185–201. doi:10.1016/j.landurbplan.2016.11.002
- Hollenstein, L., & Purves, R. (2010). Exploring place through user-generated content: Using Flickr to describe city cores. Journal of Spatial Information Science, 1. doi:10.5311/JOSIS.2010.1.3
- Hough, G., & Ferraris, D. (2010). Free listing: A method to gain initial insight of a food category. Food Quality and Preference, 21(3), 295–301. doi:10.1016/j.foodqual.2009.04.001
- Jackson, S., Fuller, D., Dunsford, H., Mowbray, R., Hext, S., MacFarlane, R., & Haggett, C. (2008). Tranquillity Mapping: developing a robust methodology for planning support (Tech. Rep.). Report to the Campaign to Protect Rural England, Centre for Environmental & Spatial Analysis, Northumbria University, Bluespace environments and the University of Newcastle upon on Tyne.
- Kaplan, R., & Kaplan, S. (1989). The experience of nature: A psychological perspective. CUP Archive.
- Kaplan, S. (2001). Meditation, restoration, and the management of mental fatigue. Environment and behavior, 33(4), 480–506. doi:10.1177/00139160121973106
- Kitchin, R. (2014). Big Data, new epistemologies and paradigm shifts. Big Data & Society, 1(1), 205395171452848. doi:10.1177/2053951714528481
- Leszczynski, A. (2009). Quantitative Limits to Qualitative Engagements: GIS, Its Critics, and the Philosophical Divide. The Professional Geographer, 61(3), 350–365. doi:10.1080/00330120902932026
- Levett, R. (2000). A headline indicator of tranquillity: definition and measurement issues. Interim report to CPRE by CAG Consultants 7th July 2000 (Tech. Rep.). CAG Consultants for CPRE.
- LLTNP. (2017). National Park Partnership Plan. A view to 2018-2023. Draft for Consultation. (Tech. Rep.). Loch Lomond and The Trossachs National Park Authority.
- MacFarlane, R., Haggett, C., Fuller, D., Dunsford, H., & Carlisle, B. (2004). Tranquillity Mapping: developing a robust methodology for planning support (Tech. Rep.). Report to the Campaign to Protect Rural England, Countryside Agency, North East Assembly, Northumberland Strategic Partnership, Northumberland National Park Authority and Durham County Council, Centre for Environmental & Spatial Analysis, Northumbria Univ.
- Mackaness, W. A., & Chaudhry, O. (2013). Assessing the Veracity of Methods for Extracting Place Semantics from Flickr Tags. Transactions in GIS, 17(4), 544–562. doi:10.1111/tgis.12043
- Mancini, F., Coghill, G. M., & Lusseau, D. (2018). Using social media to quantify spatial and temporal dynamics of nature-based recreational activities. PloS one, 13(7), e0200565. doi:10.1371/journal.pone.0200565
- Ministry of Housing Communities and Local Government. (2018). National Planning Policy Framework (Tech. Rep.). Ministry of Housing, Communities & Local Government. https://www.gov.uk/government/collections/revised-national-planning-policy-framework
- Pheasant, R. J., Fisher, M. N., Watts, G. R., Whitaker, D. J., & Horoshenkov, K. V. (2010). The importance of auditory-visual interaction in the construction of ‘tranquil space’. Journal of Environmental Psychology, 30(4), 501–509. doi:10.1016/j.jenvp.2010.03.006
- Pheasant, R. J., Horoshenkov, K., Watts, G. R., & Barrett, B. (2008). The acoustic and visual factors influencing the construction of tranquil space in urban and rural environments tranquil spaces-quiet places? The Journal of the Acoustical Society of America, 123(3), 1446–1457. doi:10.1121/1.2831735
- Pheasant, R. J., Watts, G. R., & Horoshenkov, K. V. (2009). Validation of a tranquillity rating prediction tool. Acta Acustica united with Acustica, 95(6), 1024–1031. doi:10.3813/AAA.918234
- Purves, R. S., Edwardes, A., & Wood, J. (2011). Describing place through user generated content. First Monday, 16(9). doi:10.5210/fm.v16i9.3710
- Rendel, S. (1998). Simon Rendel: an appreciation. Landscape Research, 23(1), 83–88. doi:10.1080/01426399808706527
- Sieber, R. E. (2006). Public participation geographic information systems: A literature review and framework. 96(3), 491–507. https://doi.org/10.1111/j.1467-8306.2006.00702.x.
- SNH. (2010). The Special Landscape Qualities of the Loch Lomond and The Trossachs National Park. Scottish National Heritage Commissioned Report, No. 376 (iBids and Project n? 648) (Tech. Rep.). Scottish National Heritage and Loch Lomond and The Trossachs Natiobnal Park Authority.
- Stieglitz, S., Mirbabaie, M., Ross, B., & Neuberger, C. (2018). Social media analytics–Challenges in topic discovery, data collection, and data preparation. International journal of information management, 39, 156–168. doi:10.1016/j.ijinfomgt.2017.12.002
- Tenkanen, H., Di Minin, E., Heikinheimo, V., Hausmann, A., Herbst, M., Kajala, L., & Toivonen, T. (2017). Instagram, Flickr, or Twitter: Assessing the usability of social media data for visitor monitoring in protected areas. Scientific Reports, 7(1), 17615. doi:10.1038/s41598-017-18007-4
- Thatcher, J., Bergmann, L., Ricker, B., Rose-Redwood, R., O’Sullivan, D., Barnes, T. J., Beltz Imaoka, L., Burns, R., Cinnamon, J., Dalton, C. M., Davis, C., Dunn, S., Harvey, F., Jung, J.-K., Kersten, E., Knigge, L., Lally, N., Lin, W., Mahmoudi, D., Young, J. C., & Barnesmoore, L. R. (2016). Revisiting critical GIS. Environment and Planning A, 48(5), 815–824. doi:10.1177/0308518X15622208
- van Zanten, B. T., Van Berkel, D. B., Meentemeyer, R. K., Smith, J. W., Tieskens, K. F., & Verburg, P. H. (2016). Continental-scale quantification of landscape values using social media data. Proceedings of the National Academy of Sciences, 113(46), 12974–12979. doi:10.1073/pnas.1614158113
- Velarde, M., Fry, G., & Tveit, M. (2007). Health effects of viewing landscapes – Landscape types in environmental psychology. Urban Forestry & Urban Greening, 6(4), 199–212. doi:10.1016/j.ufug.2007.07.001
- Visit Scotland. (2019). Visit Scotland webpage. Visit Scotland National Tourism Organisation. Retrieved September 6, 2019, from https://traveltrade.visitscotland.org/page/getting-around-scotland/
- Wartmann, F. M., Acheson, E., & Purves, R. S. (2018). Describing and comparing landscapes using tags, texts, and free lists: an interdisciplinary approach. International Journal of Geographical Information Science, 32(8), 1572–1592. doi:10.1080/13658816.2018.1445257
- Wartmann, F. M., & Purves, R. S. (2018). Investigating sense of place as a cultural ecosystem service in different landscapes through the lens of language. Landscape and Urban Planning, 175, 169–183. https://doi.org/10.1016/j.landurbplan.2018.03.021.
- Wartmann, F. M., Tieskens, K. F., van Zanten, B. T., & Verburg, P. H. (2019). Exploring tranquillity experienced in landscapes based on social media. Applied Geography, 113, 102112. https://doi.org/10.1016/j.apgeog.2019.102112
- Watts, G. R., Miah, A., & Pheasant, R. J. (2013). Tranquillity and soundscapes in urban green spaces - predicted and actual assessments from a questionnaire survey. Environment and Planning B: Planning and Design, 40(1), 170–181. doi:10.1068/b38061
- Watts, G. R., & Pheasant, R. J. (2015a). Identifying tranquil environments and quantifying impacts. Applied Acoustics, 89, 122–127. doi:10.1016/j.apacoust.2014.09.015
- Watts, G. R., & Pheasant, R. J. (2015b). Tranquillity in the Scottish Highlands and Dartmoor National Park – The importance of soundscapes and emotional factors. Applied Acoustics, 89, 297–305. doi:10.1016/j.apacoust.2014.10.006
- White, M., Smith, A., Humphryes, K., Pahl, S., Snelling, D., & Depledge, M. (2010). Blue space: The importance of water for preference, affect, and restorativeness ratings of natural and built scenes. Journal of Environmental Psychology, 30(4), 482–493. doi:10.1016/j.jenvp.2010.04.004