Abstract
A fuzzy image segmentation approach for qualitative classification of land cover was proposed recently. In this letter, such an approach is applied for estimation of impervious surface areas from Landsat-TM images. The method involves four main stages: (i) pre-processing for radiometric normalization and independent component transformation, (ii) fuzzy segmentation to create fuzzy image regions representing membership values to land cover classes, (iii) feature analysis to evaluate contextual properties of fuzzy image regions, and (iv) regression to estimate impervious surface area. In this letter, a support vector machine technique was applied to conduct supervised learning tasks. Experimental results suggest that the method provides an accurate and simple alternative for quantitative analysis of urban land cover.
1. Introduction
Impervious surfaces, such as roofs, roads, and open parking, prevent infiltration of rainfall into the soil and affect both the quantity and the quality of water resources. Although impervious surface areas represent a key indicator of watershed quality (Goetz and Jantz Citation2006), their digital extraction from remotely sensed images can be difficult (Clapham Citation2005). This is mainly because of the spectral heterogeneity of the urban landscape and the presence of mixed signals in coarse spatial resolution images (Fisher Citation1997).
An approach to solve such a problem is a quantitative classification (Clapham Citation2005). As opposed to qualitative thematic maps, which hold discrete class labels, quantitative thematic maps carry continuous values expressing class composition percentages. Clapham (Citation2005) proposed an accurate method for quantitative land cover mapping. After conducting an unsupervised classification, a sampling process was undertaken to visually compare each cluster with data extracted from aerial photographs. Then, the classified image was recoded manually to assign continuous estimates to the initial clusters. As a final result, percentages of impervious surface and canopy cover were obtained. Jantz et al. (Citation2005) used a similar approach for mapping impervious surface areas (ISAs). A decision tree algorithm, trained with samples collected visually from high spatial resolution orthophotos, was used to obtain impervious surface percentage values from principal components and vegetation indices derived from Landsat TM and ETM + bands. As a final step, automated masking and visual screening techniques were applied to minimize errors and produce the final estimates.
This study evaluates the potential of fuzzy segmentation for estimation of ISA values. Fuzzy image segmentation is a thematic partition of an image that produces image regions with indeterminate boundaries and thematic uncertainty. A fuzzy segmentation is similar to a fuzzy classification: that is, both processes allow partial membership of pixels to a set of target thematic classes. However, the output of fuzzy segmentation is understood as a temporary thematic partition of an image (i.e. as a first approximation that needs to be improved in a subsequent stage). Thus, once fuzzy image regions have been produced, a feature analysis stage is conducted to measure spatial and contextual properties and therefore to enrich the set of predictor variables that will be used to conduct the final prediction. By including such a stage into the image analysis process, fuzzy image segmentation goes one step further than traditional fuzzy classification. The main assumption underlying the fuzzy segmentation approach is that contextual properties of fuzzy image regions contribute to reduce the spectral confusion existing between land cover classes.
Fuzzy segmentation has been proposed recently to produce qualitative land cover classification of urban landscapes using high spatial resolution datasets (Lizarazo and Elsner Citation2008, Citation2009). In contrast, in this research fuzzy segmentation was used for estimating quantitative land cover, that is, ISAs from Landsat-TM images. The objective is to evaluate whether fuzzy image regions are useful to increase the accuracy of estimation of quantitative land cover properties.
Fuzzy segmentation aims to estimate membership values of pixels to target land cover classes. As the output is a quantitative variable, it is understood as a regression task that is solved using supervised machine learning techniques. Based on a training dataset, a fuzzy segmentation model is built to estimate membership values from spectral bands. In this research, fuzzy segmentation was implemented using a support vector machine (SVM), a statistical learning technique that has been applied for qualitative classification of remotely sensed data (Foody and Mathur Citation2004, Pal Citation2006) and sub-pixel land cover estimation (Walton Citation2008).
2. Study area and data
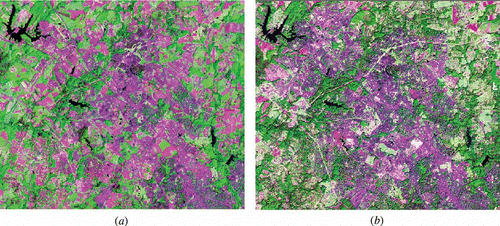
The study area is a small watershed located in Montgomery County, Maryland, USA. The Landsat-TM images were collected in 1990 and 2000. These orthoimages, comprising seven spectral bands, are provided in a UTM WGS84 projection with pixel size of 28.5 m at 50 m root mean square error (RMSE) absolute positional accuracy. The experimental area covers 655 × 560 pixels over the towns of Germantown and Gaithersburg. (a) and (b) show false colour compositions of these images. Because of brightness differences, the increase in developed land between the two dates is not apparent (urbanization corresponds roughly to the purple-coloured areas).
Figure 1. False Colour composition of two dates of Landsat images of the study area: (a) RGB742 of Landsat-TM 1990 and (b) RGB742 of Landsat-TM 2000.
As part of an extensive study on urbanization in the Chesapeake Bay Watershed, Jantz et al. (Citation2005) obtained accurate ISA maps for 1990 and 2000. In the study area, ground reference data were collected by rasterization of visually interpreted aerial photographs at 3 m spatial resolution. Then, the number of 3 m cells within each overlying 30 m cell was calculated to produce the ISA estimation. ISA maps represent impervious surfaces as a continuous variable, with values ranging from 0% (no impervious) to 100% (completely impervious). In addition, qualitative land cover maps for the same dates are available from the mid-Atlantic Regional Earth Science Applications Center (MA-RESAC) (Jantz et al. Citation2005). These thematic maps represent five land cover categories: water, urban, grass, trees, and bare soil. In this study, both ISA and thematic maps were used as ground reference for training sample collection and accuracy evaluation.
3. Methods
shows the image analysis workflow for estimating ISA using the fuzzy image regions method (FIRME). It involves four main stages: (i) pre-processing, (ii) fuzzy segmentation, (iii) feature analysis, and (iv) regression.
Figure 2. Sequence of steps used for image analysis in this study. The original Landsat image is pre-processed for radiometric normalization and independent component analysis. Using a categorical land cover sample, a fuzzy image segmentation is conducted to produce fuzzy image regions expressing membership values to classes. Then, fuzzy image region properties are analysed to produce fuzzy components that are used, with compositional training samples, as predictors to the regression stage that produces impervious surface values.
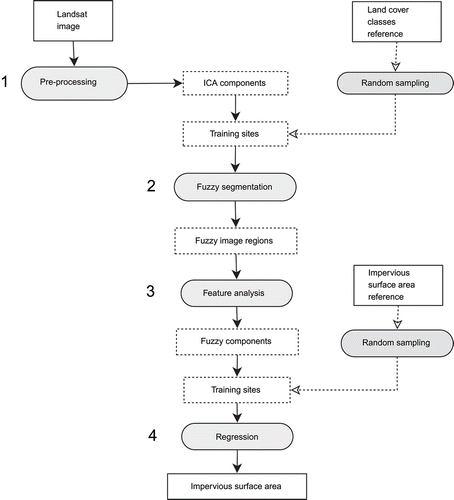
For the pre-processing stage, Landsat-TM images were normalized radiometrically by using histogram matching to match the intensities of the six usable channels of the 2000 scene to the ‘standard’ 1990 scene. This step contributes to reduce the effect of brightness differences between the two images. In addition, the original spectral channels were transformed into a new set of mutually independent component (ICA) channels that are intended to ‘uncover the underlying structure hidden in the mixed signals’ (Hyvarinen et al. Citation2001).
For the fuzzy segmentation stage, a supervised regression was applied. The regression model was fitted using land cover class memberships as a dependent (response) variable and six independent component bands as predictor (input) variables. An SVM with radial basis function (RBF) kernel was applied to create one impervious regression model for every land cover class using a one-against-all technique. Membership values assigned to training samples collected from the thematic maps were either 1 (full membership) or 0 (null membership). SVM hyper-parameters were tuned automatically using a grid search strategy in the interval γ ∈ [2−2:24] and cost ∈ [2−2:26] (Lizarazo Citation2008). As a result of this stage, five fuzzy image regions were obtained. Then, a sum-to-one constraint was applied to membership values to interpret fuzzy image regions as compositional classes.
For the feature analysis stage, the sum of logarithms (SOL) index was determined between pairs of fuzzy image regions. The SOL index is defined as follows:
For the final regression stage, the estimation of ISA was conducted using the nine fuzzy components as predictor values. An SVM technique was applied to create a single regression model using training samples with membership values collected from the ISA maps. The RBF kernel was parameterized using the grid search procedure described above. Once the regression model was established, it was applied to predict ISA values for a given date.
As a final step, the accuracy of impervious surface mapping was evaluated. The ISA 1990 and 2000 maps were subset and resampled to 28.5 m to match the window and pixel size of the Landsat-TM images. Although this resampling degrades the quality of ground reference data, it was considered a preferable choice to coarsen the original pixel size of Landsat images. Direct comparison between the predicted ISA and the ground reference ISA was conducted using the standard correlation index (Jensen Citation2005). Area estimation of impervious surfaces in a given image was calculated by taking the sum of all pixel membership values for the image under consideration.
All the processes were implemented by using R, a statistical language and programming environment (R Development Core Team Citation2005). Besides the R base package, the following libraries were used to develop the method: rgdal, sp, spatstats, maptools, ica, and e1071.
4. Results
(a) and (b) show the ISAs in 1990 and 2000 as predicted using the FIRME method and a random sample of 1000 pixels representing 0.27% of the study area. The correlation index between the predicted ISA images and the ground reference images, shown in (c) and (d), are 0.75 and 0.79, respectively. It is a good approximation to the real impervious surface, and minor misprediction problems are detected only after a careful visual assessment. As shows, SVM-based fuzzy segmentation overestimates impervious surface by 10 and 8%, respectively. also shows that the correlation index between the ISA change predicted by FIRME and the actual change is 0.51. The FIRME method overestimates ISA change by 12%.
Table 1. Comparison between fuzzy image regions method (FIRME) and direct regression method (DIRECT) for obtaining impervious surface areas
Figure 3. Impervious surface area (ISA) maps for the study area using (a) FIRME method 1990, (b) FIRME method 2000, (c) Reference data 1990, (d) Reference data 2000, (e) DIRECT method 1990, and (f) DIRECT method 2000.
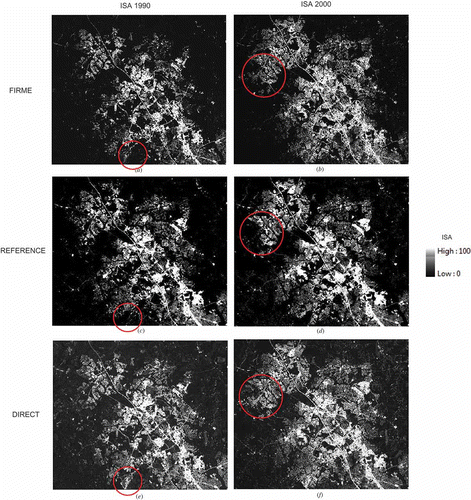
As this study is aimed at analysing the contribution of fuzzy image regions to increase the accuracy of the ISA estimation, a direct regression was tested. A direct regression uses the SVM technique for estimation of ISA values directly from the ICA components. In this option, the fuzzy segmentation and feature analysis stages are omitted, and the estimation relies only on the predictive power of SVM. (e) and (f) show the ISA maps obtained using direct regression method (DIRECT). In , a red-coloured circle at each ISA map highlights the zone of major misprediction. also presents the results obtained using the direct regression option. It is apparent that the FIRME method outperforms the DIRECT method.
To evaluate the sensitivity of the two methods, different training sample sizes were tested, starting from 500 pixels (0.13% of image size) to 4000 pixels (1% of image size) incrementing 500 pixels each time. shows the results of this experiment. It can be seen that the FIRME method is much more consistent than the DIRECT method.
Table 2. Influence of training sample size on impervious surface area (ISA) estimation using the FIRME and the DIRECT method
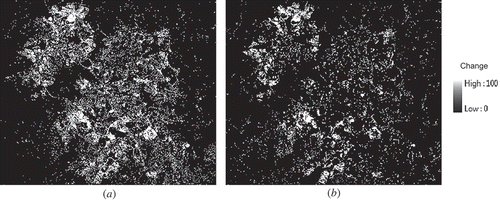
(a) shows the predicted change on ISA values from 1990 to 2000 using the FIRME method with training sample size of 1000 pixels. ISA change was calculated as the difference between ISA values in the two dates. (b) shows the urban development reference data (Jantz et al. Citation2005). shows that, using the proposed method, a general overestimation occurs over the whole study area. As shows, the FIRME method overestimates urban development surface by 12%.
Figure 4. Change in impervious surface area (ISA) values from 1990 to 2000: (a) as predicted using the FIRME method and (b) as represented in the ground reference data.
In order to understand with which land cover classes ISA estimates get confused, an additional accuracy test was conducted. For such a purpose, ISA values larger than 0.5 were labelled as urban land cover class. Then, the predicted urban class for the whole study area was compared with the MA-RESAC thematic maps. shows commission errors between urban and other land cover classes.
Table 3. Confusion between urban land cover predicted by the FIRME method and urban land cover reference data
The degree of agreement between the ISA values predicted and the ground reference data covering the study area may be considered as acceptable for preliminary studies. The proposed method may be used as a rapid means for quantitative classification and change estimation. However, additional refining of results using ground data may be necessary to resolve eventual inaccuracies.
The method can be extended easily to accommodate the estimation of other land cover surface areas as needed in a particular study. Although the implementation reported in this letter uses an automated SVM procedure, the method can be modified for any machine learning technique. The main advantages of the method are its simplicity and transferability. However, it is important to note that its performance is highly dependent on
| • | ensuring radiometric normalization of the input images; | ||||
| • | performing accurate image co-registration; and | ||||
| • | collecting reliable samples of land cover class and composition. | ||||
5. Conclusions
This letter proposed a method for quantitative land cover mapping using fuzzy image segmentation. Experimental results show that SVM-based fuzzy image regions provide more accurate estimation of ISAs than a direct SVM regression method. Although the implementation tested in this study used an SVM technique that offers acceptable accuracy, it may be computationally expensive for processing large datasets. In further experiments, other regression techniques could be tested to evaluate their performance in terms of both accuracy and computational cost. Walton (Citation2008), for example, suggested that, in terms of execution time, regression using random forests or classification and regression trees is superior to SVM. Although the method proposed in this letter is highly dependent on accurate training samples, it is simple to use and may be used to obtain reliable estimates of ISAs. This study suggests that fuzzy segmentation is a useful framework for urban land cover analysis.
Acknowledgements
The author thanks Dr Scott Goetz at the Woods Hole Research Center (USA) for providing the ISA and MA-RESAC datasets. The work reported here is part of research partially funded by a Birkbeck International Research Studentship. The author thanks three anonymous referees for their valuable comments to improve the quality of this article.
References
- Clapham , W.B. 2005 . Quantitative classification as a tool to show change in an urbanizing watershed . International Journal of Remote Sensing , 26 : 4923 – 4939 .
- Fisher , P. 1997 . The pixel: a snare and a delusion . International Journal of Remote Sensing , 18 : 679 – 685 .
- Foody , G.M. and Mathur , A. 2004 . A relative evaluation of multiclass image classification by support vector machines . IEEE Transactions on Geoscience and Remote Sensing , 42 : 1336 – 1343 .
- Goetz , S.J. and Jantz , P. 2006 . Satellite maps show Chesapeake Bay urban development . EOS Transactions American Geophysical Union , 87 : 149 – 156 .
- Hyvarinen , A. , Karhunen , J. and Oja , E. 2001 . Independent Component Analysis , New York : Wiley Interscience .
- Jantz , P. , Goetz , S. and Jantz , C. 2005 . Urbanization and the loss of resource lands in the Chesapeake Bay watershed . Environmental Management , 36 : 808 – 825 .
- Jensen , J. 2005 . Introductory Image Processing: a Remote Sensing Perspective , Upper Saddle River : Prentice Hall .
- Lizarazo , I. 2008 . SVM-based segmentation and classification of remotely sensed data . International Journal of Remote Sensing , 29 : 7277 – 7283 .
- Lizarazo , I. and Elsner , P. Fuzzy regions for handling uncertainty in remote sensing image segmentation . Proceedings of the International Conference on Computational Science and Applications (ICCSA 2008) . July 2008 . pp. 724 – 739 . Berlin : Springer .
- Lizarazo , I. and Elsner , P. 2009 . Fuzzy segmentation for object-based image classification . International Journal of Remote Sensing , 30 : 1643 – 1649 .
- Pal , M. 2006 . Support vector machine-based feature selection for land cover classification: a case study with DAIS hyperspectral data . International Journal of Remote Sensing , 27 : 2877 – 2894 .
- R Development Core Team . 2005 . R: A Language and Environment for Statistical Computing , Vienna, , Austria : R Foundation for Statistical Computing . ISBN 3–900051-07-0
- Walton , J.T. 2008 . Subpixel urban land cover estimation: comparing cubist, random forests, and support vector regression . Photogrammetric Engineering & Remote Sensing , 74 : 1213 – 1222 .