Abstract
The Spanish surface fishery operates mainly during the summer season in the waters of the Bay of Biscay. Sea surface temperature (SST) data recovered from satellite images are being used to improve the operational efficiency of fishing vessels (e.g. reduce search time and increase catch rate) and to improve the understanding of the variations in catch distribution and rate needed to properly manage fisheries. The images used for retrieval of SST often present gaps due to the existence of clouds or satellite malfunction periods. The data gaps can totally or partially affect the area of interest. Within this study, an application of a technique for the reconstruction of missing data called DINEOF (data interpolating empirical orthogonal functions) is analysed, with the aim of testing its applicability in operational SST retrieval during summer months. In this case study, the Bay of Biscay is used as the target area. Three months of SST Moderate Resolution Imaging Spectroradiometer (MODIS) images, ranging from 1 May 2006 to 31 July 2006, were used. The main objective of this work is to test the overall performance of this technique, under potential operational use for the support of the fleet during the summer fishing season. The study is designed to analyse the sensitivity of the results of this technique to several details of the methodology used in the reconstruction of SST, such as the number of empirical orthogonal functions (EOFs) retained, the handling of the seasonal cycle or the length (number of images) of the SST database used. The results are tested against independent SST data from International Comprehensive Ocean–Atmosphere Data Set (ICOADS) ship reports and standing buoys and estimations of the error of the reconstructed SST fields are given.
Conclusions show that over this area three months of data are enough for efficient SST reconstruction, which yields four EOFs as the optimal number needed for this case study. An extended EOF experiment with SST and SST with a lag of one day was carried out to analyse whether the autocorrelation of the SST data allows better performance in the SST reconstruction, although the experiment did not improve the results. The validation studies show that the reconstructed SSTs can be trusted, even when the amount of missing data is very high. The mean absolute deviation maps show that the error is greatest near to the coast and mainly in the upwelling areas close to the French and north-western Spanish coasts.
1. Introduction
Satellite images are commonly used in oceanography (Borzelli and Ligi Citation1999, Hu and Muller-Karger Citation2007) and fisheries (Zainuddin et al. Citation2006) due to the fact that they are characterized by extensive coverage, in time and space. Thermal infrared (TIR) and ocean colour remote sensing data with horizontal resolution ranging from 1.1 to 4.0 km are being used as the primary data source in decision-making systems for fisheries management, commercial and recreational fishing advisory services, fisheries research (Roffer et al. Citation2006), environmental monitoring, oil and gas operations and ship routing. In this work, the feasibility of the operational use of a technique called ‘data interpolating empirical orthogonal functions’ (DINEOF) to improve the remote sensing operational system is analysed. The main objective is to test whether reliable sea surface temperature (SST) reconstructions can be made available to fishing vessels during summer. This case study is limited to summer months, the period during which most of the fishing vessels operate in the Bay of Biscay (Santiago Citation2004). The use of passive sensors implies a problem for the retrieval of SST fields. These receptors are working in the visible and infrared ranges of the electromagnetic spectrum and the clouds present in the atmosphere can totally or partially cover the studied area. The amount of available images is also reduced due to malfunctions in the satellite. The loss of data due to these causes (particularly clouds) can reach a high percentage in some periods. For instance, in the period analysed in this study, some days show percentages of missing data higher than 95% of the ocean domain. In this work, an empirical orthogonal function (EOF)-based method is used to reconstruct existing missing values in SST satellite-derived data. Beckers and Rixen (Citation2003) and Alvera-Azcárate et al. (Citation2005) described a technique for filling missing data using the EOF-based algorithm called DINEOF, and they applied it to SST data over the Adriatic Sea. Here an application of the method developed by Beckers and Rixen (Citation2003) is presented. The advantage of using DINEOF compared to other methods, such as optimum interpolation (OI), a usual technique in the reconstruction of multivariate data, is that DINEOF calculates the information necessary for the reconstruction internally, based on available data. Therefore, there is no subjective parameter estimation (Beckers et al. Citation2006, Alvera-Azcárate et al. Citation2007). DINEOF is also computationally cheaper than OI (Alvera-Azcárate et al. Citation2005). Other traditional interpolation methods, such as nearest-neighbour or bilinear resampling, do not take full advantage of the spatial information in the image (Rossi et al. Citation1994). Other authors (Jiang et al. Citation2007) examined the effect of reconstruction of remotely sensed images using three geostatistical approaches, ordinary kriging, universal kriging, and indicator kriging using the undersampled data of the normalized difference vegetation index (NDVI) from National Oceanic & Atmospheric Administration (NOAA)/Advanced Very High Resolution Radiometer (AVHRR) images.
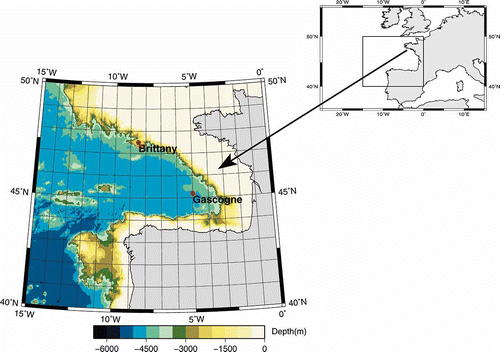
The study of the sensitivity of the SST reconstruction to several details of the methodology, such as the way the seasonal cycle is removed, the number of images stored in the database or the number of EOFs used in the reconstruction, is the main objective of this paper. The study area is an embayment within the eastern North Atlantic Ocean: the Bay of Biscay (). Its northern limit is 48° N, located approximately at the junction between the Celtic and the Armorican shelves. The area is bounded to the south by 43° N, which coincides between 1° W and 9° W with the northern Iberian Peninsula. The eastern limit is the western French margin, whilst the western limit is 11° W. The orientation of the coast is south–north along the eastern limit of the ocean (French coast), and it is west–east at the southern limit (Spanish coast). In addition to the orientation, the French and the Spanish shelves have another relevant difference – the shelf width.
Figure 1. The black square indicates the location of the study area. This area is an embayment within the eastern North Atlantic Ocean, which is represented in the bathymetry map of the Bay of Biscay with the buoys used in this work shown as red dots.
The Spanish shelf (Cantabrian Shelf) is narrow, being approximately 30–40 km wide. However, in some places it reaches only 12 km. In contrast, the French shelf is wider and broadens with latitude; it is divided into two shelves, the Aquitanian Shelf located in the south and the Armorican Shelf in its northern part. The French shelf, with a slight slope of 0.12%, has a width of between 50 and 150 km, in the Aquitanian part. Conversely, it is approximately 180 km in the Armorican part. The large-scale oceanic circulation within the Bay of Biscay is driven by the North Atlantic Current (NAC), a branch of the Gulf Stream. The study area is located in an inter-gyre region, between a sub-polar gyre (cyclonic) and a sub-tropical gyre (anticyclonic). Therefore, the circulation in the study area is weak (Caballero Citation2008). During the summer months, the south-eastern part of the Bay of Biscay shows higher SSTs due to atmosphere–ocean interaction (like radiation and heat fluxes) and the weak circulation over the area (Usabiaga et al. Citation2004).
2. Dataset
The data chosen for this purpose are SST fields derived from Moderate Resolution Imaging Spectroradiometer (MODIS) images covering the entire Bay of Biscay (40° N 50° N, 15° W 0° E) during a three-month period, 1 May to 31 July 2006. The SST images from the MODIS level 2 MOD28L2 product, with quality flag 0, were obtained from the National Aeronautics & Space Administration (NASA) Ocean Color WEB server. The daytime and night-time images in 11 μm were averaged to get one image per day and projected to an equidistant cylindrical projection, with the result of a set of 92 images (one per day). They were used in this work to test the accuracy of the images reconstructed by means of the DINEOF method. Their dimensions are 600 × 900 pixels, with a resolution of 1.00 km. The study area is slightly greater than the Bay of Biscay and covers the latitude range from 50° N to 40° N and longitude range from 15° W to 0° E. Land points are not used in this method so the final spatial dimension of the data is 157 088 pixels (out of the 540 000 pixels in the rectangular image). Some of these 92 images present extreme cloud coverage. Images containing less than 5% data do not provide useful information and might affect the quality of the reconstruction (Alvera-Azcárate et al. Citation2005). Therefore, a subset of 77 images was used. These images do not correspond to consecutive days but all have less than 95% cloud coverage. When the extended EOF analysis (Weare and Nasstrom Citation1982) of SST and lagged SST was performed, 66 lagged (compound) images were used, since consecutive days must be used in the creation of the lagged extended matrix. shows the percentage of cloud coverage in the images used in this study.
Table 1. Percentage of cloud coverage of the 92 daily images (three months) and percentage of cloud coverage remaining after removing the images with cloud coverage higher than 95%
For verification purposes of the reconstructed SST data with independent information, time-series of the Brittany (47° 30′ 0″ N 8° 30′ 0″ W) and Gascogne (45° 12′ 2″ N 5° 0′ 0″ W) buoys (see ) were also used, as they show an almost complete coverage of SST data during the study period, with a low percentage of missing data. Additionally, International Comprehensive Ocean–Atmosphere Data Set (ICOADS) individual ship reports corresponding to the area and period were also used (Worley et al. Citation2005).
3. Methodology
3.1 Introduction to DINEOF
DINEOF is a self-consistent method for the reconstruction of missing data in oceanographic datasets (Beckers and Rixen Citation2003). This method is based on the fact that an optimal number of EOFs, usually very small if compared to the total number of EOFs, retains a large fraction of the total variance of the whole dataset. The DINEOF method fills the missing data by means of an iterative process. Initially, the leading EOF is computed, after substituting zero-valued anomalies at the missing values. The leading EOF is used to estimate the anomalies at the missing points. The process is iterated until convergence in the anomalies at the missing values is achieved from one iteration to the next within a prescribed tolerance level. Once the convergence is reached, the number of computed EOFs increases, from 1 to 2 and next to k max EOFs. So, at the end, there is an estimate for the missing data reconstructed after convergence is achieved with a reconstruction computed using 1, 2, …, k max EOFs. The optimum number of EOFs to be used in the reconstructions is defined by means of the cross-validation technique (Wilks Citation1995). In this study, 3% of good data (294 882 points) are set aside from the reduced dataset to be compared later with the reconstructed data as this fraction has already been evaluated as a good compromise (Alvera-Azcárate et al. Citation2005). The optimal number of EOFs is the one that minimizes the error between the dataset maintained aside and the values obtained at these points with the reconstruction method. Once the optimal number k max of EOFs is known, the whole procedure is repeated again, this time including the dataset kept aside for cross-validation, but considering only the k max leading EOFs considered as optimal. Final values for the missing data are then computed. In this application, the EOF decomposition is performed by means of a Lanczos iterative eigensolver (Toumazou and Cretaux Citation2001), which allows optimal CPU use for the computation of EOFs in large matrices, since only the leading singular vectors must be computed. This method was successfully applied to Adriatic SST images by Alvera-Azcárate et al. (Citation2005). The DINEOF method is already implemented in Fortran and freely available (http://modb.oce.ulg.ac.be/mediawiki/index.php/DINEOF) and the advantages of using a Lanczos eigensolver have already been shown by Alvera-Azcárate et al. (Citation2005).
3.2 Scaling of EOFs for graphical representation
In general, EOFs (spatial loading factors) are obtained from the singular value decomposition of the data matrix as a set of orthonormal column vectors:
3.3 Analysis of the sensitivity of the reconstruction
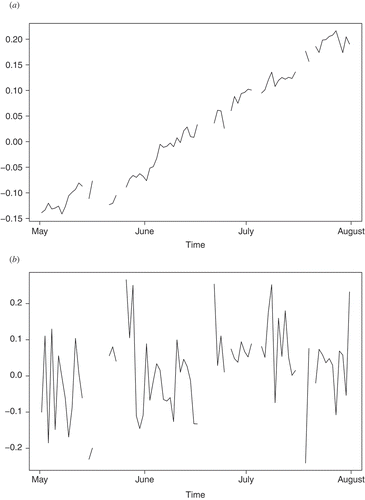
The main objective of this study is to test the sensitivity of the method to several choices, which can be done during the design of an operational method of SST reconstruction based on DINEOF. The first question to consider is the way the seasonal cycle is handled. As the EOF computation assumes that the mean has already been removed from the dataset, as an initial step anomalies of SST data are computed. The EOFs tend to isolate common patterns of variability in the data. Over the study area, the most obvious one during the period covered by this research (May–July 2006) is the seasonal cycle of SST (), characterized by a common increment of temperature over every pixel during the onset of summer high SSTs. A test of the sensitivity of the results to the way the seasonal cycle is removed was carried out by testing the results of two different processing strategies. The first one removes at each time step the mean of all the pixels. It is a poor-man's removal of the seasonal cycle on a daily basis, but it is interesting in the sense that it removes the common variability of the whole dataset and it can be applied in a short record like the one that can be used in operational use of the DINEOF technique, as the one that is analysed in this paper. A second strategy does not consider the problem posed by the seasonal cycle and incorporates that variability in the determination of the EOFs. To that end, the mean of the whole period at each pixel is removed, without further detrending of every pixel. This latter approach implies that the variability included in the seasonal evolution gets incorporated in the EOF structure used in the reconstruction. A significance test (Siegel and Castellan Citation1988) was used to test whether the trend exists in the computed leading PC, the one most affected by the seasonal evolution of the SSTs.
Figure 2. The leading adimensional PC of (a) SST and (b) SST anomalies. Gaps reflect the existence of images with cloud cover higher than 95%.
A second interesting question is the length of the database needed for an optimum operational system. This question is addressed in this study by performing the DINEOF-based reconstruction using a varying number of 15, 20, 25, 50, 55, 60, 65, 70, 75 and 77 SST fields, all of them with cloud cover lower than 95%. The verification statistics and the number of optimal EOFs are computed for these varying lengths of the dataset used in the reconstruction and when the error of the reconstruction achieves a saturation with respect to the number of images in the database, this indicates the minimum length that should be used in the development of a DINEOF-based operational system of SST reconstruction.
3.4 The extended EOFs technique
The extended EOFs (ExEOFs) technique (Alvera-Azcárate et al. Citation2007) consists of an alternate Weare and Nasstrom (Citation1982) and Kim and Wu (Citation1999) form of the classical EOF analysis in which lagged versions of one dataset are used simultaneously to perform EOF analysis of an extended data matrix. The intention of the use of an ExEOF method in this study is to check whether a given missing pixel at the SST field of one variable (at, say t time) could benefit from the presence of valid SST information at a previous time (t – 1). This can be expected, since the decorrelation time-scale of cloud cover is lower than the decorrelation time-scale of SST anomalies, particularly during the summer season. When the SST variable (in time t) is combined with a lagged version of itself (in time t – 1), only 66 images (actually, compound or lagged images) keep the condition that the missing values are lower than the 95% of the whole image pixels.
3.5 Evaluation of reconstruction skill
Finally, in order to obtain a measure of the accuracy of the reconstructed fields, two parameters were used as a measure of the error. The first one is the well-known root mean square error (RMSE). As RMSE can be very sensitive to outliers in the sample, the mean absolute deviation (MAD) was also used. Those two error estimates were computed, using all the original SST measurements (with missing values) and the corresponding SST estimations after the reconstruction. These forms of expression of the error have the advantage that they retain the units of the variable and are thus easily interpretable as typical error magnitude (Wilks Citation1995). Aggregated values of RMSE and MAD were used for the computation of the overall accuracy of each reconstruction, but spatial maps of RMSE and MAD were also used to visualize the spatial distribution of the error fields.
Reconstructed SST data were also compared with in-situ data from ICOADS ship reports. In this case, RMSE and MAD were also used as the measure of the error. The comparison of the satellite-derived SST and in-situ SST data was performed comparing the in-situ data with the closest (in the spatial grid point and in time) reconstructed SST value. The association between two variables (time-series of SST data from buoys and nearest pixel's SST time-series data from SST reconstructions) was quantified by means of the Pearson correlation coefficient (r) and the p-value (p). In order to remove the spurious predictability inherent to the trend associated with the evolving seasonal cycle and compute the real ability of the DINEOF technique to derive valid SST anomalies, the correlation coefficient was computed after removing the linear trend of both series with a simple linear regression (Wilks Citation1995).
In order to isolate the sensitivity of the SST reconstruction to the different possibilities explained above, which have influence on the performance of a potential operational system, several experiments were performed. The first experiment was conducted to test the influence of the removal of the trend of the data in the reconstruction. The second one is based only in SST data and designed to search the number of images necessary to obtain a minimal RMSE in the cross-validation and a stable number of EOFs, as needed for the reconstruction of SSTs anomalies. The next experiment was performed after selecting the minimum number of images which allow a stabilization of the RMSE and a stable number of EOFs. It was orientated to the reconstruction of the SST values of the three-month period. This time, the final aim was the comparison with real data from independent sources (buoys and ICOADS reports), which allowed an estimation of the overall error of the reconstruction. Finally, the last experiment, based on the ExEOF technique, made use of SST and lagged SST and was intended to check whether the reconstruction of SSTs at day d can benefit from the presence of a lagged version of itself at time d – 1.
4. Results
shows that unless the removal of the trend is performed as a pre-processing step, the leading PC is trendy ((a)), which is much flatter when the anomalies of SST are used ((b)).
shows that the removal of the trend in the original data yields a lower slope in the leading PC of the reconstruction. This simple method of removal of the seasonal cycle is not able to completely eliminate the trend in the leading PC. However, the resulting time-series are less non-stationary than the ones derived from the use of raw SST data. Therefore, the basic hypothesis of stochastic processes (stationarity) is better (though not completely) fulfilled for the trend-removed anomalies case. This latter case (trend-removed anomalies) is the one selected for further analysis, since RMSE is similar for both cases.
Table 2. Results of the study concerning the trend in the leading PC
4.1 Sensitivity of the results
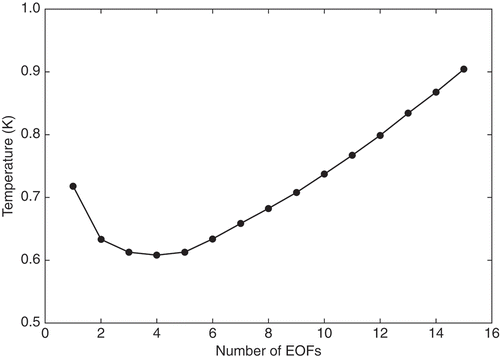
Regarding the sensitivity of the results to the length of the database (number of SST images) used to perform the reconstruction, the results are very clear. shows that with a length of the database lower than 35 days (each daily image is the average of the day and the night images), it is not possible to reliable identify with precision more than 1 EOF. The error is high (cross-validation RMSE > 0.8). The error decreases if the number of images used for the reconstruction is higher. Between 35 and 60 images in the database, 3 EOFs can be isolated and the error level falls notably (cross-validation RMSE 0.6). Databases longer than 60 days detect 4 EOFs but the RMSE computed by means of cross-validation does not fall significantly. Results show a saturation of the RMSE values above 35 days. According to this result, for subsequent reconstructions, the whole dataset of images is used.
Figure 3. RMSE obtained with cross-validation for reconstructions using different number of days in the database and diverse number of EOFs.
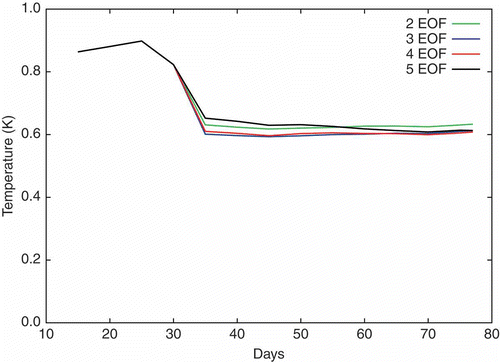
presents the comparisons of the errors computed from the reconstructed SST when composed with the original data, as obtained from satellite observations. The errors are computed from two experiments (SST anomalies, and SST anomalies + lagged SST anomalies, also referred to as the ExEOF experiment). The first experiment uses only SST anomalies (77 images). The errors calculated using the RMSE, MAD and cross-validation show that the best reconstruction is achieved using four EOFs (RMSE = 0.4658 K, MAD = 0.3281 K, Cross-validation = 0.6082 K).
Table 3. Explained variance (%), RMSE (K) and the mean absolute deviation (MAD, K) between reconstructed data and original data and RMSE derived by means of the cross-validation techniques (Cross), in two experiments: (1) SST anomaly; (2) extended EOFs of SST anomalies with lag –1
shows by means of the RMSE from cross-validation that 4 is the number of EOFs to be used. The second experiment was performed using 66 images of SST anomalies plus 66 images of lagged SST anomalies (ExEOF experiment). The best reconstruction is achieved using four EOFs (RMSE = 0.4854 K, MAD = 0.3477 K, cross-validation = 0.6567 K). These results are interesting since the error values indicate that the use of lagged values of SST does not imply better reconstructions, despite the higher computational burden. This means that their use is not justified from an operational point of view.
Figure 4. Error obtained with cross-validation for reconstruction of the complete set.
(left panels) shows the spatial structure of the MAD computed from the reconstructions using up to (a) the first, (b) the second, (c) the third and (d) the fourth leading EOFs. The right column shows the spatial structure of the corresponding EOFs. They are obtained from the experiment finally selected as the best performing one (detrended SST anomalies, no lag, 77 images and truncation at four EOFs). The MAD of the reconstruction performed up to the first EOF ((a) left) shows the highest values of MAD over the closed part of the ocean basin, particularly close to the coastal regions. The structure of the leading EOF is shown as temperature anomalies with contours of bathymetry superimposed. The loading factors corresponding to this EOF show that the highest values of the anomaly correspond to the western part of the domain. There is a slightly bipolar structure, with weak positive anomalies over the central and south-eastern part of the domain and negative anomalies over the southern and northern parts of the western half of the domain. The reconstruction including up to the second EOF ((b)) shows smaller values of MAD (left column). The improvement in the reconstruction is particularly evident over the upwelling areas close to the western part of the Portuguese coast and over the south-eastern closed part of the Bay of Biscay (near to the French and Spanish border). The second EOF shows a very localized structure, with high anomalies over two parts of the ocean shelf (Aquitanian tip of the continental shelf and the shelves in front of the Portuguese coast). (c) shows that the use of the third EOF is especially noticeable in the reduction of the MAD over the central part of the domain. This is coincident with the structure of the corresponding EOF ((c), right panel).
Figure 5. Mean absolute deviation (MAD) of reconstructed versus observed SST (K, left). Spatial structure of the EOFs. (a)–(d) First to fourth EOFs, which are shown scaled as SST anomalies (K units).
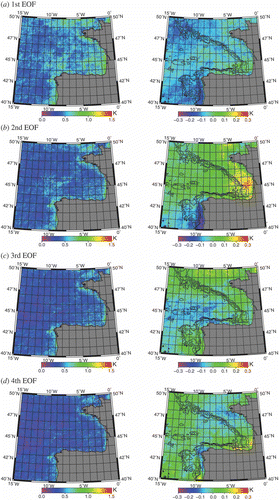
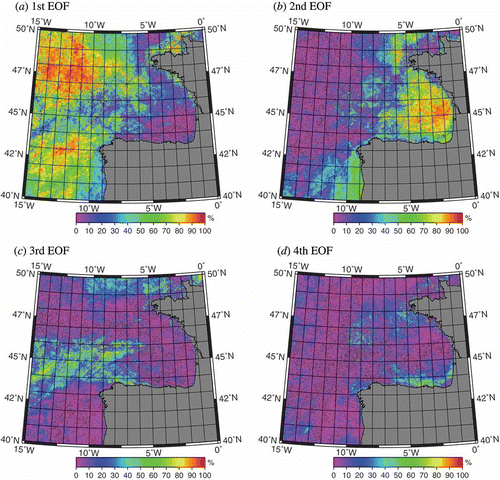
Finally, (d) shows that the spatial extent of the fourth EOF is extremely localized, corresponding particularly to areas where upwelling or other coastal processes might exist, but the anomalies are much closer to the coast than for the second EOF. explains in a more succinct way the relevance of the EOFs in the expansion of the reconstructed anomalies. In this figure, the spatial structure of the EOFs is shown in terms of the fraction of the variance of the reconstructed series explained at each point by each of the EOFs. Measured in terms of fraction of reconstructed variance, the contribution of EOF1 is particularly relevant ((a)) for the areas at open sea, with minor contribution at the closed part of the Bay of Biscay and with a nodal line more or less placed at 45° N. The second EOF ((b)) is important when explaining variance of the closed eastern part of the basin, with a contribution in the upwelling zone close to Portugal. The third EOF ((c)) explains relevant fractions of variance over the nodal line, which was not explained by EOF1, at the western part of the domain. Finally, the contribution of EOF4 ((d)) is relatively minor, and is restricted to the coastal areas over the northern Spanish coast.
Figure 6. Percentage of reconstructed variance explained by each of the EOFs, computed with respect to the reconstructed variance at each point: (a)–(d) first to fourth EOFs.
4.2 Comparison of reconstructed data with original data
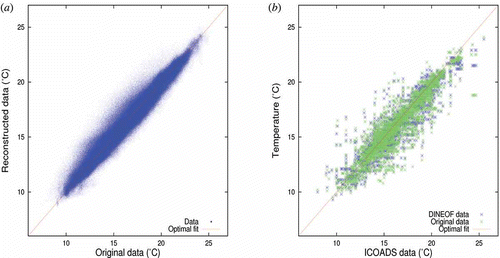
shows as a scatter plot the relationship of reconstructed and observed SST data ((a)) and reconstructed satellite-derived SST data and in-situ SST measures from ICOADS reports ((b)). The behaviour of the scatter plot does not suggest any particular pathology, neither for the central values of the SST distribution nor for the values corresponding to the tails of the distribution of the data. The comparison with ICOADS data shows a slightly higher error, as could be expected from the skin-bulk effect (Minnett Citation2003, Crosman and Horel Citation2009). In the comparison with ICOADS data, 24 580 points are used to compare the ICOADS data with the SST data from the DINEOF reconstruction, yielding an RMSE of 0.906 K and a MAD of 0.678 K, with a correlation coefficient, after removing the linear trend, of r = 0.86 (p < 0.01). In order to consider the effects of the reconstruction on the difference with in-situ observations, 6027 points of the original SST set are compared with the ICOADS observations. This comparison yields an RMSE of 0.966 K and a MAD of 0.638 K, with a correlation coefficient, after removing the linear trend, of r = 0.930 (p < 0.01). Similarly, the reconstruction by means of DINEOF at the same points shows an RMSE of 0.789 K and a MAD of 0.611 K, with a correlation coefficient, after removing the linear trend, of r = 0.943 (p < 0.01) when compared to the same set of in-situ observations. It has to be considered that in the verification against the in-situ ICOADS reports, the error is wider because it not only considers the errors derived from the reconstruction itself, but from the different behaviour of in-situ and remote sensors, and the asynoptic character of the in-situ measurements and the remote ones. The structure of the scatter plot suggests a slight under-prediction of the highest SST values obtained from the ship reports, which are slightly lower than the ones predicted by the DINEOF-based system. However, when the original satellite data are composed with ship reports ((b)), it can be seen that the under-prediction is higher on the original data. This means that DINEOF is actually correcting the original error.
Figure 7. Comparison of (a) reconstructed data with original data and (b) reconstructed and original data with in-situ data from ship reports in ICOADS. The thin red line represents the fit corresponding to a perfect model (line y = x).
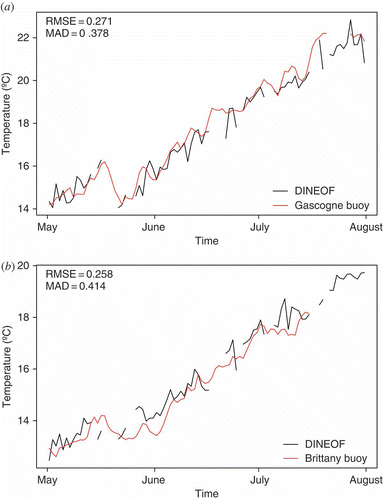
As a last step in the verification of the reconstruction, two time-series from two buoys operated by the MetOffice are used. In the Brittany buoy, the RMSE is 0.258 K, MAD is 0.414 K and Pearson's correlation coefficient, after removing the linear trend, is r = 0.62 (p < 0.01). In the case of the Gascogne buoy, the RMSE is 0.271 K and MAD is 0.378 K, while the correlation coefficient after the removal of the linear trend is r = 0.65 (p < 0.01). shows the time-series corresponding to the buoys (Gascogne, (a) and Brittany, (b)) and the SST time-series of the closest pixel, according to the reconstruction by DINEOF. There was no filtering of low-wind days in the comparison of data from the buoys with SST images.
Figure 8. Comparison of the time-series from reconstructed SST with the time-series from MetOffice buoys: (a) Gascogne buoy; (b) Brittany buoy.
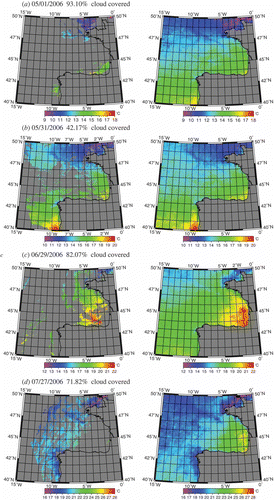
Finally, (a)–(d) shows different examples of reconstructions of SST data (right column) and the original images with missing values corresponding to cloudy conditions (left column). The selected days cover different ranges of missing percentages, from 7% to 58% of valid data in each image. It is clear that the reconstruction yields realistic SST values even for the highest percentages of cloud cover (93% to 72% in the examples shown).
Figure 9. Different examples (dates and cloud-cover percentage) of original SST (left column) and corresponding DINEOF reconstructions (right column).
5. Discussion
The results shown in this study indicate that DINEOF can be the basis of a good system for operational use by fishing vessels. The method is robust, simple to use, the code is freely available and does not need any a priori information about the error statistics of the data. The results obtained were analysed, giving an example of their reliability and usefulness. Furthermore, the time and computational resources needed for this case study are not very high. The computations could be carried out in a commodity desktop PC, and the full determination of the reconstruction of SSTs for this realistic case takes about 15 minutes on a desktop PC with an Intel Core 2 duo Processor with 8Gb of RAM using a PGI compiler (Portland Group Compiler) and freely available linear algebra routines. The RMSE, as derived by cross-validation, decreased when the number of images increased. The comparison of the reconstructed fields with the original one reveals that the error is quite small, about 0.6°C when using a database of 60 days. The use of extended EOFs using SST with a time lag of one day does not improve the results and it requires significantly more computational resources, which means that over this area and season, the information provided by the persistence of SST is not relevant. This conclusion could be different during other seasons of the year (i.e. winter) or for other lags of the images used in the ExEOF experiments.
Using three months of images and removing the images with cloud cover greater than 95% of the pixels in the image are enough for a system dedicated to operational use, and it yields reconstructed images with high quality. There is a problem with the use of DINEOF for the reconstruction of SST images when the satellite does not yield enough correct pixels to pass the 95% threshold previously mentioned. In this case, it is still possible to yield a reconstruction, but the error of the reconstruction will be higher due to the scarcity of data. The use of extended EOFs (Kondrashov and Ghil Citation2006, Alvera-Azcárate et al. Citation2007) can help in the development of a complete dataset. The spatial error maps show that the error decreases when an increasing number of EOFs is used until saturation is achieved with only four EOFs in this case study. The MAD maps show that the error is greater near the coast, particularly in the upwelling zones close to the French coast and north-western Spain and Portugal. Therefore, this method must be complemented with other ones for areas very close to the coast. The comparison of the reconstructed SSTs with independent in-situ data (ship reports from the ICOADS database) reveals RMSE and MAD errors of similar magnitude. RMSE is 0.906 K and MAD = 0.678 K, respectively, considering the 24 580 points existing in the ICOADS database during the study period and for the full study area. Data from buoys reveal smaller errors. In the Brittany buoy, RMSE is 0.258 K and MAD = 0.414 K, while in the Gascogne buoy RMSE is 0.271 K and MAD = 0.378 K. When visually checking the reconstruction results, we can see that the main physical features are recovered in the final result, such us the upwelling zones close to the French and north-western Spanish and Portuguese coasts, and the cold filament generated in the French shelf, or the warm pool of water between the French coast and the Spanish coast, typical of summer conditions over the area. Therefore, the reconstructed data can also be used to analyse the variability of temperature according to different forcing factors like the atmosphere–ocean coupling or internal processes.
Acknowledgements
The authors thank the EKLIMAXXI project (Basque Government, Department of Industry and Basque Meteorological Service-Euskalmet, Project ETORTEK07/01 - IE07-190) and National R+D+i Plan (CGL2008-03321/CLI) for financial support. The help given by AZTI's remote sensing group (Marine Research Division) is also acknowledged, in particular thanks go to Yolanda Sagarminaga and Imanol Rivas. The SGI/IZO-SGIker UPV/EHU (supported by the Development and Innovation - Fondo Social Europeo, MCyT and Basque Government) is gratefully acknowledged for generous allocation of computational resources. The National Fund for Scientific Research, Belgium, is acknowledged for funding the position of A. Alvera-Azcárate. Finally, the authors are very grateful to two anonymous reviewers for helpful comments.
Related Research Data
References
- Alvera-Azcárate , A. , Barth , A. , Beckers , J. and Weisberg , R. 2007 . Multivariate reconstruction of missing data in sea surface temperature, chlorophyll, and wind satellite fields . Journal Geophysical Research [Oceans] , 112 : C03008
- Alvera-Azcárate , A. , Barth , A. , Rixen , M. and Beckers , J. 2005 . Reconstruction of incomplete oceanographic data sets using empirical orthogonal functions: application to the Adriatic Sea surface temperature . Ocean Modelling , 9 : 325 – 346 .
- Beckers , J. , Barth , A. and Alvera-Azcárate , A. 2006 . DINEOF reconstruction of clouded images including error maps. Application to the Sea Surface Temperature around Corsican Island . Ocean Science , 2 : 183 – 199 .
- Beckers , J. and Rixen , M. 2003 . EOF calculations and data filling from incomplete oceanographic datasets . Journal of Atmospheric and Oceanic Technology , 20 : 1839 – 1856 .
- Borzelli , G. and Ligi , R. 1999 . Autocorrelation scales of the SST distribution and water masses stratification in the Channel of Sicily . Journal of Atmospheric and Oceanic Technology , 16 : 776 – 781 .
- Caballero , A. 2008 . “ Ocean surface circulation within the Bay of Biscay, on the basis of remote sensing data ” . PhD thesis, Polytechnic University of Catalunya .
- Crosman , E.T. and Horel , J.D. 2009 . MODIS-derived surface temperature of the Great Salt Lake . Remote Sensing of the Environment , 113 : 73 – 81 .
- Hu , C. and Muller-Karger , F. 2007 . Response of sea surface properties to Hurricane Dennis in the eastern Gulf of Mexico . Geophysical Research Letters , 34 : L07606
- Jiang , X. , Wani , L. , Du , Q. and Hu , B. Kriging-based technique for remote sensing image restoration . Proceedings of the IAMG ′07: Geomathematics and GIS Analysis of Resources, Environment and Hazards . 2007 , Beijing, China. Edited by: Zhao , P. , Agterberg , F. and Cheng , Q. 26–31 August . pp. 429 – 433 .
- Kim , K. and Wu , Q. 1999 . A comparison study of EOF techniques: Analysis of nonstationary data with periodic statistics . Journal of Climate , 12 : 185 – 199 .
- Kondrashov , D. and Ghil , M. 2006 . Spatio-temporal filling of missing points in geophysical data sets . Nonlinear Processes in Geophysics , 13 : 151 – 159 .
- Minnett , P.J. 2003 . Radiometric measurements of the sea-surface skin temperature: the competing roles of the diurnal thermocline and the cool skin . International Journal of Remote Sensing , 24 : 5033 – 5047 .
- Roffer , M. , Gawlikowski , G. , Muller-Karger , F. , Schaudt , K. , Upton , M. , Wall , C. and Westhaver , D. 2006 . Use of thermal infrared remote sensing data for fisheries, environmental monitoring, oil and gas exploration, and ship routing . American Geophysical Union, Fall Meeting 2006 , abstract H32D–07
- Rossi , R. , Dungan , J. and Beck , L. 1994 . Kriging in the shadows – geostatistical interpolation for remote-sensing . Remote Sensing of the Environment , 49 : 32 – 40 .
- Santiago , J. 2004 . “ Dinámica de la población de atún blanco (Thunnus alalunga, Bonaterre 1788) del Atlántico Norte ” . PhD thesis, Universidad del País Vasco .
- Siegel , S. and Castellan , N. 1988 . Nonparametric Statistics for the Behavioral Sciences , Vol. 2 , New York : McGraw-Hill .
- Toumazou , V. and Cretaux , J. 2001 . Using a Lanczos eigensolver in the computation of empirical orthogonal functions . Monthly Weather Review , 129 : 1243 – 1250 .
- Usabiaga , J.L. , Sáenz , J. , Valencia , V. and Borja , A. 2004 . Climate and Meteorology, in Oceanography and Marine Environment of the Basque Country. Oceanography Series , Vol. 70 , 616 Amsterdam : Elsevier .
- Weare , B. and Nasstrom , J. 1982 . Examples of extended empirical orthogonal function analyses . Monthly Weather Review , 110 : 481 – 485 .
- Wilks , D. 1995 . Statistical Methods in the Atmospheric Science , New York : Elsevier .
- Worley , S. , Woodruff , S. , Reynolds , R. , Lubker , S. and Lott , N. 2005 . ICOADS release 2.1 data and products . International Journal of Climatology , 25 : 823 – 842 .
- Zainuddin , M. , Kiyofuji , H. , Saitoh , K. and Saitoh , S. 2006 . Using multi-sensor satellite remote sensing and catch data to detect ocean hot spots for albacore (Thunnus alalunga) in the northwestern North Pacific . Deep Sea Research Part II , 53 : 419 – 431 .