Abstract
Given the close association between climate change and vegetation response, there is a pressing requirement to monitor the phenology of vegetation and understand further how its metrics vary over space and time. This article explores the use of the Envisat MERIS terrestrial chlorophyll index (MTCI) data set for monitoring vegetation phenology, via its estimates of chlorophyll content. The MTCI was used to construct the phenological profile of and extract key phenological event dates from woodland and grass/heath land in Southern England as these represented a range of chlorophyll contents and different phenological cycles. The period 2003–2008 was selected as this was known to be a period with temperature and phenological anomalies. Comparisons of the MTCI-derived phenology data were made with ground indicators and climatic proxy of phenology and with other vegetation indices: MERIS global vegetation index (MGVI), MODIS normalized difference vegetation index (NDVI) and MODIS enhanced vegetation index (EVI). Close correspondence between MTCI and canopy phenology as indicated by ground observations and climatic proxy was evident. Also observed was a difference between MTCI-derived phenological profile curves and key event dates (e.g. green-up, season length) and those derived from MERIS MGVI, MODIS NDVI and MODIS EVI. The research presented in this article supports the use of the Envisat MTCI for monitoring vegetation phenology, principally due to its sensitivity to canopy chlorophyll content, a vegetation property that is a useful proxy for the canopy physical and chemical alterations associated with phenological change.
1. Introduction
Vegetation productivity is coupled closely with interactions between the terrestrial biosphere and the climate system. Recent radiative (e.g. by atmospheric CO2) and non-radiative forcing (e.g. land cover change) of the climate system has led to a rise in the global mean temperature. Eleven of the 12 years between 1995 and 2006 were among the warmest years in the instrumental record of global surface temperatures since 1850 (IPCC Citation2007). This has implications for a range of vegetation properties and related dynamics (Nigh Citation2006) that in turn affect the climate through a variety of biophysical, biogeochemical and biogeographical pathways over a range of spatial and temporal scales (Zhou et al. Citation2001, Arora and Boer Citation2005). Accordingly, one aspect of vegetation dynamics that has received increasing attention recently is that of phenology, which refers to the timing of plant development phases, such as leaf onset, flowering, leaf senescence and leaf offset, so-called phenological events (Menzel and Fabian Citation1999, Morisette et al. Citation2009).
1.1 Vegetative phenological events
The timing of vegetative phenological events indicates the impact of both short- and long-term climatic changes on the terrestrial biosphere (Reed et al. Citation1994, Chuine and Beaubien Citation2001, Brügger et al. Citation2003). The timing of the onset and eventual loss (offset) of leaves regularly alters land-surface boundary conditions by changing surface albedo, roughness, and surface water and energy fluxes (Hogg et al. Citation2000, Wilson and Baldocchi Citation2000, Molod et al. Citation2003). Moreover, change to the associated length of the growing season and increase in primary productivity directly influences the amount of radiatively active gases (particularly CO2 and H2O) in the atmosphere (White et al. Citation1997, Schwartz Citation1999, Cleland et al. Citation2007, Richardson et al. Citation2010). An extension in the growing season leading to increased canopy longevity and carbon gain may provide an increased sink for atmospheric carbon (Lucht et al. Citation2002), conversely an extended growing season may contribute to warming due to a decrease in surface albedo (Betts Citation2000). Phenological events also have implications for competition between plant species and interactions with heterotrophic organisms. In addition to these direct effects, alteration in the timing of phenological events is implicit in ecosystem services to humans, such as the production of food, fibre and extractable chemical substances, as well as the seasonal suitability of landscapes for recreational activities (Badeck et al. Citation2004). More recently, links have been postulated between changing vegetation phenology and disease transmission (Barrios et al. Citation2010).
Contemporary climatic perturbations have been associated with recent changes to phenological event timing (Hovenden et al. Citation2008). At temperate and higher latitudes, air temperature is thought to be the principal limiting factor to vegetation growth, whereas in regions such as humid and dry ecosystems, it is rainfall (Chen et al. Citation2005, Zhang et al. Citation2010). In recent years much attention has focused on phenological event alteration as a result of temperature anomalies; Myneni et al. (Citation1997) observed that terrestrial vegetation between 45° and 70° N had ‘greened’ between 1981 and 1991, and Lucht et al. (Citation2002) confirmed a high northern latitude greening trend over the past two decades. Many others report that recent warming trends in the northern hemisphere (Europe, North America and China) are seen clearly in phenological time-series records with earlier spring and later autumn dates (Menzel Citation2000, Roetzer et al. Citation2000, Defila and Clot Citation2001, Parmesan and Yohe Citation2003, Root et al. Citation2003, Piao et al. Citation2004, Studer et al. Citation2005). In higher latitudes elevated spring temperatures have been shown to trigger both tree growth and early leafing (Sparks et al. Citation2005, Fisher et al. Citation2006) and growth in grasslands (White et al. Citation1997, Stöckli and Vidale Citation2004, Steinaker and Wilson Citation2008), whilst autumnal temperature variation influences the onset of senescence (Busetto et al. Citation2010). These resultant changes in phenological events may have implications for pollination and herbivory. However, given the mix of pollinator services and herbivorous activity, the exact impact of phenological event change on trees and their communities have proved difficult to predict (Fabina et al. Citation2010). Since the magnitude of change varies with species, location and investigation period (Walther et al. Citation2002, Chmielewski et al. Citation2004, Hovenden et al. Citation2008), a systematic and scientifically credible global monitoring programme of the state of the world's ecosystems is required (Millenium Ecosystem Assessment Citation2005, Morisette et al. Citation2009). Given the pivotal role of this aspect of vegetation dynamics, there is a pressing requirement to monitor the phenology of vegetation and understand further how its events vary over space and time.
1.2 Remote sensing of vegetation phenology
Satellite-based observations have been used in the study of seasonal vegetation dynamics for over 30 years (Reed et al. Citation1994, Reed Citation2006). Due to its temporal sampling and synoptic coverage, remote sensing has become increasingly important in studies of landscape-level phenological event changes (Badeck et al. Citation2004, Cleland et al. Citation2007, Studer et al. Citation2007, Reed et al. Citation2009) and this has become generally known as land surface phenology (de Beurs and Henbry Citation2004). The coupling of these satellite-based observations with conventional site- and species-specific ground observations and climate data-driven phenological models is desirable but often difficult to achieve (Badeck et al. Citation2004, Fontana et al. Citation2008, Ganguly et al. Citation2010). Accordingly, work to date has focused on constructing multi-temporal records of satellite sensor data (phenological profiles), extracting key phenological event information from these and relating these to climatic variations. A key challenge in the construction of these records is decoupling change in signals that are vegetation related from those that are unrelated, notably, arising perhaps from navigation uncertainties, calibration uncertainties, atmospheric effects, variations in the viewing and illumination geometry and variations in soil background (Piao et al. Citation2003).
The use of vegetation indices, such as the normalized difference vegetation index (NDVI), that are related to green leaf area and total green biomass have been the most commonly used method of inferring vegetation phenological events from satellite sensors (e.g. Hargrove et al. Citation2009, Ganguly et al. Citation2010). Until the turn of the millennium, the National Oceanic and Atmospheric Administration Advanced Very High Resolution Radiometer (NOAA-AVHRR) suite of sensors provided the principal source of global data for this purpose (Kathuroju et al. Citation2007). The NDVI has a strong link with vegetation productivity variables such as primary productivity which in turn signals key phenological events (Myneni et al. Citation1997, Zhou et al. Citation2001, Zhang et al. Citation2004, Piao et al. Citation2006). Data sets such as the Global Inventory Modeling and Mapping Studies (GIMMS) NDVI (e.g. Heumann et al. Citation2007, Julien and Sobrino Citation2009) and pathfinder NDVI have been popular for studies of land surface phenology (e.g. Tao et al. Citation2008). However, radiometric data from the AVHRR sensor suffers from a lack of precise radiometric calibration, poor geometric registration and difficulties associated with cloud screening result in high levels of noise (Zhang et al. Citation2006). Seamless data continuity between satellite and sensor generations is difficult to achieve (Steven et al. Citation2003). Although, further processing of these data can minimize such discrepancies (e.g. 10-day maximum value 1 km NDVI composites in the MEDOKADAS series is compiled from the NOAA-11, NOAA-14 and NOAA-16 sensors and corrected for sensor degradation and orbital drift; Martínez and Gilabert (Citation2009)), comparisons of the various AVHRR NDVI data sets derived as a result of different correction and processing schemes have indicated a lack of consistency (Alcaraz-Segura et al. Citation2009, Citation2010). The real strength of these data sets lie in the length of their temporal record (10 years +), though methods for data smoothing and extraction of key phenological events (such as green-up, dormancy) have yet to be standardized and are a source of uncertainty (White et al. Citation2009). Moreover, the spatial resolution of this record means that the contribution of the individual phenology of pixel components is missed and homogenized (Reed et al. Citation2003). The NDVI from these data also saturates at high levels of biomass (Foody et al. Citation1996).
The new generation of satellite sensors greatly improves the potential to identify changes in vegetated ecosystems (Kang et al. Citation2003). Here continuity and consistency of observations are essential in order to detect subtle tends in long‐time series of data. The early NOAA-AVHRR sensors have since been joined by VEGETATION, POLDER, SeaWIFS, ATSR, MODIS, MISR and MERIS (Steven et al. Citation2003, Fontana et al. Citation2008). In particular, MODIS, at spatial resolutions of 250 m, 500 m and 1 km, globally offers enhanced geometric, atmospheric and radiometric properties (Zhang et al. Citation2003). The enhanced vegetation index (EVI) generated from MODIS data has several advantages over the NDVI for vegetation studies, having been used with some success in several phenological studies (e.g. Zhang et al. Citation2004, 2006) as it reduces sensitivity to soil and atmospheric effects and has a greater dynamic range than the NDVI (Huete et al. Citation2002).
Another satellite sensor also launched post-millennium is the Envisat MERIS. This sensor has many virtues for remote sensing ecosystem status and change; radiometrically it is the most accurate imaging spectrometer in space (Curran and Steele Citation2004) and unlike many spaceborne sensors, the MERIS platform has well-placed spectral sampling at visible and near‐infrared (NIR) wavelengths coupled with narrow bands (15 bands selectable across range: 390–1040 nm (bandwidth programmable between 2.5 and 30 nm)) that theoretically improve the accuracy of vegetation monitoring. The sensor also benefits from a moderate spatial resolution (300 m) and 3-day repeat cycle (Verstraete et al. Citation1999). Two vegetation indices have been included in the official processing chain of the MERIS sensor: the MERIS global vegetation index (MGVI; Gobron et al. (Citation1999)) and the MERIS terrestrial chlorophyll index (MTCI; Dash and Curran (Citation2004)). Both are adopted gradually for the study of vegetation and its dynamics (e.g. Dash et al. Citation2007, Sexias et al. Citation2009, Zurita-Milla et al. Citation2009).
The MGVI is related linearly to the fraction of absorbed photosynthetically active radiation (fAPAR) by the canopy and is computed using the top of atmosphere reflectance in blue, red and NIR MERIS bands, with the blue band being used to atmospherically correct red and NIR reflectances. The MGVI is computed as a polynomial function of the rectified red and NIR reflectances (Gobron et al. Citation2007). It was developed in order to exhibit maximum sensitivity to the presence and change in green healthy vegetation whilst limiting sensitivity to atmospheric scattering and absorption, soil colour and brightness and illumination and observation variability. As a direct estimator of fAPAR, which has been demonstrated to constrain global models of vegetation phenology (Gobron et al. Citation2010), the MERIS MGVI is a useful but little-used source of data for phenological studies. The MTCI is the only available chlorophyll-related index from a spaceborne sensor. The index is calculated using the ratio of the difference in reflectance between bands 10 and 9 and the difference in reflectance between bands 9 and 8 of the MERIS standard band setting. It is very simple to calculate, yet it is sensitive to all and notably, high values of chlorophyll content (Dash and Curran Citation2004). The MTCI has limited sensitivity to atmospheric effects and also soil background and view angle (Dash et al. Citation2008). There is a rapidly growing literature reporting the successful utility of the MTCI for vegetation studies (Dash and Curran Citation2006, Espana-Boquera et al. Citation2006, Dash et al. Citation2010, Foody and Dash Citation2010).
The ability of a vegetation index (VI) to monitor phenological event change is reliant on its sensitivity to changes in both leaf area and chlorophyll concentration. Since the red edge position (REP) of a canopy is strongly correlated to the content of foliar photosynthetic pigments (Carter and Spiering Citation2002), it can be used to indicate the onset of productivity and senescence before structural changes are evident (Davids and Tyler Citation2003). This is particularly advantageous since it has been demonstrated that changes in the chlorophyll concentration of plant species (grassland in particular) that occur as a result of elevated temperatures may not result in biomass changes (Lemmens et al. Citation2008). The start of annual vegetation growth, green-up, will lead to a rapid increase in either or both chlorophyll concentration and leaf area (species dependant), therefore increasing foliar chlorophyll content. Similarly, autumnal senescence, and the associated breakdown in photosynthetic pigments, reduces leaf chlorophyll content. Spectroscopy on fresh deciduous leaves during the transition from late summer to autumn senescence has shown that there is a significant shift in REP to shorter wavelengths (Cipar et al. Citation2008). Decline in chlorophyll content happens earlier in the growing season before variations in leaf area become apparent (Miller et al. Citation1991). As the MTCI is designed to exploit the spectral reflectance in red edge wavelengths, the MTCI should prove to be particularly sensitive to the changes in chlorophyll content associated with various phenological events and their associated stages of canopy development. We purport that there is now real opportunity for monitoring vegetation function and condition systemically and reliably (Gitelson et al. Citation2006, Wu et al. Citation2009) using the MTCI VI.
This article explores the viability of the MERIS MTCI for monitoring land surface phenology, through evaluation with field data and comparison with other satellite measures of land surface phenology, namely the vegetation indices of the MERIS MGVI and the MODIS EVI and NDVI. It is hypothesized that the phenological information extracted from the MERIS MTCI will be different to that from the comparison indices.
2. Materials and methods
2.1 Study area
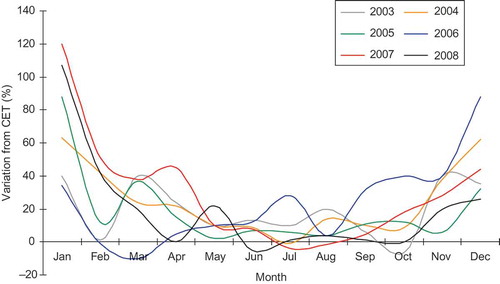
The New Forest National Park in Southern England (0°56´N, 01°5´W) covers an area of 571 km2, of which 223 km2 is mixed and ancient deciduous forest and 164.5 km2 is heath and grassland, with the rest of the land cover comprising marshlands, shoreland and shrubland. Meteorological data for the study period (2003–2008) revealed a clear warming trend in the central England temperature (CET) average. The CET is a long‐running data set (since 1669) available from http://badc.nerc.ac.uk/data/cet/ and used in coarse spatial resolution studies to typify the English climate as it is strongly correlated (p < 0.001) with local station observations throughout England (Croxton et al. Citation2006). plots the percentage of variation between the long-term CET data set (1669–2002) monthly mean temperature and the temperatures in the years 2003–2008. A clear trend of milder winters is apparent. Also evident are several instances of elevated spring and autumnal temperatures, particularly in 2006 and 2007, an observation supported by the Meteorological Office and the Royal Netherlands Meteorological Institute which recorded from May 2006 to October 2006 as the warmest on record in the UK since 1659. These observed temperatures led to reports of an extended growing season in 2006 (and delayed senescence), which was followed by a warm spring in 2007, which was also the warmest on record (http://www.naturescalendar.org.uk).
Figure 1. Variation between the long-term CET (1669–2002) monthly mean temperature and monthly temperature during the years 2003–2008.
By virtue of the area's management the National Park is composed of ancient semi-natural and ornamental woodlands and managed coniferous plantations (enclosures) of varying sizes and adjacent open heath and grassland covered in heather and low scrub. The deciduous woodlands are dominated by White Birch (Betula pubescens), English Oak (Quercus robur) and European Beech (Fagus sylvatica), with the coniferous forest dominated by Scots Pine (Pinus sylvestri), Corsican Pine (Pinus nigra var. maritima), White Pine (Pinus strobus), Sitka Spruce (Picea sitchensis) and Douglas Fir (Pseudotsuga menzieii) (Forestry Commission 2006). Study sites were selected across the National Park using true colour aerial imagery of the area, acquired during July 2005 and re-sampled to a spatial resolution of 5 m. The criterion for selection was that each comprised a homogenous vegetation area of at least 2 km2 (as this could incorporate the ground area covered by two reduced spatial resolution MERIS pixels) and that they be relatively flat (to minimize topographical effects). Site visits were conducted to confirm correspondence in site extents and vegetation cover type with that on the aerial photography. GPS coordinates were taken in the field at boundaries of homogenous vegetation types. GPS coordinates from the field visits and high-resolution imagery were used to refine study site boundaries in the ESRI ArcGIS software and produce area data sets for both woodland (with a mix of coniferous and deciduous species) and mixed grassland and heathland (herein grass/heath land) in the New Forest. Field surveys of the study sites determined the species present in each study site and their percentage cover. This revealed that species composition with each study site was relatively consistent for both woodland and grass/heath land areas. In total, six study sites were deemed suitable – three woodland and three grass/heath land, totalling 34.9 km2.
2.2 Remote sensing data
Vegetation phenology can be estimated with high precision from time-series data with temporal resolutions of between 6 and 16 days. This is the case even if the daily data contain some uncertainties (Zhang et al. Citation2009). This study used temporal composited VI data from the MERIS sensor (MGVI and MTCI) and the MODIS sensor (EVI and NDVI) at both 8- and 16-day resolutions. Since 2003, global and regional composite (Level 3) products of MERIS Level 2 geophysical data (sourced from the ESA MERIS MERCI dataserver) have been generated by the UK Multi-Mission Product Archive Facility (UK-MM-PAF). The Level 3 MTCI product is available from the UK's NERC Earth Observation Data Centre (NEODC; http://www.neodc.rl.ac.uk) and is processed by Infoterra (Toulouse, France). The products are generated in GEOTIFF format, on latitude–longitude geocoded grids, accompanied by an XML-metadata file and a JPEG browse image. Here the 1 km regional 8-day arithmetic mean composite product was downloaded for the growing seasons of 2003–2008. However, there were gaps in the resultant time series (i.e. the 2005 growing season and January to May 2006) and these were filled by processing downloaded Level 2 cloud-free MERIS imagery from ESA MERIS MERCI reduced resolution (1 km) dataserver to produce 8-day MTCI composites adopting the same methodology as the UK-MM-PAF. Working within the ENVI image-processing software environment, the MTCI composites were stacked chronologically to produce a time-series layer stack for each growing season. The study sites for woodland and grass/heath land were located and the MTCI value extracted from each composite image across each of the 6 years under investigation. A mean MTCI value was then computed for woodland and for grass/heath land for each composite image for analysis.
The MODIS EVI and NDVI data sets were available through the MODIS VI (MOD13A2) 16-day 1 km product and accessed through the NASA Warehouse Inventory Search Tool (WIST) (accessed at http://https://wist.echo.nasa.gov/api/). MODIS-VI products are made from the level 2 daily MODIS surface reflectance (MOD09), which is corrected for molecular scattering, ozone absorption and aerosols. Layer stacks were produced from the 16-day composites for both EVI and NDVI to span the 2006 and 2007 growing seasons, since these have known climatic anomalies. In addition, 16-day composites of MERIS MGVI were also computed from downloaded Level 2 cloud-free MERIS imagery from ESA MERIS MERCI reduced resolution (1.2 km) dataserver. Again, a mean MGVI, EVI and NDVI value was then computed for woodland and for grass/heath land for each composite image for analysis. To make valid comparisons between the MTCI, MGVI, EVI and NDVI, an averaging of two consecutive periods of the 8-day MTCI data was undertaken to conform to the 16-day period of the MGVI, EVI and NDVI data sets.
Both the 8-day MTCI and 16-day MTCI, MGVI, EVI and NDVI data sets were then smoothed, mainly to overcome any residual cloud contamination. Although cloud contamination was minimized in the compositing methods employed by selecting cloud-free images, there is associated noise as a result of the compositing and re-sampling procedures. Data smoothing is a method for removing noise, whilst maintaining phenological event information, in the time-series data. The phenological signal needs to retain its temporal pattern and detail to preserve information on vegetation condition. Therefore, careful consideration needs to be given to the smoothing method. Here, the phenological profile for each site was smoothed by Gaussian model fitting in the Timesat software programme (Jönsson and Eklundh Citation2004, Eklundh and Jönsson Citation2009). This approach has been used successfully to remove noise in the composite data whilst preserving phenological event information (Jönsson and Eklundh Citation2002). Timesat has been used in a wide range of time-series studies, including characterizing phenology (Olsson et al. Citation2005, Heumann et al. Citation2007, Seaquist et al. Citation2009).
2.2.1 Estimating phenological events from time-series data
Jönsson and Eklundh's (Citation2004) double logistic and asymmetric Gaussian function-fitting techniques were selected for use due to their improved performance over other modelling techniques (Hird and Mcdermid 2008). Seven phenological event metrics were derived either from Timesat software (Eklundh et al. Citation2009) or by determining the rate of change in curvature from the smoothed vegetation profiles. In the current version of Timesat (version 3.0) three key seasonality parameters, (1) date of the start of the growing season (green-up onset); (2) date of the end of the growing season (dormancy onset); (3) largest value (date of peak the growing season) and associated seasonal amplitude, are computed for each of the full seasons in the time series. From these, the (4) green-up duration in days and (5) growing season length in days can be calculated. Using the fitted models function to remove noise in the growing season profile provides a more stable measure of the points of phenological events. Dates of maturity onset (6) and senescence onset (7) are metrics not derived by Timesat software, therefore the rate of change in the Gaussian fitted curves was used to derive these.
2.3 Ground data
‘Validation’ is a key issue in remote sensing-based studies of phenology over large areas (Reed et al. Citation2009). Even if ground- and remotely sensed phenological data are spatially coincident the chance of a single point ground observation being representative of the area covered by the ground resolution element of a pixel (typically 1 km) is small (Fisher and Mustard Citation2007). Rather than claim validation, here two sets of ground data were used to compare with the phenological event trends inferred from each of the 8-day composited MTCI data sets.
The first was climate data, local to the New Forest National Park (measured by the weather station at Hurn, approximately 12 km away), obtained from the Meteorological Office UK weather station network. Average daily temperature (T mean) was calculated as a mean of the daily maximum (T max) and the daily minimum (T min), a method used by the Meteorological Office (Perry and Hollice Citation2005). The 8-day arithmetic average temperatures were derived from the daily temperature data set to correspond with the format of both the 8-day MTCI composites.
The second ground data set was acquired through the UK Phenology Network (UKPN), which is run jointly by the UK Woodland Trust and the UK Centre for Ecology and Hydrology to provide point-based phenological ground observations from sites around the UK (http://www.naturescalendar.org.uk/). This data set provides a previously untapped opportunity to compare broad trends in satellite-sensor and ground-based phenological event measurements. The UKPN relies on thousands of volunteers who record a range of observations relating to important events in the seasonal patterns of the UK's wildlife. As part of this record three observations pertaining to this study have been archived that cover the 2003 to 2008 time period, including date of first leaf, first leaf fall and bare tree. These are recorded for a range of indicator species, including English oak and European beech species that were abundant in the woodland sites in the New Forest National Park. For the purpose of this investigation, the date at which an observation was made in the New Forest National Park for these species was extracted from the archive. This information cannot be used as a direct comparison (i.e. date-to-date), due to the differences in geographical scale, the presence of coniferous species, a lack of ground data for grasses and heath species and a difference in the phenological event metrics. However, trends in phenology across the 2003–2008 study period are apparent and are postulated to be primarily linked to variation in seasonal temperature.
3. Results and discussion
3.1 MTCI-derived phenological profiles
The smoothed MTCI phenological profiles for both woodland () and grass/heath land () for each year between 2003 and 2008 exhibit characteristic seasonal curves. The woodland curve was more pronounced than the grass/heath land curve, with higher MTCI values, due to the higher net primary productivity attained by this ecosystem over the growing season. Satellite sensor phenological studies of woodland at moderate to coarse spatial resolution are likely to include both deciduous and coniferous species. In this study, canopy dormancy is defined as the date at which coniferous species exhibit minimum estimated chlorophyll content and this date is likely to be after deciduous species have become dormant. In mixed coniferous and deciduous study sites, the presence of coniferous species limits the minimum MTCI value during the winter months. This was observed in the temporal MTCI profiles, where values fluctuate within a narrow range of 1.3–1.8. Coniferous trees remain green during the dormancy season; however, the photosynthetic efficiency is down-regulated as a response to low demands of carbohydrates (Ensminger et al. Citation2004) as demonstrated by the low MTCI values. The aggregated woodland MTCI temporal profiles reveal a clear seasonal pattern, which is characterized by a trapezoid phenology profile. This general pattern is evident for all 6 years of data, indicating that the MTCI is a reliable tool for monitoring the phenology of the woodland study sites. In general terms, the MTCI increases rapidly from mid-April; this rapid green-up corresponds to an inferred period of increased foliar chlorophyll content mainly in the deciduous trees. The curve stabilizes during June, followed by a decrease in MTCI from the end of August, marking the onset of the autumnal senescence. The MTCI reaches a minimum during the autumn/early winter, denoting canopy dormancy.
Figure 2. MTCI-derived phenological profile for woodland for the years 2003–2008.
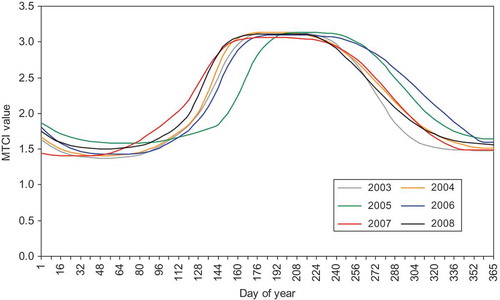
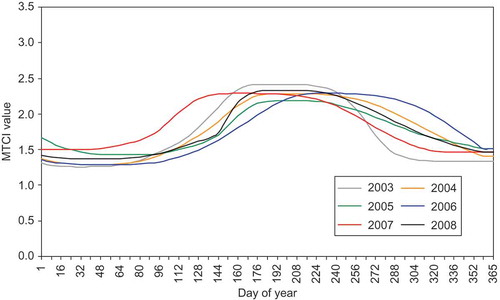
Figure 3. MTCI-derived phenological profile for grass/heath land for the years 2003–2008.
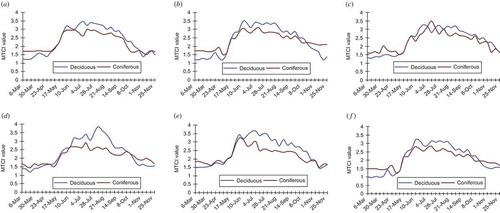
The presence of large (greater than one ‘reduced resolution’ MERIS pixel) woodland enclosures permitted further examination of the MTCI-derived phenological profiles for a deciduous and coniferous wood (one MTCI pixel in each case). plots the phenological profiles of deciduous and coniferous canopies for the 2003–2008 growing seasons. Coniferous species maintain a minimum greenness during the winter and do not shed all of their needles each year (Fisher et al. Citation2006) accounting for the higher MTCI values during the early and later growing seasons. As a result, coniferous species do not exhibit large seasonal variation in photosynthetic biomass (Kimball et al. Citation2004), so observed changes in estimated coniferous chlorophyll content is due primarily to changes in chlorophyll concentration rather than leaf area index (LAI). Moreover, seasonal changes in photosynthetic efficiency are due to physiological changes associated with cold hardening including the clumping of chloroplasts, and cell dehydration, all of which change light absorbance and reflectance (Zwiazek et al. Citation2001). The phenological profiles show that the timing and rate of green-up is consistent between coniferous and deciduous species. This suggests that (1) leaf development in deciduous species, (2) bud burst, a period where new needles emerge in a number of coniferous species (Cannell and Smith Citation1983, Jönsson et al. Citation2010) and (3) the associated increase in foliar chlorophyll content in both deciduous and coniferous species are triggered by similar environmental events. Similarly the timing of autumnal senescence between deciduous and coniferous woodland is similar, although during the 2004 and 2006 growing seasons, the rate at which chlorophyll content decreased was less in coniferous stands. At maturity, the deciduous woodland has a greater MTCI compared with coniferous woodland, which is maintained throughout the peak of the growing season.
Figure 4. Comparison between deciduous and coniferous woodland MTCI profiles for growing seasons: (a) 2003, (b) 2004, (c) 2005, (d) 2006, (e) 2007 and (f) 2008.
Heath/grass land exhibit a distinct phenological profile and clear responses to a change in inter-annual seasonal temperatures. Such change has been observed in temperate grasslands and linked to variations in annual weather patterns (Kammer Citation2002, Butterfield and Malmström Citation2009). Although the mechanics of the relationship have not been studied, the results of this research support the notion that warm spring periods increase growth rates, chlorophyll content and photosynthetic rates (Lemmens et al. Citation2008). Since leaf phenology is correlated positively with root phenology in grassland, and therefore reflects overall system seasonality (Steinaker and Wilson Citation2008), the ability to track seasonal dynamics of grassland will be a particularly beneficial input to models predicting the response of vegetation to climate warming (Kramer et al. Citation2000).
With both the woodland and grass/heath land curves ( and ), it is apparent there was an increase in MTCI (and thus inferred chlorophyll content) for the autumnal period of 2006 compared with the same period for other years in the study. Late October 2006 MTCI values were comparable with mid-September values for the years 2003 and 2004 indicating a delay in senescence of the vegetation canopies. Investigation between MTCI and CETmean for the 2006 growing season and the growing seasons of 2003–2005 revealed a marked increase in temperature and MTCI. From the period July 2006 to November 2006 the high MTCI values were maintained, indicating a delay in autumnal senescence and vegetation photosynthetic potential. During mid-October the mean inferred chlorophyll content for all sites was considerably greater than the average of the previous 3 years. The 2006 MTCI profile also reveals a delay in reaching canopy maturity; evident as MTCI values are below average until early July, which can be attributed to lower mean temperatures throughout the early growing season (February to May). In addition to a late senescence in 2006, an early green-up was observed in 2007 MTCI phenological profiles for both woodland and heath/grass land areas. This coincided with elevated mean temperatures (in relation to 2003–2006 and 2008) at the local weather stations and CET. These findings support those of Fisher et al. (Citation2006) and Sparks et al. (Citation2005) who related increased cumulative temperatures to leaf development of deciduous woodland in temperate latitudes, particularly those of the preceding months (Menzel et al. Citation2006). Bassow and Bazzaz (Citation1998) linked an increase in seasonal temperature with increased photosynthetic rates, as ecosystems modify their photosynthetic capacity in relation to a change in limiting factors through changes in foliar chlorophyll content (Dawson et al. Citation2003). Since air temperature is the principal limiting factor to vegetation growth at temperate and higher latitudes these findings are consistent with the observation that warming remains the most important driver of phenological event ‘shifts’ in the northern hemisphere (Root et al. Citation2003, IPCC Citation2007). The inference from MTCI data was that chlorophyll content was higher in early 2007 than in previous years and so higher seasonal temperatures can, indirectly, increase the photosynthetic potential of vegetation for the species under investigation.
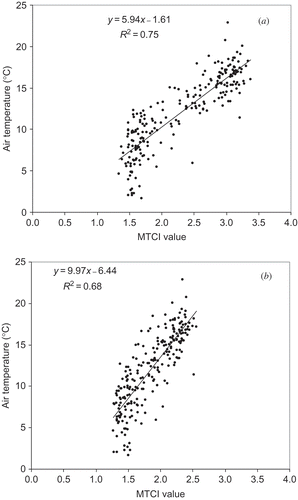
A closer examination of the link between temperature and phenology was undertaken through correlations of the MTCI response from each 8-day composite for the years 2003–2008 with the corresponding 8-day arithmetic mean of the local temperature for both the woodland and grass/heath land sites ((a) and (b), respectively). In both cases a strong and statistically significant relationship exists between the local temperature and the MTCI. As temperatures altered so did chlorophyll content, with warmer temperatures associated with more chlorophyll content, and thus productivity of the ecosystem. The MTCI has usefully captured this.
Figure 5. Regression analysis of the MTCI response from each 8-day composite for the years 2003–2008 with the corresponding 8-day arithmetic mean of the local temperature for both the woodland (a) and (b) grass/heath land sites.
3.3 MTCI-derived phenological event dates
The computed phenological event dates for both woodland and grass/heath land sites for each year of investigation as indicated by the MTCI, along with the growing season length (days) and green-up duration (days), are presented in . As denoted by the phenological profiles, green-up of the woodland vegetation occurred in April or beginning of May, maturity onset in June or July, senescence onset in September or October and dormancy onset in October to December. The number of days taken for the woodland site to green-up varied between a minimum of 55 (2003 and 2004) and a maximum of 72 (2006), and the growing season length ranged between 179 (2003) and 221 (2006). Although the grass/heath land sites exhibit a longer growing season (ranging from 84 in 2003 to 237 in 2006), the interannual pattern is very similar to that of woodland.
Table 1. Inter-annual variability in phenological event dates for woodland and grass/heath land derived from the MTCI time series
Although direct comparison of dates with those compiled from the UKPN is not possible, the pertinent trends are consistent with those depicted by the MTCI data and with the fact that the timing of the seasons is changing in length and complexity. Noteworthy is (1) the extended green-up and late senescence onset and dormancy onset in 2006 which was a result of a warmer, non-drought year compared with the average; (2) the early green-up but average senescence and dormancy in 2007 which was the result of an exceptionally warm spring followed by cooler conditions in the latter part of the year; (3) an early senescence in 2003 which was the result of drought in the autumn coupled with slightly elevated temperatures; and (4) a late dormancy in 2005 due to warm temperatures and lack of drought. Ideally, spatially coincident phenological event dates would provide more information and this should be the focus of further study. However, for the purpose of this investigation the UKPN data demonstrate the utility of the MTCI, in that it has captured the key phenological event dates and depicts how the vegetation has responded to climatic anomalies over time. Change in temperature has been shown to affect the phenology of woodland species (Deng et al. Citation2007), leading to earlier spring green-up in woodlands in the mid- and higher latitudes (Menzel et al. Citation2006). The findings in this article support the notion of delayed senescence due to favourable growing conditions; this was particularly evident for the 2006 MTCI growing season.
3.4 Comparison of MERIS-MTCI data sets with MERIS-MGVI, MODIS-derived NDVI and MODIS-derived EVI
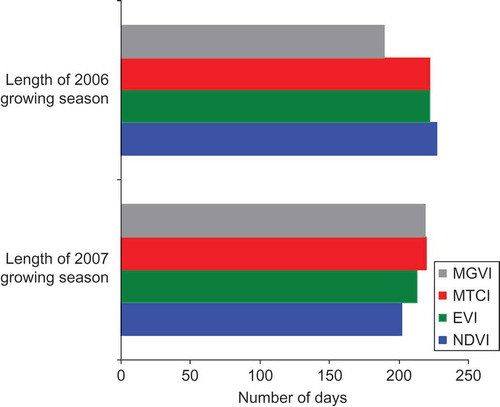
The phenological profiles for the 16-day composites of MTCI and MGVI from MERIS and NDVI and EVI from MODIS for woodland are depicted in (a) and (b) for the years 2006 and 2007, respectively; these were years with the largest climatic anomalies. Statistical intercomparison of the phenological profiles for the four vegetation indices was undertaken using a two-sample Kolmogorov–Smirnov test, which examines the difference (at 0.05 significance level) between the shape of the phenological profiles. This test indicates that for both 2006 and 2007 the MTCI curve was statistically different to the curves produced using the other indices. Also of note is that for both the years the MGVI phenological profile was not found to be different to that of the EVI curve. Furthermore, for 2006, it was found that the NDVI curve was not different to that of the EVI and MGVI; however, a difference was recorded between the phenological profiles of the NDVI to that of the EVI and MGVI for the year 2007. The phenological event dates from each curve for both years, shown in (a) and (b), indicate that all four indices depicted the late end of growing season for 2006 and the early green-up of 2007; however, it was only the MTCI that displayed the delayed autumn senescence of 2006. The derived dates for each phenological event differed between the indices in most cases, with the error in the total length of the growing season between the indices being 38 days for 2006 and 18 days for 2007 ().
Figure 6. Phenological profiles for Envisat MERIS MTCI (red) and MGVI (silver) and MODIS EVI (green) and NDVI (blue) for (a) 2006 and (b) 2007.
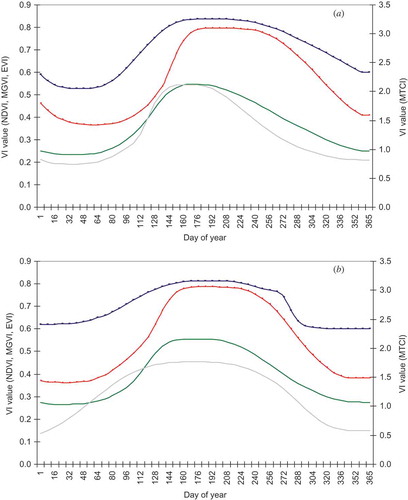
Figure 7. Computed phenological event dates for the woodland site for (a) 2006 and (b) 2007 as derived from Envisat MTCI, Envisat MGVI, MODIS EVI and MODIS NDVI phenological profiles.
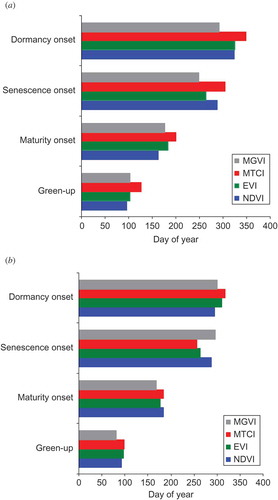
Figure 8. Computed length of growing season for the woodland site for 2006 and 2007 as derived from Envisat MTCI, Envisat MGVI, MODIS EVI and MODIS NDVI phenological profiles.
The monitoring of forest phenology via satellite sensors requires a relationship between tree phenology and the VI employed (Jönsson et al. Citation2010). As the leaf phenological cycle progresses, leaves of deciduous forest canopy change in their biophysical (e.g. leaf structure and thickness), biochemical (e.g. chlorophyll and other pigments, nitrogen) and optical properties, which in turn influence albedo, latent and sensible heat flux and photosynthesis of the land surface (Xiao et al. Citation2004). Although, each of the four indices examined is a function of these changes in the cycle, the relative contribution of each differs, both spatially and temporally. Broadly, the MTCI is sensitive to variation in chlorophyll content, that is, biochemical activity, and relatively insensitive to vegetation configuration. The NDVI, EVI and MGVI, however, are primarily structurally driven spectral indices that quantify the biophysical activity of vegetation. Furthermore, the mathematical and scientific value of the VI is critically dependent on the form of the data used to calculate it in that a wide range of factors determine the final value of the index (Steven et al. Citation2003). The impact of solar, illumination, sensor sequence and waveband placement on a time series of vegetation indices is well established (e.g. Sexias et al. Citation2009). All these uncertainties can be ‘corrected’ for and so minimized. Temporal compositing time periods (Zhang et al. Citation2009) and method (White et al. Citation2009) are also factors to consider, as are methods for curve smoothing and extraction of phenological event dates.
Due to mixed species stands found in the New Forest, pixels will contain coniferous and deciduous species. Therefore, the small seasonal variation in photosynthetic biomass demonstrated by coniferous species results in a small change in LAI throughout the growing season (Kimball et al. Citation2004) when compared with deciduous areas. Compared to the NDVI, the MTCI is more suited to determine phenological event change in mixed tree pixels as total chlorophyll content will change more between seasons than LAI. The NDVI is more sensitive to green biomass and will respond to the aggregated change in seasonal LAI between coniferous and deciduous species. The effect of soil background will be a function of vegetation phenology and directly linked the foliar development of deciduous species. Therefore, during the period late autumn to early spring, which coincides with ‘leaf-off’ of deciduous tree species, the relatively higher NDVI values are due to the effect of soils background as well as the presence of coniferous species within the study sites. The NDVI phenological profile exhibits small amplitude, with limited variation between summer maxima and winter minima. The NDVI has a weak relationship with green biomass when vegetation cover is appreciably greater than 100%. Saturation in high biomass ecosystems and peak periods of growing season (Zarco-Tejada et al. Citation2001) may limit the use of the NDVI as a tool for phenological monitoring. The MTCI is based on the relationship between chlorophyll content and red-edge position, which has a strong correlation with biomass (Eitel et al. Citation2007). MERIS acquires reflectance measurements in narrow bands, which should overcome biomass saturation issues (Blackburn Citation1999). The associated decrease in MTCI from late August 2007 is considerably earlier than the observed senescence observed by the MODIS NDVI time series. This supports the earlier decline in chlorophyll concentration as compared with decrease of other physiological or structural changes, namely leaf area, during autumnal senescence (Miller et al. Citation1991).
Whereas the NDVI is chlorophyll sensitive and responds to red band variations, the EVI is more sensitive to variation in near-infrared reflectance and is therefore very responsive to canopy structural variations, including LAI, canopy type and canopy architecture (Gao et al. Citation2000, Harris and Dash Citation2010). However, the EVI remains sensitive to a wide range of variation in canopy density (Xiao et al. Citation2004, Zhang et al. Citation2005). Previous studies have concluded that the EVI provides more information on the seasonal dynamics of deciduous broadleaf forest at leaf and canopy levels than NDVI and fAPAR, which is closely correlated to the MGVI (Xiao et al. Citation2004). Previous comparisons between the NDVI and MGVI have concluded that the MGVI appears to reveal more information on the status of terrestrial surfaces than does the NDVI and note that this is due to a gain in the spatial contrast associated with a much lower noise on the computed index values (Gobron et al. Citation1999). The detection of fAPAR through the MGVI index is useful since this acts at once as an integrated indicator of the status and seasonal evolution of the plant canopy in a range of vegetated environments (Verstraete et al. Citation2008, O'Connor et al. Citation2009). The magnitude of the MGVI has a near-linear and positive relationship with fAPAR, which, in turn, is related positively to LAI and reflects its photosynthetic activity and, although related to the chlorophyll content of a canopy, this is a different variable to that measured by the MTCI. The ratio of the MTCI/MGVI is approximately equal to the chlorophyll concentration, and the temporal variation in chlorophyll concentration of vegetation may provide a valuable discriminating variable for mapping land cover (Dash et al. Citation2007).
Differences in the phenological profiles between the indices will also be a function of the temporal compositing method. EVI and NDVI data from MODIS utilize Maximum Value Composite (MVC) data. The MVC filter (Holben Citation1986) is designed to find the highest VI value (and therefore lowest noise) within a fixed time increment. The MVC introduces temporal uncertainty when the acquisition period falls within a week- to month-long window (in this instance the composting period is 16 days). The MERIS MTCI and MGVI data sets use the arithmetic mean compositing technique, which is less sensitive to temporal biases compared with the widely used maximum value compositing technique. With an optimized cloud mask it can produce outputs with a greater spectral and spatial consistency than otherwise (Dash et al. Citation2010).
These results do not lend themselves to a recommendation of one particular VI over another. However, it has been demonstrated that there is significant variability in phenological event metrics obtained from different vegetation indices and that the desire for remote sensing products with ease of use and wide applicability and without the requirement for expert knowledge or operator intervention (Verstraete et al. Citation2008) could lead to unintentional errors. The implications of these differences in phenological event dates between different indices are of importance to studies of climate change and related impacts on the terrestrial biosphere. Inter-annual variation in the timing of phenological events is large (Badeck et al. Citation2004) as a result of circulation patterns, solar cycles, and oscillations such as the El Niño Southern Oscillation (ENSO) and the North Atlantic Oscillation (NAO), thus uncertainties relating to measurements of change and choice of satellite sensor data further complicate an already challenging task.
The MTCI captured the key phenological events in a similar fashion to the more commonly used NDVI and EVI and the less prevalent MGVI. Further research at finer temporal resolutions, employing other methods to derive the phenological event dates, would be advantageous. In addition, it is critical to establish a robust methodology to validate this satellite sensor-derived phenological event information. Since it is predicted that the magnitude and frequency of extreme, such as drought, cold and hot, periods will increase (Jentsch et al. Citation2009), it is imperative that a robust system for studying the impacts of these is developed. Further application of the MTCI in other environments, such as tropical and dryland ecosystems (e.g. Zhang et al. Citation2010), is also required. Once the boundaries of use of the MTCI are established, a system that is future-proof is desirable; the planned launch of ESA's Sentinel-2 polar-orbiting satellites will provide systematic global acquisitions of high spatial resolution multispectral imagery with a high revisit frequency. This mission is tailored towards the needs of operational land monitoring and will provide estimates of leaf chlorophyll content via a MTCI-like index.
4. Conclusions
We used Envisat MTCI data to construct a phenological profile of and extract key phenological event dates from vegetation in Southern England during a period of known climatic anomalies. Overall, the research findings support the use of the Envisat MTCI for this purpose, principally due to its sensitivity to canopy chlorophyll content, a vegetation property that is a proxy for the canopy physical and chemical alterations associated with change to phenological event timing. Specific findings include:
| 1. | A close correspondence between MTCI and canopy phenology, as indicated by ground observations and climatic proxy. | ||||
| 2. | A significant difference between MTCI-derived phenological profiles and key phenological event dates and those from other vegetation indices, namely the MERIS MGVI, MODIS NDVI and MODIS EVI. Uncertainties arising from these differences are as large as those arising from climatic perturbations. | ||||
| 3. | Further research is needed across a range of vegetation cover types and climatic conditions with full spatial resolution MTCI data (300 m) and employing other methods to derive the phenological event dates. | ||||
The use of satellite sensor data in phenological studies is increasingly recognized as a key component for the understanding of the response of vegetation systems to climatic change. Repeat observations from satellite-borne multispectral sensors provide a mechanism to move from plant-specific to regional scale studies of phenology. Here, it is advocated that the readily available MTCI data set should be considered for use along with understanding of the physical processes and computational approaches that determine the index values and how these may vary from those obtained using other vegetation indices.
Acknowledgements
We thank the NERC Earth Observation Data Centre, European Space Agency, Infoterra Ltd., UK Meteorological Office and UKPN for data and Bournemouth University for a PhD studentship awarded to S. Almond. The authors are also extremely grateful for the valuable comments of two anonymous referees and to the authors of the TIMESAT software.
Related Research Data
References
- Alcaraz-Segura , D. , Chuvieco , E. , Epstein , H.E. , Kasischke , E.S. and Trishchenko , A. 2009 . Debating the greening vs. browning of North American boreal forest: differences between satellite datasets . Global Change Biology , 16 : 760 – 770 .
- Alcaraz-Segura , D. , Liras , E. , Tabik , S. , Paruelo , J. and Cabello , J. 2010 . Evaluating the consistency of the 1982–1999 NDVI trends in the Iberian peninsula across four time-series derived from the AVHRR sensor: LTDR, GIMMS, FASIR, and PAL-II . Sensors , 10 : 1291 – 1314 .
- Arora , V.K. and Boer , G.J. 2005 . A parameterization of leaf phenology for the terrestrial ecosystem component of climate models . Global Change Biology , 11 : 39 – 59 .
- Badeck , F.W. , Bondeau , A. , Böttcher , K. , Doktor , D. , Lucht , W. , Schaber , J. and Sitch , S. 2004 . Responses of spring phenology to climate change . New Phytologist , 162 : 295 – 309 .
- Barrios , J.M. , Verstraeten , W.W. , Maes , P. , Clement , J. , Aerts , J.M. , Haredasht , S.A. , Wambacq , J. , Lagrou , K. , Ducoffre , G. , van Ranst , M. , Berckmans , D. and Coppin , P. 2010 . Satellite derived forest phenology and its relation with Nephropathia epidemica in Belgium . International Journal of Environmental Research and Public Health , 7 : 2486 – 2500 .
- Bassow , S.L. and Bazzaz , F.A. 1998 . How environmental conditions affect canopy leaf-level photosynthesis in four deciduous tree species . Ecology , 79 : 2660 – 2675 .
- Betts , R.A. 2000 . Offset of the potential carbon sink from boreal forestation by decreases in surface albedo . Nature , 408 : 187 – 190 .
- Blackburn , G.A. 1999 . Relationships between spectral reflectance and pigment concentrations in stacks of deciduous broadleaves . Remote Sensing of Environment , 70 : 224 – 237 .
- Brügger , R. , Dobbertin , M. and Kräuchi , N. 2003 . “ Phenological variation of forest trees ” . In Phenology: An Integrative Environmental Science , Edited by: Schwartz , M.D. 255 Dordrecht , , the Netherlands : Kluwer Academic .
- Busetto , L. , Colombo , R. , Migliavacca , M. , Cremonese , E. , Meroni , M. , Galvagno , M. , Rossini , M. , Siniscalco , C. , Morra Di Cella , U. and Pari , E. 2010 . Remote sensing of larch phonological cycle an analysis of relationships with climate in the Alpine region . Global Change Biology , 16 : 2504 – 2517 .
- Butterfield , H.S. and Malmström , C.M. 2009 . The effects of phenology on indirect measures of aboveground biomass in annual grasses . International Journal of Remote Sensing , 30 : 3133 – 3146 .
- Cannell , M.G.R. and Smith , R.I. 1983 . Thermal time, chill days and prediction of budburst in Picea sitchensis . Journal of Applied Ecology , 20 : 951 – 963 .
- Carter , G.A. and Spiering , B.A. 2002 . Optical properties of intact leaves for estimating chlorophyll concentration . Journal of Environmental Quality , 31 : 1424 – 1432 .
- Chen , Q. , Hu , B. and Yu , R. 2005 . Spatial and temporal variation of phenological growing season and climate change impacts in temperate eastern China . Global Change Biology , 11 : 1118 – 1130 .
- Chmielewski , F.-M. , Müller , A. and Bruns , E. 2004 . Climate changes and trends in phenology of fruit trees and field crop in Germany, 1961–2000 . Agricultural and Forest Meteorology , 121 : 69 – 78 .
- Chuine , I. and Beaubien , E. 2001 . Phenology is a major determinant of temperate tree distributions . Ecology Letters , 4 : 500 – 510 .
- Cipar , J. , Cooley , T. and Lockwood , R. Summer to autumn changes in vegetation spectral indices of deciduous trees . Remote Sensing and Modeling of Ecosystems for Sustainability V – Proceedings of the Society of Photo-Optical Instrumentation Engineers (SPIE) . San Diego , CA . Edited by: Gao , W. and Wang , H. Vol. 7083 , pp. 8306 – 8306 . Bellingham , WA : SPIE .
- Cleland , E.E. , Chuine , I. , Menzel , A. , Mooney , H.A. and Schwartz , M.D. 2007 . Shifting plant phenology in response to global change . Trends in Ecology and Evolution , 22 : 357 – 365 .
- Croxton , P.J. , Huber , K. , Collinson , N. and Sparks , T. 2006 . How well do the Central England temperature and the England and Wales precipitation series represent the climate of the UK? . International Journal of Climatology , 26 : 2287 – 2292 .
- Curran , P.J. and Steele , C.M. 2004 . MERIS: the re-branding of an ocean sensor . International Journal of Remote Sensing , 26 : 1781 – 1798 .
- Dash , J. and Curran , P.J. 2004 . The MERIS terrestrial chlorophyll index . International Journal of Remote Sensing , 25 : 5403 – 5413 .
- Dash , J. and Curran , P.J. 2006 . Relationship between herbicide concentration during the 1960s and 1970s and the contemporary MERIS Terrestrial Chlorophyll Index (MTCI) for Southern Vietnam . International Journal of Geographical Information Science , 20 : 929 – 939 .
- Dash , J. , Curran , P.J. and Foody , G.M. 2008 . “ Remote sensing of terrestrial chlorophyll content ” . In Global Climatology and Ecodynamics: Anthropogenic Changes to Planet Earth , Edited by: Cracknell , A.P. , Krapivin , V.F. and Varotsos , C. 77 Berlin : Springer .
- Dash , J. , Jeganathan , C. and Atkinson , P.M. 2010 . The use of MERIS terrestrial chlorophyll index to study spatio-temporal variation in vegetation phenology over India . Remote Sensing of Environment , 114 : 1388 – 1402 .
- Dash , J. , Mathur , A. , Foody , G.M. , Curran , P.J. , Chipman , J. and Lillesand , T.M. 2007 . Landcover classification using multi-temporal MERIS vegetation indices . International Journal of Remote Sensing , 28 : 1137 – 1159 .
- Davids , C. and Tyler , A.N. 2003 . Detecting contamination-induced tree stress within the Chernobyl exclusion zone . Remote Sensing of Environment , 85 : 30 – 38 .
- Dawson , T.P. , North , P.R.J. , Plummer , S. and Curran , P.J. 2003 . Forest ecosystem chlorophyll content: implications for remotely sensed estimates of net primary productivity . International Journal of Remote Sensing , 24 : 611 – 617 .
- de Beurs , K.M. and Henbry , G.M. 2004 . Land surface phenology, climatic variation, and institutional change: analysing agricultural land cover change in Kazakhstan . Remote Sensing of Environment , 89 : 497 – 509 .
- Defila , C. and Clot , B. 2001 . Phytophenological trends in Switzerland . International Journal of Biometeorology , 41 : 203 – 207 .
- Deng , F.P. , Su , F.P. and Liu , C. 2007 . Seasonal variation of MODIS vegetation indexes and their statistical relationship with climate over the subtropic evergreen forest in Zhejiang, China . IEEE Transactions on Geoscience and Remote Sensing Letters , 4 : 236 – 240 .
- Eitel , J.U.H. , Long , D.S. , Gessler , P.E. and Smith , A. 2007 . Using in-situ measurements to evaluate the new RapidEye (TM) satellite series for prediction of wheat nitrogen status . International Journal of Remote Sensing , 28 : 4183 – 4190 .
- Eklundh , L. , Johansson , T. and Solberg , S. 2009 . Mapping insect defoliation in Scots pine with MODIS time-series data . Remote Sensing of Environment , 113 : 1566 – 1573 .
- Eklundh , L. and Jönsson , P. 2009 . Timesat 3.0 Software Manual , Lund : Lund University .
- Ensminger , I. , Sveshnikov , D. , Campbell , D.A. , Funk , C. , Jansson , S. , Lloyd , J. , Shibistova , O. and Oquist , G. 2004 . Intermittent low temperatures constrain spring recovery of photosynthesis in boreal Scots pine forests . Global Change Biology , 10 : 995 – 1008 .
- España-Boquera , M.L. , Cardenas-Navarro , R. , Lopez-Perez , L. , Castellanos-Morales , V. and Lobit , P. 2006 . Estimating the nitrogen concentration of strawberry plants from its spectral response . Communications in Soil Science and Plant Analysis , 37 : 2447 – 2459 .
- Fabina , N.S. , Abbott , K.C. and Gilmana , R.T. 2010 . Sensitivity of plant–pollinator–herbivore communities to changes in phenology . Ecological Modelling , 221 : 453 – 458 .
- Fisher , J.I. and Mustard , J.F. 2007 . Cross-scalar satellite phenology from ground, Landsat, and MODIS data . Remote Sensing of Environment , 109 : 261 – 273 .
- Fisher , J.I. , Mustard , J.F. and Vadeboncoeur , M.A. 2006 . Green leaf phenology at Landsat resolution: scaling from the field to the satellite . Remote Sensing of Environment , 100 : 265 – 279 .
- Fontana , F. , Rixen , C. , Jonas , T. , Aberegg , G. and Wunderle , S. 2008 . Alpine grassland phenology as seen in AVHRR, VEGETATION, and MODIS NDVI time series – a comparison with in situ measurements . Sensors , 8 : 2833 – 2853 .
- Foody , G.M. , Boyd , D.S. and Curran , P.J. 1996 . Relations between tropical forest biophysical properties and data acquired in AVHRR channels 1–5 . International Journal of Remote Sensing , 17 : 1341 – 1355 .
- Foody , G.M. and Dash , J. 2010 . Estimating the relative abundance of C3 and C4 grasses in the great plains from multi-temporal MTCI data: issues of compositing period and spatial generalizabilty . International Journal of Remote Sensing , 31 : 351 – 362 .
- Ganguly , S. , Friedl , M.A. , Tan , B. , Zhang , X. and Verma , M. 2010 . Land surface phenology from MODIS: characterisation of the collection 5 global land cover dynamics product . Remote Sensing of Environment , 114 : 1805 – 1816 .
- Gao , X. , Huete , A.R. , Ni , W.G. and Miura , T. 2000 . Optical-biophysical relationships of vegetation spectra without background contamination . Remote Sensing of Environment , 74 : 609 – 620 .
- Geerken , R. , Zaitchik , B. and Evans , J.P. 2005 . Classifying rangeland vegetation type and coverage from NDVI time series using Fourier Filtered Cycle Similarity . International Journal of Remote Sensing , 26 : 5535 – 5554 .
- Gitelson , A.A. , Keydan , G.P. and Merzlyak , M.N. 2006 . Three-band model for noninvasive estimation of chlorophyll, carotenoids, and anthocyanin contents in higher plant leaves . Geophysical Research Letters , 33 : L11402
- Gobron , N. , Belward , A. , Pinty , B. and Knorr , W. 2010 . Monitoring biosphere vegetation 1998–2009 . Geophysical Research Letters , 37 : L15402
- Gobron , N. , Pinty , B. , Melin , F. , Taberner , M. , Verstraete , M.M. , Robustelli , M. and Widlowski , J.L. 2007 . Evaluation of the MERIS/ENVISAT FAPAR product . Advances in Space Research , 39 : 105 – 115 .
- Gobron , N. , Pinty , B. , Verstraete , M.M. and Govaerts , Y. 1999 . The MERIS global vegetation index (MGVI): description and preliminary application . International Journal of Remote Sensing , 20 : 1917 – 1927 .
- Hargrove , W.H. , Spruce , J.P. , Gasser , I.E. and Hoffman , F.M. 2009 . Toward an national early warning system for forest disturbances using remotely sensed canopy phenology . Photogrammetric Engineering and Remote Sensing , 75 : 1150 – 1156 .
- Harris , A. and Dash , J. 2010 . The potential of the MERIS terrestrial chlorophyll index for carbon flux estimation . Remote Sensing of Environment , 16 : 1856 – 1862 .
- Heumann , B.W. , Seaquist , J.W. , Eklundh , L. and Jönsson , P. 2007 . AVHRR derived phenological change in the Sahel and Soudan, Africa, 1982–2005 . Remote Sensing of Environment , 108 : 385 – 392 .
- Hird , J.N. and Mcdermid , G.J. 2009 . Noise reduction of NDVI time series: an empirical comparison of selected techniques . Remote Sensing of Environment , 113 : 248 – 258 .
- Hogg , E.H. , Saugier , B. , Pontailler , J.-Y. , Black , T.A. , Chen , W. , Hurdle , P.A. and Wu , A. 2000 . Reponses of trembling aspen and hazelnut to vapor pressure deficit in a boreal deciduous forest . Tree Physiology , 20 : 725 – 734 .
- Holben , B.N. 1986 . Characteristics of maximum-value composite images from temporal AVHRR data . International Journal of Remote Sensing , 7 : 1417 – 1434 .
- Hovenden , M.J. , Wills , K.E. , Vander Schoor , J.K. , Williams , A.L. and Newton , P.C.D. 2008 . Flowering phenology in a species-rich temperate grassland is sensitive to warming but not elevated CO2 . New Phytologist , 178 : 815 – 822 .
- Huete , A. , Didan , K. , Miura , T. , Rodriguez , E.P. , Gao , X. and Ferreira , L.G. 2002 . Overview of the radiometric and biophysical performance of the MODIS vegetation indices . Remote Sensing of Environment , 83 : 195 – 213 .
- IPCC (Intergovernmental Panel on Climate Change) . 2007 . Fourth Assessment Report: Summary for Policymakers , Geneva : IPCC Secretariat .
- Jentsch , A. , Kreyling , J. , Boettcher-Treschkow , J. and Beierkuhnlein , C. 2009 . Beyond gradual warming: extreme weather events alter flower phenology of European grassland and heath species . Global Change Biology , 4 : 837 – 849 .
- Jönsson , A.M. , Eklundh , L. , Hellström , M. , Bärring , L. and Jönsson , P. 2010 . Annual changes in MODIS vegetation indices of Swedish coniferous forests in relation to snow dynamics and tree phenology . Remote Sensing of Environment , 114 : 2719 – 2730 .
- Jönsson , P. and Eklundh , L. 2002 . Seasonality extraction and noise removal by function fitting to time-series of satellite sensor data . IEEE Transactions on Geoscience and Remote Sensing , 40 : 1824 – 1832 .
- Jönsson , P. and Eklundh , L. 2004 . Timesat – a program for analyzing time-series of satellite sensor data . Computers and Geosciences , 30 : 833 – 845 .
- Julien , Y. and Sobrino , J.A. 2009 . Global land surface phenology trends from GIMMS database . International Journal of Remote Sensing , 30 : 3495 – 3513 .
- Kammer , P.M. 2002 . Developmental responses of subdominant grassland species to current weather conditions and their relevance for annual vegetation changes . Folia Geobotanica , 37 : 185 – 204 .
- Kang , S.Y. , Running , S.W. , Lim , J.H. , Zhao , M.S. and Park , C.R. 2003 . A regional phenology model for detecting onset of greenness in temperate mixed forests, Korea: an application of MODIS leaf area index . Remote Sensing of Environment , 86 : 232 – 242 .
- Kathuroju , N. , White , M.A. , Symanzik , J. , Schwartz , M.D. , Powell , J.A. and Nemani , R.R. 2007 . On the use of the advanced very high resolution radiometer for development of prognostic land surface phenology models . Ecological Modelling , 201 : 144 – 156 .
- Kimball , J.S. , McDonald , K.C. , Running , S.W. and Frokling , S.E. 2004 . Satellite radar remote sensing of seasonal growing seasons for boreal and subalpine evergreen forests . Remote Sensing of Environment , 90 : 243 – 258 .
- Kramer , K. , Leinonen , I. and Loustau , D. 2000 . The importance of phenology for the evaluation of impact of climate change on growth of boreal, temperate and Mediterranean ecosystems: an overview . International Journal of Biometeorology , 44 : 67 – 75 .
- Lemmens , C.M.H.M. , De Boeck , H.J. , Zavalloni , C. , Nijs , I. and Ceulemans , R. 2008 . How is phenology of grassland species influenced by climate warming across a range of species richness? . Community Ecology , 9 : 33 – 42 .
- Lucht , W. , Prentice , C. , Myneni , R.B. , Sitch , S. , Friedlingstein , P. , Cramer , W. , Bousquet , P. , Buermann , W. and Smith , B. 2002 . Climatic control of the high-latitude vegetation greening trend and Pinatubo effect . Science , 296 : 1687 – 1689 .
- Martinez , B. and Gilabert , M.A. 2009 . Vegetation dynamics from NDVI time series analysis using the wavelet transform . Remote Sensing of Environment , 113 : 1823 – 1842 .
- Menzel , A. 2000 . Trends in phenological phases in Europe between 1951 and 1996 . Journal of Biometeorology , 44 : 76 – 81 .
- Menzel , A. and Fabian , P. 1999 . Growing season extended in Europe . Nature , 397 : 659
- Menzel , A. , Sparks , T.H. , Estrella , N. , Kochz , E. , Aasa , A. , Ahas , R. , Alm-Kübler , K. , Bissollik , P. , Ol'ga , B. , Agrita Briedew , W. , Chmielewskizz , F.M. , Crepinsek , Z. , Curnel , Y. , Åslög , D. , Defila , C. , Donnelly , A. , Filella , Y. , Jatczak , K. , Måge , F. , Mestre , A. , Øyvind , N. , Peñuelas , J. , Perinen , P. , Remišová , R. , Scheifingerz , H. , Striz , M. , Susnik , A. , Van Vleit , A.J.H. , Wielgolaski , F.-E. , Zach , S. and Zust , A. 2006 . European phenological response to climate change matches the warming pattern . Global Change Biology , 12 : 1969 – 1976 .
- Millenium Ecosystem Assessment . 2005 . Ecosystems and Human Well-Being: Synthesis , Washington, DC : Island Press .
- Miller , J.R. , Wu , J.Y. , Boyer , M.G. , Belanger , M. and Hare , E.W. 1991 . Seasonal patterns in leaf reflectance red-edge characteristics . International Journal of Remote Sensing , 12 : 1509 – 1523 .
- Molod , A. , Salmun , H. and Waugh , D.W. 2003 . A new look at modeling surface heterogeneity: extending its influence in the vertical . Journal of Hydrometeorology , 4 : 810 – 825 .
- Morisette , J.T. , Richardson , A.D. , Knapp , A.K. , Fisher , J.I. , Graham , E.A. , Abatzoglou , J. , Wilson , B.E. , Breshears , D.D. , Henebry , G.M. , Hanes , J.M. and Liang , L. 2009 . Tracking the rhythm of the seasons in the face of global change: phenological research in the 21st century . Frontiers in Ecology and the Environment , 7 : 253 – 260 .
- Myneni , R.B. , Keeling , C.D. , Tucker , C.J. , Asrar , G. and Nemani , R.R. 1997 . Increased plant growth in the northern high latitudes from 1981–1991 . Nature , 386 : 698 – 702 .
- Nigh , G.D. 2006 . Impact of climate, moisture regime, and nutrient regime on the productivity of Douglas-fir in coastal British Columbia, Canada . Climatic Change , 76 : 321 – 337 .
- O'Connor , B. , Dwyer , N. and Cawkwell , F. On a methodology to extract measures of seasonality from MERIS reduced resolution data to characterise seasonal trends in Irish vegetation . New Dimensions in Earth Observation: Proceedings of RSPSoc 2009 Annual Conference . University of Leicester , Leicester . Edited by: Tansey , K. pp. 244 – 248 . Leicester : University of Leicester .
- Olsson , L. , Eklundh , L. and Ardo , J. 2005 . A recent greening of the Sahel – trends, patterns and potential causes . Journal of Arid Environments , 63 : 556 – 566 .
- Parmesan , C. and Yohe , G. 2003 . A globally coherent fingerprint of climate change impacts across natural systems . Nature , 421 : 37 – 42 .
- Perry , M. and Hollice , P. 2005 . The development of a new set of long-term climate averages for the UK . International Journal of Climatology , 25 : 1023 – 1039 .
- Piao , S. , Fang , J. , Ji , W. , Guo , Q. , Ke , J. and Tao , S. 2004 . Variation in a satellite-based vegetation index in relation to climate in China . Journal of Vegetation Science , 15 : 219 – 226 .
- Piao , S. , Fang , J. , Zhou , L. , Ciais , P. and Zhu , B. 2006 . Variations in satellite-derived phenology in China's temperate vegetation . Journal of Global Change Biology , 12 : 672 – 685 .
- Piao , S. , Fang , J. , Zhou , L. , Guo , Q. , Henderson , M. , Ji , W. , Li , Y. and Tao , S. 2003 . Interannual variations of monthly and seasonal normalized difference vegetation index (NDVI) in China from 1982 to 1999 . Journal of Geophysical Research , 108 : 1 – 12 .
- Reed , B.C. 2006 . Trend analysis of time-series phenology of North America derived from satellite data . GIScience and Remote Sensing , 43 : 24 – 38 .
- Reed , B.C. , Brown , J.F. , Vander-Zee , D. , Loveland , T.R. , Merchant , J.W. and Ohlen , D.O. 1994 . Measuring phenological variability from satellite imagery . Journal of Vegetation Science , 5 : 703 – 714 .
- Reed , B.C. , Schwartz , M.D. and Xiao , X. 2009 . “ Remote sensing phenology: status and the way forward ” . In Phenology of Ecosystem Processes: Applications in Global Change Research , Edited by: Noormets , A. 231 New York : Springer .
- Reed , B.C. , White , M. and Brown , J.F. 2003 . “ Remote sensing phenology ” . In Phenology: An Integrative Environmental Science , Edited by: Schwartz , M.D. 365 Dordrecht : Kluwer Academic .
- Richardson , A.D. , Black , T.A. , Ciais , P. , Delbart , N. , Friedl , M.A. , Gobron , N. , Hollinger , D.Y. , Kutsch , W.L. , Longdoz , B. , Luyssaert , S. , Migliavacca , M. , Montagnani , L. , Munger , J.W. , Moors , E. , Piao , S. , Rebmann , C. , Reichstein , M. , Saigusa , N. , Tomelleri , M. , Vargas , R. and Varlagin , A. 2010 . Influence of spring and autumn phenological transitions on forest ecosystem productivity . Philosophical Transactions of the Royal Society B , 365 : 3227 – 3246 .
- Roetzer , T. , Wittenzeller , M. , Haeckel , H. and Nekovar , J. 2000 . Phenology in central Europe – differences and trends of spring phenophases in urban and rural areas . International Journal of Biometeorology , 44 : 60 – 66 .
- Root , T.L. , Price , J.T. , Hall , K.R. , Schneider , S.H. , Rosenzweig , C. and Pounds , J.A. 2003 . Fingerprints of global warming on wild animals and plants . Nature , 421 : 57 – 60 .
- Schwartz , M.D. 1999 . Advancing to full bloom: planning phenological research for the 21st century . International Journal of Biometeorology , 42 : 113 – 118 .
- Seaquist , J.W. , Hickler , T. , Eklundh , L. , Ardo , J. and Heumann , B.W. 2009 . Disentangling the effects of climate and people on Sahel vegetation dynamics . Biogeosciences , 6 : 469 – 477 .
- Sexias , J. , Carvalhais , N. , Nunes , C. and Benali , A. 2009 . Comparative analysis of MODIS-FAPAR and MERIS-MGVI datasets: potential impacts on ecosystem modelling . Remote Sensing of Environment , 113 : 2547 – 2559 .
- Sparks , T.H. , Croxton , P.J. , Collinson , N. and Taylor , P.W. 2005 . Examples of phenological change, past and present, in UK farming . Annals of Applied Biology , 146 : 531 – 537 .
- Steinaker , D.F. and Wilson , S.D. 2008 . Phenology of fine roots and leaves in forest and grassland . Journal of Ecology , 96 : 1222 – 1229 .
- Steven , M.D. , Malthus , T.J. , Baret , F. , Xu , H. and Chopping , M.J. 2003 . Intercalibration of vegetation indices from different sensor systems . Remote Sensing of Environment , 88 : 412 – 422 .
- Stöckli , R. and Vidale , P.L. 2004 . European plant phenology and climate as seen in a 20-year AVHRR land-surface parameter dataset . International Journal of Remote Sensing , 17 : 3303 – 3330 .
- Studer , S. , Appenzeller , C. and Defila , D. 2005 . Inter-annual variability and decadal trends in alpine spring phenology: a multivariate analysis approach . Climatic Change , 73 : 395 – 414 .
- Studer , S. , Stockli , R. , Appenzeller , C. and Vidale , P.L. 2007 . A comparative study of satellite and ground-based phenology . International Journal of Biometeorology , 51 : 405 – 414 .
- Tao , F. , Yokozawa , M. , Zhang , Z. , Hayashi , Y. and Ishigooka , Y. 2008 . Land surface phenology dynamics and climate variations in the North East China Transect (NECT), 1982–2000 . International Journal of Remote Sensing , 29 : 5461 – 5478 .
- Verstraete , M.M. , Gobron , N. , Aussedat , O. , Robustelli , M. , Pinty , B. , Widlowski , J.L. and Taberner , M. 2008 . An automatic procedure to identify key vegetation phenology events using the JRC-FAPAR products . Advances in Space Research , 41 : 1773 – 1783 .
- Verstraete , M.M. , Pinty , B. and Curran , P.J. 1999 . MERIS potential for land applications . International Journal of Remote Sensing , 20 : 1747 – 1756 .
- Walther , G.R. , Post , E. , Convey , P. , Menzel , A. , Parmesan , C. , Beebee , T.J.C. , Fromentin , J.M. , Hoegh-Guldberg , O. and Bairlein , F. 2002 . Ecological responses to recent climate change . Nature , 416 : 389 – 395 .
- White , M.A. , de Beurs , K.M. , Didan , K. , Inouye , D.W. , Richardson , A.D. , Jensen , O.P. , O'Keefe , J. , Zhang , G. , Nemani , R.R. , Van Leeuwen , W.J.D. , Brown , J.F. , De Witt , A. , Schaepman , M. , Lin , X. , Dettinger , M. , Bailey , A.S. , Kimball , J. , Schwartz , M.D. , Baldocchi , D.D. , Lee , J.T. and Lauenroth , W.K. 2009 . Intercomparison, interpretation, and assessment of spring phenology in North America estimated from remote sensing for 1982–2006 . Global Change Biology , 15 : 2335 – 2359 .
- White , M.A. , Thornton , P.E. and Running , S.W. 1997 . A continental phenology model for monitoring vegetation responses to inter-annual climatic variability . Global Biogeochemical Cycles , 11 : 217 – 234 .
- Wilson , K.B. and Baldocchi , D.D. 2000 . Seasonal and interannual variability of energy fluxes over a broadleaved temperate deciduous forest in North America . Agricultural and Forest Meteorology , 100 : 1 – 18 .
- Wu , C.Y. , Niu , Z. , Tang , Q. , Huang , W.J. , Rivard , B.M. and Feng , J.L. 2009 . Remote estimation of gross primary production in wheat using chlorophyll-related vegetation indices . Agricultural and Forest Meteorology , 149 : 1015 – 1021 .
- Xiao , X. , Zhang , Q. , Braswell , B. , Urbanski , S. , Boles , S. , Wofsy , S. , Moore III , B. and Ojima , B. 2004 . Modeling gross primary production of temperate deciduous broadleaf forest using satellite images and climate data . Remote Sensing of Environment , 91 : 256 – 270 .
- Zarco-Tejada , P.J. , Miller , J.R. , Noland , T.L. , Mohammed , G.H. and Sampson , P.H. 2001 . Scaling-up and model inversion methods with narrowband optical indices for chlorophyll content estimation in closed forest canopies with hyperspectral data . IEEE Transactions on Geoscience and Remote Sensing , 39 : 1491 – 1507 .
- Zhang , X. , Friedl , M.A. , Crystal , B. , Schaaf , A. , Strahler , A. and Liu , Z. 2005 . Monitoring the response of vegetation phenology to precipitation in Africa by coupling MODIS and TRMM instruments . Journal of Geophysical Research , 110 : 1 – 14 .
- Zhang , X. , Friedl , M.A. and Schaaf , B.C. 2006 . Global vegetation phenology from moderate resolution imaging spectro-radiometer (MODIS): evaluation of global patterns and comparison with in situ measurements . Journal of Geophysical Research , 111 : 1 – 14 .
- Zhang , X. , Friedl , M.A. and Schaaf , B.C. 2009 . Sensitivity of vegetation phenology detection to the temporal resolution of satellite data . International Journal of Remote Sensing , 30 : 2061 – 2074 .
- Zhang , X. , Friedl , M.A. , Schaaf , B.C. and Strahler , A.H. 2004 . Climate controls on vegetation phenological patterns in northern mid- and high latitudes inferred from MODIS data . Journal of Global Change Biology , 10 : 1133 – 1145 .
- Zhang , X. , Friedl , M.A. , Schaaf , C.B. , Strahler , A.H. , Gao , F. , Hodges , J.F. , Reed , B.C. and Heute , A. 2003 . Monitoring vegetation phenology using MODIS . Remote Sensing of Environment , 84 : 471 – 475 .
- Zhang , X. , Goldberg , M. , Tarpley , D. , Friedl , M.A. , Morisette , J. , Kogan , F. and Yu , Y. 2010 . Drought-induced vegetation stress in southwestern North America . Environmental Research Letters , 5 : 1 – 11 .
- Zhou , L.M. , Tucker , C.J. , Kaufmann , R.K. , Slayback , D. , Shabanov , N.V. and Myneni , R.B. 2001 . Variations in northern vegetation activity inferred from satellite data of vegetation index during 1981 to 1999 . Journal of Geophysical Research , 106 : 20069 – 20083 .
- Zurita-Milla , R. , Kaiser , G. , Clevers , J.G.P.W. , Schneider , W. and Schaepman , M.E. 2009 . Downscaling time series of MERIS full resolution data to monitor vegetation seasonal dynamics . Remote Sensing of Environment , 113 : 1874 – 1885 .
- Zwiazek , J.J. , Renault , S. , Croser , C. , Hansen , J. and Beck , E. 2001 . “ Biochemical and biophysical changes in relation to cold hardiness ” . In Conifer Cold Hardiness , Edited by: Bigras , F.J. and Colombo , S.J. 65 Dordrecht : Kluwer Academic .