
ABSTRACT
The fully automatic generation of digital surface models (DSMs) is still an open research issue. From recent years, computer vision algorithms have been introduced in photogrammetry in order to exploit their capabilities and efficiency in three-dimensional modelling. In this article, a new tool for fully automatic DSMs generation from high resolution satellite optical imagery is presented. In particular, a new iterative approach in order to obtain the quasi-epipolar images from the original stereopairs has been defined and deployed. This approach is implemented in a new Free and Open Source Software (FOSS) named Digital Automatic Terrain Extractor (DATE) developed at the Geodesy and Geomatics Division, University of Rome ‘La Sapienza’, and conceived as an Open Source Software Image Map (OSSIM) plug-in. DATE key features include: the epipolarity achievement in the object space, thanks to the images ground projection (Ground quasi-Epipolar Imagery (GrEI)) and the coarse-to-fine pyramidal scheme adopted; the use of computer vision algorithms in order to improve the processing efficiency and make the DSMs generation process fully automatic; the free and open source aspect of the developed code. The implemented plug-in was validated through two optical datasets, GeoEye-1 and the newest Pléiades-high resolution (HR) imagery, on Trento (Northern Italy) test site. The DSMs, generated on the basis of the metadata rational polynomial coefficients only, without any ground control point, are compared to a reference lidar in areas with different land use/land cover and morphology. The results obtained thanks to the developed workflow are good in terms of statistical parameters (root mean square error around 5 m for GeoEye-1 and around 4 m for Pléiades-HR imagery) and comparable with the results obtained through different software by other authors on the same test site, whereas in terms of efficiency DATE outperforms most of the available commercial software. These first achievements indicate good potential for the developed plug-in, which in a very near future will be also upgraded for synthetic aperture radar and tri-stereo optical imagery processing.
1. Introduction
In this article, we present a new Free and Open Source Software (FOSS), named Digital Automatic Terrain Extractor (DATE), able to generate digital surface models (DSMs) from high resolution optical satellite imagery acquired by the most common sensors.
At present, as a matter of fact, there is a huge literature about the DSMs generation from high resolution optical satellite imagery (Habib et al. Citation2004; Jacobsen Citation2006; Toutin 2006a, Citation2006b; Zhang and Gruen Citation2006; Büyüksalih and Jacobsen Citation2007; Alobeid and Jacobsen Citation2008; d’Angelo et al. Citation2008; Crespi et al. Citation2010; Capaldo, Crespi, Fratarcangeli, Nascetti, and Pieralice Citation2012; Dowman et al. Citation2012; Aguilar et al. Citation2014; Reinartz et al. Citation2014; Gong and Fritsch Citation2016; Ghuffar Citation2016, etc.), and for some years there are different commercial and scientific software able to process high resolution satellite optical imagery and to generate DSMs, amongst which the well known PCI-Geomatica, ENVI (software, as PCI-Geomatica and SAT-PP), and SAT-PP. Unfortunately, none of them is available as a FOSS, and only recently SP2 software was jointly developed by CMLA and CNES as an open source software for DSM generation from satellite data, in the frame of the Pléiades mission. Anyway, S2P works according to a different approach with respect to DATE; as a matter of fact, it implements a tile-wise processing chain aimed to achieve epipolar approximations processing satellite images by small tiles (de Franchis et al. 2014a, Citation2014b) instead of the epipolarity achievement in the object space and the iterative coarse-to-fine pyramidal scheme adopted in DATE (see Section 2).
DATE is a totally automatic console application conceived as an Open Source Software Image Map (OSSIM) plug-in; it has been developed starting from summer 2014 in the framework of 2014 Google Summer of Code, within a project entitled ‘Photogrammetric image processing: DSM generation tool for OSSIM’ (Di Rita Citation2014).
OSSIM is a FOSS for Geospatial (FOSS4G) (Moreno-Sanchez Citation2012), that shows up as a set of libraries and applications for image, maps and terrain data processing; it belongs to the wide Open Source Geospatial Foundation (OSGeo) family, has been actively developed since 1996 and appears with a great amount of features and a very robust architecture (OSSIM wiki Citation2015). Amongst other benefits, OSSIM is able to handle a large amount of data as it manages to process different images in a sequential and totally automatic way.
Having been developed as an OSSIM plug-in, also DATE appears as a FOSS4G, that is its source code is accessible, usable for any purpose, modifiable and redistributable. It is well known that, if a software source code is not accessible, it cannot be improved nor finely adapted to the user needs. On the contrary an Open Source Software (OSS) carries various benefits: if everyone can access the source code this leads to a rapid development of high class software, increasing the stability by skilled community review. Furthermore, in general an OSS appears with a high degree of modularity that enables an easy functionalities expansion and has the potential of breaking the project into small pieces and assigning them to different developers (Câmara and Fonseca Citation2007).
The goal of the article is, therefore, to describe DATE characteristics and functioning and to present and discuss some results as well comparisons with another renowned commercial software. In Section 2, the DATE plug-in workflow is described, pointing out its main technical features with references to relevant documents; in Section 3, the results related to some tests performed using GeoEye-1 and Pléiades-high resolution (HR) imagery are presented and discussed, also introducing a comparison with PCI-Geomatica commercial software; finally in Section 4, some conclusions are drawn and future prospects are outlined.
2. DATE workflow
A new tool for automatic DSM generation has been developed and various algorithms have been adapted and implemented in order to generate a DSM from an optical satellite stereopair in a totally automatic way. In particular, a new iterative strategy, in order to obtain a robust solution in terms of quasi-epipolar images achieved from the original stereopairs, has been defined and deployed.
The implemented tool is based on a hybrid approach, whereby photogrammetric and computer vision algorithms are mixed in order to take the best of both, with the aim to develop a fully automatic, efficient, precise, and accurate tool. The synergy between computer vision and photogrammetry has taken hold over a decade ago, and it has already returned outstanding results (Pierrot-Deseilligny and Isabelle Citation2011).
Our approach is based on two well-known assumptions. First of all, assuming to have two or more satellite images acquired over the same area, if we know exactly the orientation for each image and we know perfectly the morphology of the area (DSM), all these images orthorectified using this DSM produce equal orthoimages in the same reference frame, apart from local occlusions and radiometric differences. Second, it is well known that satellite pushbroom sensors acquire different images on the same orbit (including stereopairs and triplets) with smooth changes of attitude over time; these changes can be modelled with low-degree polynomial functions (usually up to third degree), so that the images can be reprojected in a quasi-epipolar geometry (Toutin Citation2004; Poli Citation2005; Crespi et al. Citation2012), without making use of the rigorous epipolar geometry, that is not straightforward with imagery acquired by pushbroom sensors differently from standard imagery with one projection centre only. Moreover, assuming that possible orientation errors can be previously corrected with ground information (ground control points (GCPs)), orthorectification errors are mainly due to DSM inaccuracy.
Therefore, the leading idea is that the orthoimages generated using an a priori (known, but generally coarse) DSM are affected by local pixel disparities lined up in a prevailing direction. For instance, in the simplest case of an along-track stereopair, this direction is approximately North–South. We define these orthorectified images Ground quasi-Epipolar Imagery (GrEI) from now on. Our goal is to iteratively refine the a priori DSM until the disparities are reduced as much as possible; the obtained DSM is just our final product. Of course, DSM errors can cause also transversal parallaxes with respect to the mentioned prevailing direction, hindering the quasi-epipolarity condition and the DSM iterative refinement. Therefore, it is important to keep the transversal parallax errors well below the imagery resolution at each iteration; this is achieved adopting a coarse-to-fine pyramidal scheme.
Raw satellite images resolution is initially reduced by a downsampling factor that ranges between 20 and 10, then these sampled images are projected in a ground geometry using an a priori (freely available) DSM, in order to generate orthorectified images with a transversal parallax error below the initial reduced resolution. These orthorectified images can act as GrEI and can undergo a dense image matching procedure at the chosen reduced resolution, obtaining the initial DSM corresponding to the first pyramidal level; this DSM is the input for the next pyramidal level, acting as the new a priori DSM.
The procedure is iteratively applied, increasing the resolution when passing from a pyramidal level to the next one, until the desired final resolution is achieved. It is quite evident that in this way at lower resolution it is possible to detect larger structures (low frequency) whereas at higher resolutions small details are progressively added to the already obtained DSM.
So far, only some of the whole parameters are exposed to the user, hence not all of them are easily tunable from the command line. Between these, the search area for the dense matching (see Subsection 2.3), which should be changed by the user according to the area morphology complexity, as well the possibility to adapt the plug-in also for across-track images, are parameters now editable just from the source code by expert users.
Overall, the DSM generation processing chain consists of the following main steps hereafter illustrated:
images orthorectification
GrEI generation
dense image matching and disparity map generation
DSM generation
2.1. Images orthorectification
As already mentioned, raw satellite images are projected in a ground geometry using a coarse DSM (e.g. Shuttle Radar Topographic Mission (SRTM), Advanced Spaceborne Thermal Emission and Reflection Radiometer (ASTER) global digital elevation model (GDEM), AW3D30) or other freely available DSMs for the area of interest; this is done using the image orientations based on the rational polynomial coefficients (RPCs) metadata through the OSSIM built-in RPCs-based orientation model (OSSIM wiki Citation2015), available for the most common sensors and easily upgradable to the upcoming ones due to the modular structure of this tool. As a matter of fact DATE plug-in has been already tested, with good results, with images acquired by quite new satellites such as ZY-3 (Fratarcangeli et al. Citation2016).
If the orientations of all the images were fully consistent, so that also all the images relative orientation would not display global transversal parallax errors at the adopted resolution, the orthorectified images generated in this way could be considered as GrEI at each pyramidal level and would satisfy the quasi-epipolar condition. This is a general assumption, this is not the case, so that an additional check, with possible transformation estimation, must be done for the actual GrEI generation.
2.2. GrEI generation
In order to generate GrEI, the following modified similarity transformation (Equation (1)) is estimated using a set of well-identified Tie Points (TPs). As a matter of fact, thanks to the TPs and according to the Equation (1), a (small) rotation and a translation to be applied to the slave image are estimated. Orthoimages are therefore aligned in the disparity prevailing direction and a potential shift (mean rotation and transversal parallax), caused by systematic error in the image relative orientation based on metadata RPCs, is removed:
The model takes into account that each TPs can have whatever disparity value on the x coordinates, in order to return null y mean transversal parallax.
The model is clearly nonlinear, and it should be linearized as follows in order to solve it with a least squares approach. Under the hypothesis of small rotation angle , the following expressions are obtained:
By linearizing with respect to the disparity D in the point med the equations become
As is a second-order term, it is possible to simplify and order the other terms as follows:
The model can be written in a matrix form considering a set of n TPs:
where
,
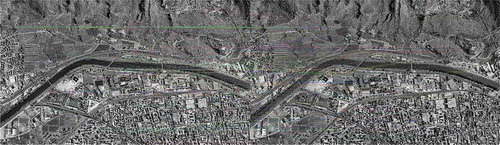
In particular, the TPs are homogeneously identified and matched on the orthoimages, exploiting scale-invariant feature transform (SIFT)-oriented OpenCV library algorithms and an OpenCV class, named Grid Adapted Feature Detector, adapting a detector to divide the source image into a grid and detect points in each cell ().
Figure 1. TPs distribution for a GeoEye-1 stereopair tile before the filtering phase (globally 500 TPs were automatically selected).
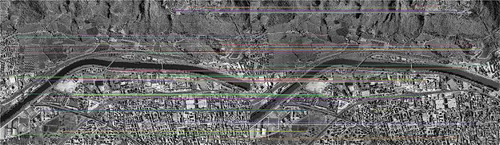
After the TPs identification phase, a specifically designed filter is employed to select only the most reliable TPs: first the 2% of the most reliable points is selected based on the higher feature descriptor values (representing a keypoint invariant description used to describe the similarity level between the matched points) computed with the Brief Descriptor Extractor OpenCV algorithm. Then a parallax threshold is set up in the y-direction in order to discard, amongst the remaining TPs, the points with the highest parallax values. At the end, a 3-sigma test is performed in order to remove residual outliers. As shown in , after this thorough filtering chain only the most reliable TPs are kept.
Figure 2. TPs distribution for a GeoEye-1 stereopair tile after the filtering phase (globally 128 TPs were automatically finally accepted).
2.3. Dense image matching and disparity map generation
At each pyramidal level a disparity map for the stereopair is computed using the semi-global matching (SGM) algorithm by Hirschmüller (Citation2008) as implemented in OpenCV library (2015); this is actually the Semi-Global Block Matching (SGBM) algorithm, that differs from the original one for considering only five research directions instead of eight (even if it is possible to run the full variant of the algorithm, yet consuming a lot of memory), for matching not individual pixels but blocks of pixels (even if changing the default parameter it is possible to reduce the blocks to single pixels) and for having implemented a simpler Birchfield–Tomasi sub-pixel metric (Birchfield and Tomasi Citation1998) instead of a mutual information cost function.
It must be recalled that the OpenCV SGBM code only allows the use of 8 bit images, instead of the 11, 12, or 16 bit satellite imagery. This could lead to a compression of the range of radiometric values. Nevertheless, the majority of satellite images indeed present a non-uniform and mostly compressed radiometric distribution. The idea is to use the OpenCV SGBM having preliminarily reduced the bit depth considering a 95th percentile and through a successive radiometric scaling between 0 and 255. For the majority of the satellite images this leads to a negligible loss of radiometric information. As a matter of fact, for example, in the case of an 11-bit image such as GeoEye-1, the 95% of values is in the range 70–370 (). So in this case, starting from the 2048 nominal values, just about 300 of them are used, what is a value much more close to an 8 bit than to an 11 bit image. At the moment, this approximation is considered acceptable given the SGBM usefulness in terms of efficiency.
Figure 3. Radiometric histogram for GeoEye-1 imagery.
Note that using GrEI the disparity maps obtained at each pyramidal level are in the same reference frame of the a priori DSM, and the local pixel disparity values are proportional to the height correction that will be applied to the a priori DSM.
In , an example of a disparity map computed from a GeoEye-1 stereopair on the Trento test site is reported.
Figure 4. Disparity map of a GeoEye-1 stereopair tile.
2.4. From pixel disparity to DSM generation
The obtained local pixel disparity values are converted into height corrections with respect to the used a priori DSM through an efficient procedure based on the computation of a disparity-to-height conversion factor (Cfactor) exploiting RPCs model ().
Figure 5. General workflow from pixel disparity to generated DSM.
In particular a constant Cfactor is computed starting from the metadata RPCs on nine points located along the imaged area borders (). Specifically, at each point the minimum (hmin) and the maximum height (hmax) in the image are considered, in order to be sure to analyse the complete height range of the imaged area. Through RPCs application (ground-to-image transformation) the corresponding minimum and maximum image points (Imin, Imax) in master and slave images are computed, under the hypothesis that the disparity prevailing direction is aligned with an axis of the image coordinates (here chosen as the I-axis); this hypothesis is well satisfied for images acquired along the same orbit. Then, through master and slave – Imin computation, the global difference along I-direction is calculated (
=
master
slave), corresponding to the maximum height difference (
– hmin) for each point; the final Cfactor used to transform disparities to height corrections is just the mean over these nine values:
Figure 6. Sketch map for Cfactor computation with the nine points along the imaged area borders.
It has been evaluated that the conversion factor Cfactor computed in this way causes a maximum error in the correction of the initial reference DSM in the region of decimetre, consistent with the desired final accuracy.
The obtained height corrections are then summed up to the height of the a priori DSM at each pyramidal level iteration. At the moment, in the no-matched areas, such as the black ones in , the SRTM value is left unchanged without summing up any height correction.
As last step of the deployed workflow, the geocoded DSM is saved in a standard geotiff format, exploiting OSSIM file handling functionalities.
3. DATE testing
The presented method for automatic DSM generation has been tested with Pléiades-HR (Pléiades-HR info-page Citation2015) and GeoEye-1 (GeoEye-1 info-page Citation2015) satellite optical imagery. To show and analyse DATE behaviour and performance, DSMs in areas with different land use/land cover and morphology and in the whole image footprint have been generated and evaluated for both satellite data. The DSMs have been generated with a cell grid at 1.0 ×1.0 m, since it has been seen through some experimental tests that increasing the resolution in the coarse-to-fine pyramidal scheme no valuable information, only noise, is added to the final extracted DSM. In order to evaluate the optimal DSM resolution in relation to the raw image resolution, it is important to consider that the inputs of the SGBM are the GrEI. GrEI are generated starting from the full resolution raw images, and, to correctly choose the DSM final resolution, the maximum information transferable during this re-projection process should be taken into account (Crespi and Laura Citation2009). In this sense, all the radiometric information content of the full resolution imagery is exploited reaching 1 m resolution.
In order to assess the obtained results, a 2.5D comparison with respect to a reference DSM was performed. The reference dataset used to assess the generated DSMs in this work is a lidar DSM with grid posting 1.0 ×1.0 m and a mean elevation accuracy of 0.25 m, freely available on the website of ‘Provincia Autonoma di Trento’ (http://www.territorio.provincia.tn.it).
3.1. Analysed satellite imagery dataset
The available data set consists of three along-track Pléiades-HR and two along-track GeoEye-1 optical images referring to the same test site, this is the area of Trento, Italy.
Located in the Northeast part of Italy, the test site lies in a valley at an average altitude around 200 m, surrounded by very steep slopes and Alps peaks up to 2100 m. It includes urban areas with residential, industrial and commercial buildings with different sizes and heights, agricultural and forested areas, offering, therefore, a very heterogeneous landscape in terms of morphological complexity, land use, and land cover (Agugiaro, Poli, and Remondino Citation2012).
The images composing the triplet, hereafter called image 01, image 02, and image 03, were acquired in August 2012 in North–South direction. The average incidence angles of the three images are, respectively, 13°, –13°, and –19° in along-track direction with respect to the nadir and close to zero in across-track direction. Thanks to the fast scanning, the illumination conditions are almost constant during the acquisitions. The data include metadata files together with their original RPCs. The three images cover an area of about 392 km2 on the Trento test site that already includes images from other very high resolution (VHR) satellite sensors. The native mean ground sample distance (GSD) varies between 0.72 and 0.78 m depending on the viewing direction, even if the images are oversampled and supplied to the user with a 0.50 m GSD.
The GeoEye-1 stereopair has been acquired in September 2011 and shows 100% overlap; it is provided as GeoStereo product, that is, the images are projected to a constant base elevation. The available bands are the panchromatic one and four multispectral bands (blue, green, red, and near-infrared). The images cover an area of 10 ×10 km with a GSD equal to 0.50 m. For each image the metadata RPCs were provided too.
3.2. Results analysis and DSMs validation
The height differences between the DSM generated with DATE and the lidar DSM were computed together with their statistics (root mean square error (RMSE), standard deviation, bias, and LE95) both for Pléiades-HR and GeoEye-1 imagery. These statistics used for the DSMs assessment are those usually adopted for the assessment of the global DSMs (as SRTM, ASTER, TANDEM-X DSMs) ((Rodriguez, Morris, and Belz Citation2006; Gesch, Oimoen, and Evans Citation2014).
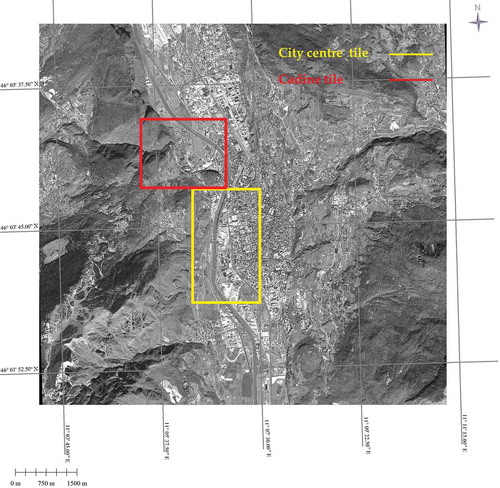
In particular the entire tile, the city centre tile, characterized by small adjacent buildings and narrow streets, and the so called Cadine tile, with large buildings and a steep mountainous area, have been investigated for both datasets ().
Figure 7. Locations of the analysed tiles.
Furthermore, a comparison between the DSMs generated by DATE and the results obtained through the OrthoEngine photogrammetric tool embedded in the last version of the commercial software PCI-Geomatica has been carried out for both datasets. OrthoEngine supports images from standard aerial, optical and synthetic aperture radar (SAR) satellite sensors. It adopts the normalized cross-correlation (NCC) matching algorithm; as known, this method finds the relative shift (disparity) between corresponding points (actually windows) over the two images by maximizing the cross-correlation coefficient of the grey values within these windows. A Minimum Acceptance Score has to be selected, in order to state a threshold for the minimum match quality; here, the default value is used (0.75). NCC matching strategy supplies good results when the two images have similar grey values and appearances, and also in case of rotation or image size error. Anyway, also with this matching strategy the obtained DSMs have to be refined to enhance the output quality by interpolating the failed areas and filtering the elevation values automatically according to the Automatic DEM Extraction PCI procedure.
It is important to recall that for both sensors and with both software DSMs were generated on the basis of the metadata RPCs only, without any orientation correction based on GCPs.
Regarding the Pléiades-HR dataset for the sake of brevity only the results related to the 01–03 pair are reported. Among the three analysed (this is 01–02 pair, 02–03 pair, and 01–03 pair), this one has been chosen, since it produces the best results both with DATE plug-in and PCI-Geomatica software.
It can be seen in that the entire tile produces higher RMSE values than the two other tiles. Note that the bias is positive when the reference lidar height is above the extracted DSM.
Table 1. DSMs assessment for Pléiades-HR dataset.
As concern the GeoEye-1 stereopair the statistic parameters trend is the same: higher values for the entire area, lower values for the city centre tile (). Furthermore, the values obtained through PCI processing for this dataset are better than the results obtained on the reciprocal tiles with Pléiades-HR imagery.
Table 2. DSMs assessment for GeoEye-1 dataset.
Generally speaking, DSMs generated with the two software produce statistic parameters quite similar, with slight better performances of DATE with Pléiades-HR and of PCI with GeoEye-1, even if it is necessary to underline that DATE plug-in shows high performances in terms of efficiency: as a matter of fact, as showed in , it is about three times faster than PCI-Geomatica (using a workstation Intel CoreTM i7-4770 CPU @ 3.40 GHz ×8, 64-bit OS, 32GB memory).
Table 3. Mean processing time (whole tile).
Besides, it is evident that, even if the GSD used for the processing is the same, Pléiades-HR dataset performs a bit worse than GeoEye-1. This could be due to the different native GSD that is 0.50 m for GeoEye-1 and between 0.72 and 0.78 m for Pléiades-HR imagery.
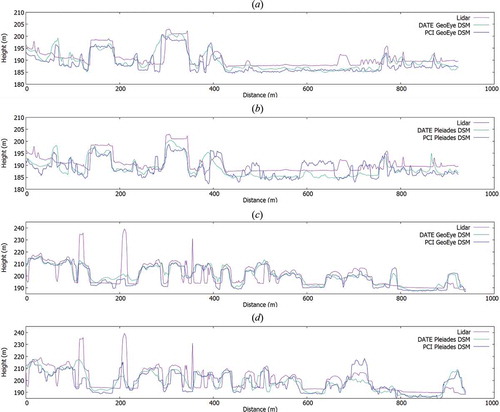
Furthermore, by visual inspection, the terrain profile obtained with DATE plug-in appears well modelled, even in very steep areas, both for GeoEye-1 and Pléiades-HR derived DSMs ( and ).
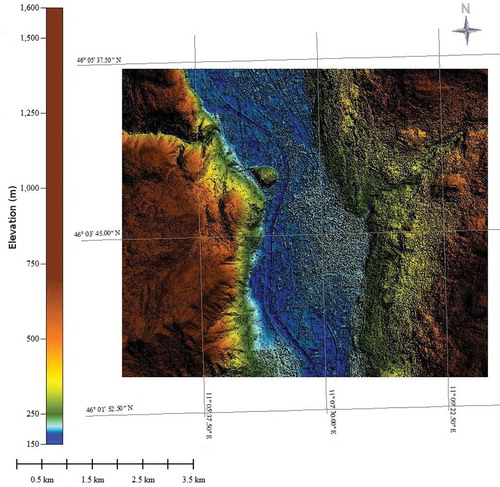
Figure 8. DSM obtained from GeoEye-1 imagery with DATE plug-in.
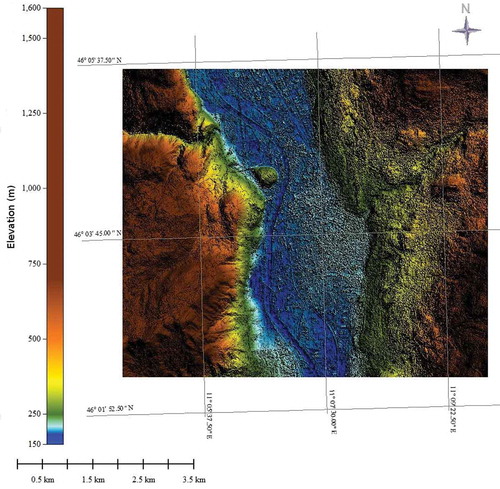
Figure 9. DSM obtained from Pléiades-HR imagery with DATE plug-in.
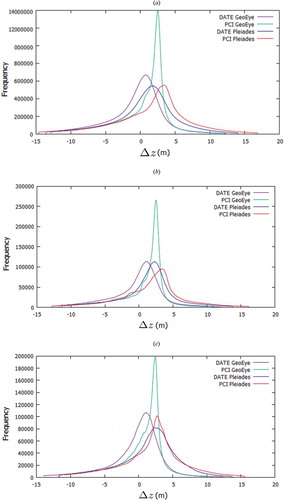
The height discrepancies (z) histograms of the generated DSMs are reported in . It is evident that the DSMs generated with PCI software from GeoEye-1 imagery have a different behaviour with respect to the others, since they present a peak in the histograms at approximately 2.5 m. This underlines the fact that PCI software is able to generate DSMs from GeoEye-1 imagery which better reconstruct the buildings height. The mode value is strictly connected to the bias with respect to the reference lidar, probably due to RPCs inaccuracy, that can be seen in . All the other histograms present a more gaussian shape.
Figure 10. DSM height discrepancies histograms for (a) entire tile, (b) city centre tile, and (c) Cadine tile.
As a further analysis, in and , the reference lidar DSM, the DSMs generated, and the error map for two different areas (a central urban area and a more flat one) of the entire tile are presented. From the analysis of the error maps, a good agreement between the DSMs extracted and lidar DSM is shown. Both error maps and the sections reported in show a height overestimation of some narrow streets and an underestimation of height building; as a matter of fact in the central area it is evident how the highest buildings are well located with both software but not as well reconstructed. Furthermore, in other areas of the graphs, a bias with respect to the reference lidar, probably due to RPCs inaccuracy, is evident both for DSMs generated with DATE and PCI software.
Figure 11. DSMs (a–e) and corresponding error maps (f–i) with respect to the lidar DSM, generated for a central area with DATE and PCI software, both with GeoEye-1 and Pléiades-HR imagery.
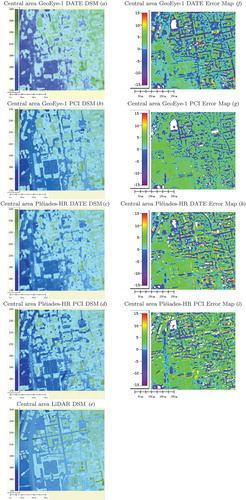
Figure 12. DSMs (a–e)) and corresponding error maps (f–i)) with respect to the lidar DSM, generated for a flat area with DATE and PCI software, both with GeoEye-1 and Pléiades-HR imagery.
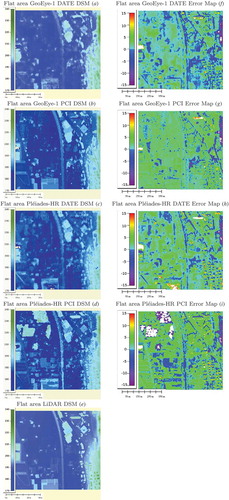
Figure 13. Sections on (a) flat area with GeoEye-1 DSMs, (b) flat area with Pleiades DSMs, (c) central area with GeoEye-1 DSMs, (d) central area with Pleiades DSMs, with reference to the tiles analysed in (a–i) and 12(a–i).
A final remark concerns the a priori DSM used for DATE processing; as mentioned SRTM was used, so that the question arises if the iterative processing was really able to enhance the a priori known morphology, adding details and increasing the accuracy. This was certainly the case since the SRTM accuracy over the whole area is around 10 m, and in the urban tile it is around 6 m, values close to those presented in (Fratarcangeli et al. Citation2016) for very similar situations in a very close (approximately 50 km) location.
Some investigations to evaluate Pléiades-HR and GeoEye-1 datasets on Trento test site have been carried out in recent years (Agugiaro, Poli, and Remondino Citation2012; Capaldo, Crespi, Fratarcangeli, Nascetti, Pieralice, Agugiaro, et al. Citation2012; Poli et al. Citation2013): the results here obtained are quite similar to those presented in these works and this confirms the quality of the developed workflow.
4. Conclusions and future prospects
A new tool for a fully automated workflow for DSMs generation from satellite optical imagery is presented. Key features of the defined workflow include: the epipolarity achievement in the object space thanks to the images ground projection (GrEI) and the coarse-to-fine pyramidal scheme adopted; the use of computer vision algorithms in order to improve the processing efficiency and make the DSMs generation process fully automatic; the free and open source aspect of the developed code (freely available at the URL of the GitHub repository, https://github.com/martidi/opencv dsm/tree/imageStack).
The good results achievable with DATE are mainly due, for the quality aspect, to the SGBM usage, and for the efficiency side, to the object space images projection (GrEI) and to the coarse-to-fine pyramidal scheme adopted. As a matter of fact, the multi-resolution ground-based approach adopted allows to constrain the research space for the image matching from thousands of pixels to tens of pixels, remarkably lowering the time needed and thus greatly increasing the dense matching efficiency; consequently the implemented tool appears suited for DSMs massive production.
The potential of the developed strategy has been demonstrated through application to DSMs generation from Pléiades-HR and GeoEye-1 imagery within the Trento test site. These first results are in keeping with that obtained in previous works (Agugiaro, Poli, and Remondino Citation2012; Capaldo, Crespi, Fratarcangeli, Nascetti, Pieralice, Agugiaro, et al. Citation2012; Poli et al. Citation2013).
As future works, the influence of the a priori DSM and its possible gross errors on the final result will be investigated, even testing an initial constant height, as well as a deeper analysis for the multi-looking choice in the coarse-to-fine approach will be developed.
Moreover, the mutual information could be implemented as a similarity criterion for the dense image matching step (see Subsection 2.3) since, especially for images with a large stereo baseline, which show stronger radiometric differences, the Birchfield–Tomasi metric might not be the most appropriate similarity.
As far as concerns the conversion factor (see Subsection 2.4), it could be worthwhile to check the effectiveness of a more refined model like a bilinear one, with respect to the mean so far implemented, especially for VHR satellite images.
As regards GrEI generation (see Subsection 2.2), in a very near future a new strategy for quasi-epipolar geometry achievement will be developed and implemented. The idea is to use two different steps: an initial estimation of the rotation angle to be applied to both images to bring them approximately in the epipolar direction, in order to correct potential rotation due to the inclination in the direction acquisition, and a successive refinement of the images relative position by estimating, as already done according to the Equation (1), a (small) rotation and a translation to be applied to the slave image in order to correct for a possible residual roto-translation between master and slave images due to RPCs errors.
Besides, as a further development, a solution to fill gaps for the unmatched areas both through interpolation and fusion with other information will be investigated.
Furthermore, we are already working on DATE improvement in order to be able to process also tri-stereo optical imagery and SAR satellite imagery: first results with SAR images have been obtained (Di Rita et al. Citation2016) and we expect both capabilities to be fully implemented in a very near future.
Acknowledgements
The Pléiades triplet was made available by e-Geos S.p.A. in the frame of a collaboration agreement: the authors are indebted to e-Geos S.p.A. for this. Furthermore, the authors thank very much David Burken, David Hicks, and Oscar Kramer for providing, as Google Summer of Code mentors, informatics support and all the necessary information to understand the wide OSSIM architecture. Moreover, the authors are indebted to the Reviewers since their careful comments contributed to remarkably improve the manuscript.
Disclosure statement
No potential conflict of interest was reported by the authors.
References
- Agugiaro, G., D. Poli, and F. Remondino. 2012. “Testfield Trento: Geometric Evaluation of Very High Resolution Satellite Imagery.” International Archives of the Photogrammetry, Remote Sensing and Spatial Information Sciences 34 (B1): 191–196. doi:10.5194/isprsarchives-XXXIX-B1-191-2012.
- Aguilar, M. A., M. Del Mar Saldaña, and F. J. Aguilar. 2014. “Generation and Quality Assessment of Stereo-Extracted DSM from Geoeye-1 and Worldview-2 Imagery.” IEEE Transactions on Geoscience and Remote Sensing 52 (2): 1259–1271. doi:10.1109/TGRS.2013.2249521.
- Alobeid, A., and K. Jacobsen. 2008. “Automatic Generation of Digital Surf Ace Models from IKONOS Stereo Imagery and Related Application.” GORS 16th International Symposium.
- Birchfield, S., and C. Tomasi. 1998. “A Pixel Dissimilarity Measure that Is Insensitive to Image Sampling.” IEEE Transactions on Pattern Analysis and Machine Intelligence 20 (4): 401–406. doi:10.1109/34.677269.
- Büyüksalih, G., and K. Jacobsen. 2007. “Digital Surface Models in Build up Areas Based on Very High Resolution Space Images.” ASPRS Annual Conference.
- Câmara, G., and F. Fonseca. 2007. “Information Policies and Open Source Software in Developing Countries.” Journal of the American Society for Information Science and Technology 12 (4): 255–272.
- Capaldo, P., M. Crespi, F. Fratarcangeli, A. Nascetti, and F. Pieralice. 2012a. “DSM Generation from High Resolution Imagery: Applications with Worldview-1 and Geoeye-1.” Italian Journal of Remote Sensing 44 (1): 41–53. doi:10.5721/ItJRS20124414.
- Capaldo, P., M. Crespi, F. Fratarcangeli, A. Nascetti, F. Pieralice, G. Agugiaro, D. Poli, and F. Remondino. 2012b. “DSM Generation from Optical and SAR High Resolution Satellite Imagery: Methodology, Problems and Potentialities.” International Geoscience and Remote Sensing Symposium (IGARSS). IEEE International: pp. 6936–6939.
- Crespi, M., P. Capaldo, F. Fratarcangeli, A. Nascetti, and F. Pieralice. 2010. “DSM Generation from Very High Optical and Radar Sensors: Problems and Potentialities along the Road from the 3D Geometric Modeling to the Surface Model.” International Geoscience and Remote Sensing Symposium. Art. no. 5653883: 3596–3599.
- Crespi, M., F. Fratarcangeli, F. Giannone, and F. Pieralice. 2012. “A New Rigorous Model for High-Resolution Satellite Imagery Orientation: Application to EROS A and Quickbird.” International Journal of Remote Sensing 33 (8): 2321–2354. doi:10.1080/01431161.2011.608737.
- Crespi, M., and D. V. Laura. 2009. “A Procedure for High Resolution Satellite Imagery Quality Assessment.” Sensors 9: 3289–3313. doi:10.3390/s90503289.
- d’Angelo, P., M. Lehner, T. Krauss, D. Hoja, and R. Peter. 2008. “Towards Automated DEM Generation from High Resolution Stereo Satellite Images.” International Archives of Photogrammetry, Remote Sensing and Spatial Information Sciences 37 (B4): 1137–1142.
- de Franchis, C., E. Meinhardt-Llopis, J. Michel, J.-M. Morel, and G. Facciolo. 2014a. “An Automated and Modular Stereo Pipeline for Pushbroom Images.” ISPRS Annals of Photogrammetry, Remote Sensing and Spatial Information Sciences II (3): 49–56. doi:10.5194/isprsannals-II-3-49-2014.
- de Franchis, C., E. Meinhardt-Llopis, J. Michel, J.-M. Morel, and G. Facciolo. 2014b. “On Stereo-Rectification of Pushbroom Images.” IEEE International Conference on Image Processing (ICIP), Paris, pp. 5447–5451.
- Di Rita, M. 2014. “Photogrammetric Image Processing: DSM Generation Tool for OSSIM.” GSoC weekly reports. https://trac.osgeo.org/ossim/wiki/GsocDSMGenerationToolForOSSIM .
- Di Rita, M., A. Nascetti, F. Fratarcangeli, and M. Crespi. 2016. “Upgrade of FOSS DATE Plug-In: Implementation of a New Radargrammetric DSM Generation Capability.” International Archives of Photogrammetry, Remote Sensing and Spatial Information Sciences 41 (B7): 821–825. doi:10.5194/isprsarchives-XLI-B7-821-2016.
- Dowman, I., K. Jacobsen, G. Konecny, and R. Sandau. 2012. High Resolution Optical Satellite Imagery, 230. Scotland, UK: Whittles Publishing.
- Fratarcangeli, F., G. Murchio, M. D. Rita, A. Nascetti, and P. Capaldo. 2016. “Digital Surface Models from Ziyuan-3 Triplet: Performance Evaluation and Accuracy Assessment.” International Journal of Remote Sensing 1–27. Advance online publication. doi:doi:http://dx.doi.org/10.1080/01431161.2016.1192308.
- GeoEye-1 info-page, Earth Observation Portal. 2015. https://directory.eoportal.org/web/eoportal/satellite-missions/g/geoeye-1.
- Gesch, D. B., M. J. Oimoen, and G. A. Evans. 2014. “Accuracy Assessment of the U.S. Geological Survey National Elevation Dataset, and Comparison with Other Large-Area Elevation Datasets - SRTM and ASTER.” U.S. Geological Survey Open-File Report. 1008: 10.
- Ghuffar, S. 2016. “Satellite Stereo Based Digital Surface Model Generation Using Semi Global Matching in Object and Image Space.” ISPRS Annals of Photogrammetry, Remote Sensing and Spatial Information Sciences III (1): 63–68. doi:10.5194/isprsannals-III-1-63-2016.
- Gong, K., and D. Fritsch. 2016. “A Detailed Study about Digital Surface Model Generation Using High Resolution Satellite Stereo Imagery.” ISPRS Annals of Photogrammetry, Remote Sensing and Spatial Information Sciences III (1): 69–76. doi:10.5194/isprsannals-III-1-69-2016.
- Habib, A., E.-M. Kim, M. F. Morgan, and I. Couloigner. 2004. “DEM Generation from High Resolution Satellite Imagery Using Parallel Projection Model.” International Archives of the Photogrammetry, Remote Sensing and Spatial Information Sciences 35: 1.
- Hirschmüller, H. 2008. “Stereo Processing by Semi-Global Matching and Mutual Information.” IEEE Transactions on Pattern Analysis and Machine Intelligence 30 (2): 328–341. doi:10.1109/TPAMI.2007.1166.
- Jacobsen, K. 2006. “Digital Surface Models of City Areas by Very High Resolution Space Imagery.” EARSeL-Workshop on Urban Remote Sensing.
- Moreno-Sanchez, R. 2012. “Free and Open Source Software for Geospatial Applications (FOSS4G): A Mature Alternative in the Geospatial Technologies Arena.” Transactions in GIS 16 (2): 81–88. doi:10.1111/tgis.2012.16.issue-2.
- OpenCV library overview - available at http://opencv.org/. 2015.
- OSSIM wiki 2015: Community Maintained Wiki for the OSSIM Distribution available at http://trac.osgeo.org/ossim. 2015.
- Pierrot-Deseilligny, M., and C. Isabelle. 2011. “APERO, an Open Source Bundle Adjusment Software for Automatic Calibration and Orientation of a Set of Images.” International Archives of Photogrammetry, Remote Sensing and Spatial Information Sciences 38-5/W16: 269–276.
- Pléiades-HR info-page, Earth Observation Portal. 2015. https://directory.eoportal.org/web/eoportal/satellite-missions/p/pleiades.
- Poli, D. 2005. Modelling of Spaceborne Linear Array Sensors. Switzerland: Doctoral dissertation, Swiss Federal Institute of Technology Zurich.
- Poli, D., F. Remondino, E. Angiuli, and G. Agugiaro. 2013. “Evaluation of Pléiades-1A Triplet on Trento Testfield.” International Archives of the Photogrammetry, Remote Sensing and Spatial Information Sciences 15-1(W1):287–292.
- Reinartz, P., J. Tian, H. Arefi, T. Krauß, G. Kuschk, and T. Partovi, and and P. d’Angelo. 2014. “Advances in DSM Generation and Higher Level Information Extraction from High Resolution Optical Stereo Satellite Data.” Earsel Symposium.
- Rodriguez, E., C. S. Morris, and E. Belz. 2006. “A Global Assessment of the SRTM Performance.” Photogrammetric Engineering and Remote Sensing 72 (3): 249–260. doi:10.14358/PERS.72.3.249.
- Toutin, T. 2004. “Geometric Processing of Remote Sensing Images: Models, Algorithms and Methods.” International Journal of Remote Sensing 25 (10): 1893–1924. doi:10.1080/0143116031000101611.
- Toutin, T. 2006a. “Generation of Dsms from SPOT-5 In-Track HRS and Across-Track HRG Stereo Data Using Spatiotriangulation and Autocalibration.” ISPRS Journal of Photogrammetry and Remote Sensing 60 (3): 170–181. doi:10.1016/j.isprsjprs.2006.02.003.
- Toutin, T. 2006b. “Comparison of 3D Physical and Empirical Models for Generating Dsms from Stereo HR Images.” Photogrammetric Engineering and Remote Sensing 72 (5): 597–604. doi:10.14358/PERS.72.5.597.
- Zhang, L., and A. Gruen. 2006. “Multi-Image Matching for DSM Generation from IKONOS Imagery.” ISPRS Journal of Photogrammetry and Remote Sensing 60 (3): 195–211. doi:10.1016/j.isprsjprs.2006.01.001.