
 ?Mathematical formulae have been encoded as MathML and are displayed in this HTML version using MathJax in order to improve their display. Uncheck the box to turn MathJax off. This feature requires Javascript. Click on a formula to zoom.
ABSTRACT
The Dunhuang Chinese Radiometric Calibration Site (CRCS), used for the vicarious calibration (VC) of reflective solar bands (RSBs), was determined as the primary radiometric calibration site for Chinese space-borne optical sensors and was also selected in 2008 by the Working Group on Calibration and Validation of the Committee on Earth Observation Satellites as one of the instrumented reference sites. In August 2015, an in situ measurement was carried out at the Dunhuang site to evaluate the RSB radiometric calibration of the Visible Infrared Imaging Radiometer Suite (VIIRS) on Suomi National Polar-orbiting Partnership (NPP) and Moderate Resolution Imaging Spectroradiometer (MODIS) on Aqua based on the reflectance-based method. A portable spectroradiometer was used in the experiment to obtain the surface reflectance, and the atmospheric parameters were obtained by sun photometers and radiosonde. A Dunhuang surface bidirectional reflectance distribution function model obtained during the field missions in 2008 and 2013 was implemented. Two days of in situ measurement data including 2 days of VIIRS data and 1 day of MODIS data were used for this evaluation. The results show that the radiometric calibration accuracy is within ±2% for most NPP/VIIRS and Aqua/MODIS RSBs based on the Dunhuang site. It should be noted that there is a relatively large difference in the NPP/VIIRS day–night band (DNB) and Aqua/MODIS band 7 results at the central wavelength of 2.1 μm, with biases of – 4.78% and – 5.71%, respectively. One factor contributing to the difference is the atmospheric transmittance calculation in these bands using the 6S radiative transfer model. If Moderate Resolution Atmospheric Transmission model is used for atmospheric transmittance correction, part of the bias of the MODIS band 7 and VIIRS DNB can be eliminated. However, the consistency of the VIIRS M11 and MODIS B7 is 3.47%, which is larger than that of the other bands.
1. Introduction
The Moderate Resolution Imaging Spectroradiometer (MODIS) is a key instrument in the NASA Earth Observing System (EOS). The EOS Aqua spacecraft was launched on 4 May 2002 and has been on orbit for more than 14 years. MODIS has 20 reflective solar bands (RSBs) with wavelengths ranging from about 410 nm to about 2100 nm (Xiong et al. Citation2003).
The Suomi National Polar-orbiting Partnership (NPP) Satellite was launched on 28 October 2011. The Visible Infrared Imaging Radiometer Suite (VIIRS) onboard the NPP is a 22-band Earth-imaging spectroradiometer. It signifies a new era of moderate resolution imaging capabilities, following the legacy of the Advanced Very High Resolution Radiometer and MODIS (Cao et al. Citation2013). VIIRS RSBs consist of 14 channels covering a spectral range from about 400 nm to about 2280 nm. RSB calibration uses on-board fully illuminated solar diffuser data collected once per orbit and space-view data from every scan (Lei, Wang, and Xiong Citation2015). Apart from the normal RSBs, VIIRS also contains the day–night band (DNB), with a wavelength range of 500–900 nm. There are three gain stages in the DNB. During daytime observation, the DNB is usually in the low gain stage (LGS) (Liao et al. Citation2013; Shao and Cao Citation2013). The design and development of the VIIRS has a close heritage with MODIS on NASA’s EOS, which is currently operating on both the Terra and Aqua spacecraft. A rotating telescope assembly in VIIRS provides better control of the stray light, compared with the scan mirror used in MODIS (Cao et al. Citation2013).
Both MODIS and VIIRS carry a solar diffuser (SD) and SD stability monitor and have the ability to do calibration onboard. For RSBs, the calibration uncertainty in the spectral reflectance for a typical radiance is less than 2% (Xiong et al. Citation2003; Cao et al. Citation2013). In addition to the on-board calibrator, additional vicarious methods based on invariant targets such as deserts (Bhatt et al. Citation2014; Wu et al. Citation2016), ice sheets (Uprety and Cao Citation2015), deep convective clouds (Doelling, Wu, and Xiong Citation2015; Wang and Cao Citation2016), and lunar observations (Sun et al. Citation2007; Xiong, Sun, and Barnes Citation2008) are used to verify sensor degradation independently. By using the inter-calibration with these two sensors or with other satellite instruments (Wu et al. Citation2016; Xiong et al. Citation2016), such as Libya 4, Sudan 1 desert, and Dome C (Uprety and Cao Citation2015), the absolute radiometric biases of the VIIRS bands based on MODIS have been estimated. Due to the spectral response function (SRF) differences between VIIRS and MODIS, spectral band adjustment factors should be considered.
The Dunhuang site, one of the China Radiometric Calibration Sites (CRCS) used for the RSB vicarious calibration (VC) of Chinese space-born sensors, was selected in 2008 by the Working Group on Calibration and Validation of the Committee on Earth Observation Satellites as one of the instrumented reference sites (Hu et al. Citation2010). The VC method, involving natural Earth scenes, has been widely used since it was developed by the Remote Sensing Group at the University of Arizona (Slater et al. Citation1987) in the 1980s. Several global test sites – such as White Sands, New Mexico; Lunar Lake and Railroad Valley, Nevada; and La Crau, southern France – are used by different scientists to perform the absolute calibration for remote-sensing sensors through ground reflectance and atmospheric measurements, made simultaneously with the satellite overpass. Reflectance-based VC using the CRCS Dunhuang site has been the baseline method of operational calibration for the FY1C/MVISR (Meteorological Vis-IR Scanning Radiometer) since 1999 as well as the FY3/MERSI (MEdium Resolution Spectral Imager) since 2008 (Hu et al. Citation2010; Hu et al. Citation2012). Although there are some other calibration methods that do not rely on in situ measurements (Chen, Xu, and Zhang Citation2013; Sun et al. Citation2013) and collecting synchronous in situ measurements for a satellite sensor radiometric calibration is expensive and time-consuming, in situ measurement calibration is necessary for sensor calibration/validation.
The Aqua/MODIS is approaching the end of its lifetime, while the NPP/VIIRS has just begun and is considered the successor of MODIS. This work seeks to validate and evaluate the radiometric calibration of these two sensors based on the in situ measurements of the Dunhuang site.
2. Methodology
2.1. Satellite data
For most data users and the general public, the Comprehensive Large-Array Stewardship System is the best option for accessing the VIIRS calibrated data and data from geolocated sensor data records (SDR) and environmental data records (EDR). Access can be obtained at http://www.class.noaa.gov. Early Simultaneous Nadir Overpass (SNO) inter-comparisons in 2012 revealed that large biases in the order of 5% existed between the VIIRS M1 and Aqua MODIS B8. A further comprehensive investigation pointed out that bias appeared due to a MODIS calibration drift for the blue band in MODIS collection 5 data (Cao et al. Citation2013). This bias disappeared when the new MODIS collection 6 data were used in the comparison. Therefore, Aqua/MODIS MYD L1B1km collection 6 data have been used in this article. The MODIS data used in this article is collected from NASA Level 1 and the Atmosphere Archive and Distribution System – https://ladsweb.nascom.nasa.gov/. Due to the bidirectional reflectance distribution function (BRDF) effect of the surface, only satellite data with view angles less than 30° were selected in this study. Furthermore, clear weather and staff assignment should be considered. So, during this in situ measurement campaign, only 1 day (21 August) and 2 days (16 August and 21 August) of measurements were taken for Aqua/MODIS and NPP/VIIRS, respectively.
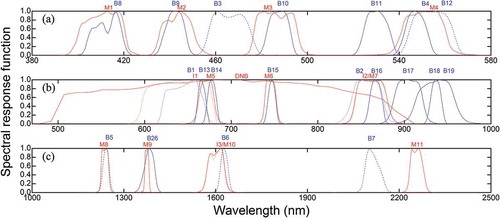
shows the SRFs of the NPP/VIIRS and Aqua/MODIS solar reflectance bands. Here, we choose the Aqua/MODIS B1 to B7 and all the NPP/VIIRS solar reflectance bands (except M6 and M9, which are strong absorption bands) for radiometric calibration evaluation. It should be noted that there are two NPP/VIIRS DNB band SRFs since the bands were gradually changed over time. One SRF corresponds to data taken before 4 April 2013 and the other corresponds to data after that date. The VIIRS government team modifies the SRFs at a certain point in time to produce the actual SDR. The DNB SRF used here is the version after 4 April 2013.
Figure 1. The spectral response functions of NPP/VIIRS and Aqua/MODIS solar reflectance bands (red is for VIIRS and blue is for MODIS). The VIIRS DNB SRF is the version after 4 April 2013.
2.2. Introduction of the Dunhuang CRCS and field campaign in 2015
The Dunhuang site (40.18° N, 94.27° E), approximately 1160 m above sea level, is located in the Gobi Desert in northwest China, about 35 km west of Dunhuang city, Gansu province, China. The entire site is situated on a stable alluvial fan whose surface consists of cemented gravel without vegetation and some grey or black stones covering an approximately 30 km×30 km area (Hu et al. Citation2010). Field campaigns were scheduled in accordance with the sensor overpass under cloud-free conditions. The measurement instruments used in the Dunhuang VC campaign usually include a spectroradiometer, a CE318 sun photometer, a MICROTOP portable sun photometer, and radiosondes as well as a portable meteorological instrument (Hu et al. Citation2010).
The size of the Dunhuang CRCS central area is 10 km ×10 km. This central area is divided into 25 sections, including 11 measurement sites (). Both the surface reflectance and the atmospheric parameters, especially water vapour (WV) content and aerosol optical depth (AOD), can affect the radiance of satellite observed. So the VC activity team is usually divided into two groups. One group works at the No. 1 site (), and it is responsible for the measurement of atmospheric parameters (Chen et al. Citation2016), including AOD, WV content, total ozone column, temperature, pressure, humidity, and cloud cover. The other group is responsible for surface reflectance measurements of 11 sites by the spectroradiometer (Li et al. Citation2014; Chen et al. Citation2014). In each calibration process, an ASD FieldSpec 3 spectral radiometer, carried on a vehicle transported through the centre of each subarea of this site, was used to measure the surface reflectance at 11 sites within 1.5 h during the satellite overpass.
Figure 2. Coordinate map of 11 spot measurements.
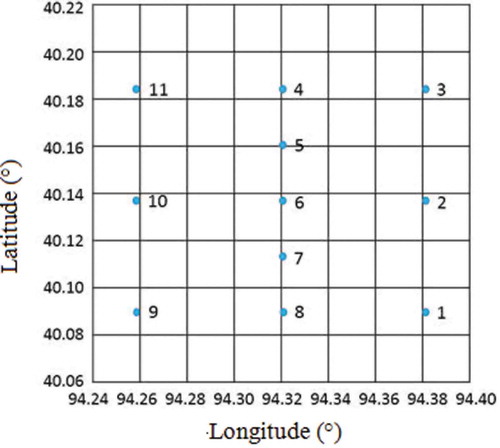
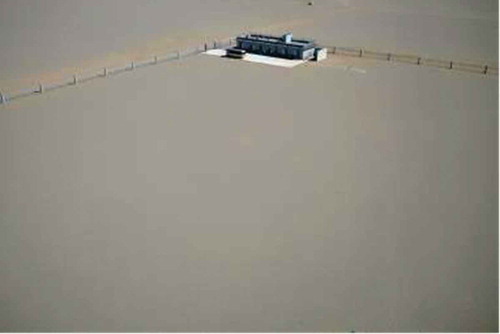
Figure 3. Ground view from 30 m height tower crane at site No.1.
VC activity involves measurements from ground viewing radiometers along with an ASD spectroradiometer, sun photometer CE318, and portable meteorological instruments, positioned in a ground target area. It also includes measurements from radiosonde equipment at the Dunhuang weather station, which is about 30 km from the site. The surface reflectance measured by the ASD is modified by the BRDF model, according to the satellite observation geometry (Li et al. Citation2014). Measurement data have been input into the 6S radiative transfer model (RTM) (Vermote et al. Citation1997) to estimate the apparent radiance or apparent reflectance at the position of a satellite sensor.
The 2015 CRCS VC campaign lasted from 13 August to 23 August. It attracted more than 20 investigators from the National Satellite Meteorology Center of China, Hefei Institutes of Physical Science (HIPS), Peking University, and Dunhuang Meteorology Bureau. During the campaign, simultaneous in situ measurement data were obtained for calibration/validation.
2.3. In situ measurement data
2.3.1. Atmospheric measurements
When the satellite passed, a radiosonde was launched by a balloon from the Dunhuang Meteorology Observation Station, which was about 30 km east from the Dunhuang CRCS site. The temperature and WV profile were received from the radiosonde. The total WV content is the sum of the WV profiles.
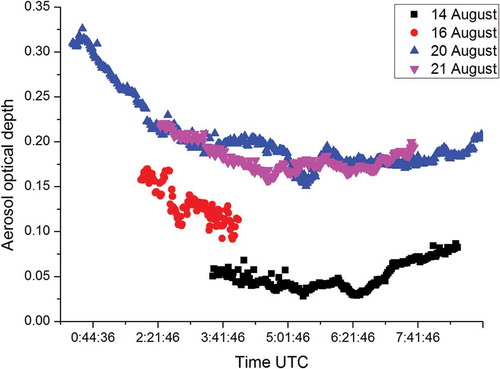
CE-318 is a sun photometer used for AOD measurements. The AOD was obtained in 1-min intervals (Chen et al. Citation2016). shows the AODs at 550 nm, measured on 14, 16, 20, and 21 August 2015. However, on 14 and 20 August, the satellite view angles were not suitable for calibration. The AOD was no more than 0.2 during the satellite passing time on these 4 days. The data looked extremely clean on 14 August as there was a drizzle falling at the Dunhuang site before that day. On 16 August, an error occurred with CE-318 after 4:00 (UTC), so the AOD data closest to that time were used for calibration. Usually, the AOD used for VC is the mean value of the AOD within a half-hour of the satellite overpass. Besides the automatic sun photometer, a portable sun photometer named MICROTOP was also used in the 2015 CRCS campaign. MICROTOP could also measure the total ozone. The relative atmospheric data and the sensor angles are listed in .
Table 1. Atmospheric parameters and sensor angles information.
Figure 4. The aerosol optical depth at 550 nm, measured on 14, 16, 20, and 21 August 2015 at Dunhuang site No. 1.
2.3.2. Surface reflectance observations
The FieldSpec 3, which is a highly portable, general purpose spectroradiometer, is made by Analytical Spectra Devices Inc. (ASD) (Li et al. Citation2014; Chen et al. Citation2014). It is widely used in many applications requiring either absolute or relative measurements. FieldSpec 3 features three holographic diffraction gratings along with three separate detectors. ASD FieldSpec 3 had been well calibrated before it was delivered from the factory. Before the campaign, the radiometric calibration for spectroradiometer was performed in the laboratory.
The directional reflectance was measured by the ASD FieldSpec 3 spectral radiometer and the standard reference board (SRB), which has a Lambert reflection surface. The SRB was made by HIPS, using Teflon material. The geometric dimensions are 400 mm × 400 mm. The hemisphere-directional reflectance factor and the BRDF of the SRB had been measured strictly in the laboratory. The FieldSpec 3 spectral radiometer operated based on the vertical angle (view angle is 0°). At each measurement spot, the SRB was measured to obtain the reference reflectance. Then, the surface was measured six times at identical regions. Finally, the SRB was measured again. The average value of the six measurements represented the reflectance for each spot.
The surface BRDF is one of the most important parameters in the radiance transfer calculation in the site-based VC (Hu et al. Citation2010). During the CRCS project period, measurements and analysis of the characteristics of the BRDF at the calibration site were developed to construct a Dunhuang site BRDF model. A significant fraction of the data used for the retrieval of this BRDF model was obtained during the field missions of 2008 and 2013 (Li et al. Citation2014). The measurement data of 2015 campaign were not used to build the BRDF model. The BRDF measurements provide quasi simultaneous, multiangle, and multispectral measurements of the surface-reflected solar radiance, used to perform VC of satellite sensors in RSBs. This BRDF model adopts the MODIS BRDF model algorithm for the Model Bidirectional Reflectance Anisotropies of the Land Surface, using the following expression (Li et al. Citation2014):
is the BRDF.,
and
are the solar zenith angle, sensor zenith angle, and relative azimuth angle of the Sun and sensor, respectively.
is the wavelength,
is the RossThick kernel, and
is the LiSparse-R kernel.
, and
are the BRDF kernel model parameters, representing the weights of isotropic scattering, volume scattering, and geometric optical scattering, respectively.
A time difference exists between the surface reflectance measurements and satellite observations. As a result, the surface reflectance at each site should be corrected to the same angle conditions as the satellite observations by the BRDF model, using the following equation:
stands for the corrected surface reflectance as a function of solar zenith angle (
), sensor zenith angle (
), and the relative azimuth angle (
) of the satellite-passing time for a given wavelength
;
is the ASD directly measured surface reflectance as a function of the angles of measurement (
).
and
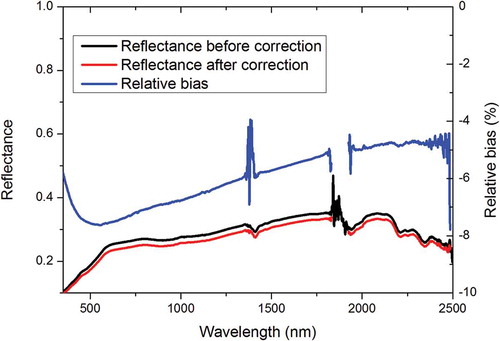
are the reflectances calculated by the BRDF model as a function of the relevant angles at satellite-passing time and at measurement time. shows the surface reflectance of the measurement spot No. 6 before (black line) and after (red line) BRDF correction and their relative bias (blue line). The relative bias between the two reflectances is about 4–5%. However, noise could affect the calibration accuracy of specific bands between the gap of each ASD spectra detector.
should be convoluted for each sensor band spectrum response function as the measured surface reflectance of each band.
Figure 5. The surface reflectance of measurement spot No. 6 on 21 August 2015, before (black line) and after (red line) BRDF correction, and their relative bias (blue line).
2.4. The RTM and apparent reflectance calculation
The RTM used for the calculation of the apparent reflectance received by a given sensor is the second simulation of a satellite signal in the solar spectrum vector (6SV) RTM (Vermote et al. Citation1997; Vermote et al. Citation2006). It is an advanced and customized RTM designed to simulate the reflection of solar radiation by a coupled atmosphere-surface system for a wide range of atmospheric, spectral, and geometrical conditions. This particular RTM is often adopted as the basic code for the calculation of look-up tables in the MODIS atmospheric correction algorithm.
The surface reflectance should be convoluted by the SRF for each satellite band due to the fact that the in situ surface reflectance measurements are continuous spectra with a wavelength interval of 3–10 nm. The desert aerosol models provided in the 6SV are assumed for the Dunhuang site. Other atmospheric parameters used are listed in .
The average values around the site centre are selected as the matched satellite data with the following criteria: data from a 3 × 3 pixel box are centred at the nearest pixel to each measurement site. The average apparent reflectance (radiance for NPP DNB) for a 3 × 3 satellite pixel box is compared to the value from the corresponding RTM calculation. The resulting bias is calculated from the following equation:
Rsat and Rmodel are the apparent reflectances or radiances from satellite observation and model calculation, respectively.
3. Results
3.1. Evaluation calibration accuracy for NPP/VIIRS
) displays the radiometric calibration bias results for the NPP/VIIRS solar reflectance bands (except the M6 and M9 bands) on 16 August (red dot) and 21 August (black square). M6 and M9 results are not included here as these bands are absorbing bands. The VC method based on the in situ measurement and RTM calculation is not accurate enough to apply to these strong absorbing bands. In ), the bars for each band show the 1-σ standard deviation (SD) for each day and each band, due to the 11 daily measurements. ) is the mean bias of the 2-day value for each band (black square) and their differences (red dot) between each other. All the results of 11 points are listed in the appendix ().
Figure 6. (a) Radiometric calibration bias results for NPP/VIIRS solar reflectance bands (except M6 and M9 bands) on 16 August (red dot) and 21 August (black square) and the bar for the standard deviation (SD); (b) the 2-day mean bias for each band (black square) and the difference between the 2-day results (based on the result on 16 Aug) (red dot).
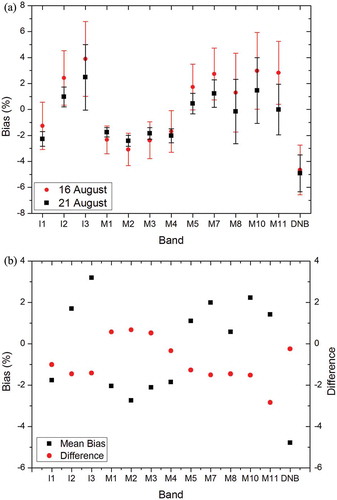
The results show that for most NPP/VIIRS RSBs the radiometric calibration accuracy is within 2% (based on RTM model results) except for I3, M2, M10, and DNB whose biases are 3.2%, – 2.7% 2.2%, and – 4.8%, respectively. Meanwhile there is good agreement among the 2-day results. Generally speaking, larger uncertainties (difference in two-day measurements) are present for shortwave infrared bands (SWIR, wavelength > 1000 nm). Furthermore, the bias of the DNB band is slightly larger than the other RSBs but has good agreement with the 2-day results. DNB achieves this dynamic range by having three gain stages: low gain (LGS), mid gain (MGS), and high gain (HGS) (Shao and Cao Citation2013; Liao et al. Citation2013; Cao et al. Citation2014). During daytime, the DNB band is usually in the LGS state. According to the designed specification of DNB, the uncertainty of the LGS calibration is 5–10% (0.5 Lmax/transition to MGS) (Shao and Cao Citation2013; Liao et al. Citation2013; Cao et al. Citation2014). Therefore, the results successfully indicate the fact that the in-orbit DNB LGS calibration uncertainty is within the designed specification based on 2 days of measurements.
3.2. Evaluation calibration accuracy for Aqua/MODIS
During the 2015 CRCS campaign experiment, only the data on 21 August could be used to evaluate the radiometric calibration of Aqua/MODIS due to the limitations in the sensor view angle. The mean biases of 11 measurement points and their 1-σ SD for Aqua/MODIS band 1 to band 7 are shown in . In general, the bias of MODIS bands is within 1%, except for B2 and B7 with a bias of 1.7% and – 5.7%, respectively. Although the Aqua/MODIS has been on-orbit for more than 13 years, the evaluation result shows that the accuracy of Aqua/MODIS radiometric calibration for most bands is still reliable and could meet the 2% uncertainty index, which has been asserted in previous studies (Xiong et al. Citation2003, Citation2008). The evaluation results also illustrate that the B7 calibration is unusually lower than the RTM result, while its uncertainty is just 1.45% (1-σ SD). All the detailed results of 11 points are listed in the appendix ().
Figure 7. The evaluation results of Aqua/MODIS band 1 to band 7. The red square is the mean bias and the red bar is the 1-σ SD for each band.
4. Discussions
In addition to evaluating the calibration accuracy of the Aqua/MODIS and the NPP/VIIRS RSBs separately, these results can also be used to indirectly compare the consistency of these two sensors by double difference methods. The double difference is designed to cancel out the model bias effect by calculating the difference between the Observation-Model means of two similar sensor bands, extract the absolute difference between the sensor bands, and widely used in infrared bands (Liang and Ignatov Citation2010, Citation2013). Here, the model-based results for each sensor’s bands are used as reference. These results could reduce the uncertainty of the measurements or model simulations. lists similar corresponding bands for VIIRS and MODIS and their biases, shown in and . Moreover, the double difference results are also shown in this table. Generally speaking, the consistency between the VIIRS and MODIS is within 2% for most bands. However, there is a larger difference in the SWIR, near 2.12 μm, due to the larger bias in the MODIS B7.
Table 2. The radiometric calibration consistency for VIIRS and MODIS.
In some previous studies, the SNO and VC methods using invariant surface targets, such as deserts and ice sheets, were used to assess and compare the calibration consistency between the Suomi-NPP/VIIRS and Aqua/MODIS (Cao et al. Citation2014; Wu et al. Citation2016). The level of agreement found in this study could be comparable to the previous studies, except for the SWIR near 2.12 μm due to the existence of fewer results for this band for comparison. In Wu et al. (Citation2016), the differences for 0.865 μm (I2 and M7 for VIIRS and B2 for MODIS) are beyond 2%, while in this study, the results are 0.0% and 0.3% for I2 versus B2 and M7 versus B2, respectively.
The MODIS B7 central wavelength is at 2.12 μm, whereas the VIIRS M11 central wavelength is at 2.25 μm. The CO2 contribution occurs beyond 1 μm but is weaker than H2O and only perturbs the WV windows (Vermote et al. Citation2006). CO2 is the main absorption gas since WV absorption is weak in that wavelength region. There is weak CO2 absorption at 2.12 μm. The 6S RTM-simulated result at 2.12 μm could be error-estimated due to the gas transmittance calculation uncertainty (Vermote et al. Citation2006).
Furthermore, unlike the other visible and near-infrared bands, DNB has a wider SRF for wavelengths 0.5–0.9 μm. In these wide bands, there are many absorption bands, including WV, O3, and O2. The H2O contribution affects wavelengths greater than 0.7 μm. Besides, O3 exhibits significant absorption between 0.55 and 0.65 μm. The O2 influence is limited to a very strong band at about 0.7 μm. In the 6S User Guide (Vermote et al. Citation2006), researchers summarized that in the solar spectrum, good atmospheric windows for terrestrial observation by satellites are as follows: in the visible – between 0.4 and 0.7 μm; in the near and mid-infrared – at about 0.85, 1.06, 1.22, 1.6, and 2.2 μm.
In order to assess the transmittance bias caused by the gas absorption in 6S, we compared the two-way transmittance in MODIS B7, VIIRS M11, and VIIRS DNB by 6S model and Moderate Resolution Atmospheric Transmission (MODTRAN) model. The mid-latitude summer atmospheric profile is used in the two models, and the WV content and ozone content are set to 1 g cm−2 and 0.292 cm atm−1, respectively, which represent the average atmospheric status in Dunhuang. The results list in .
Table 3. Two-way gas transmittance in MODIS B7, VIIRS M11, and VIIRS DNB calculated by 6S and MODTRAN.
The results from indicate that the two-way transmittance calculated by 6S in MODIS B7 is underestimated, whereas in VIIRS M11 it is overestimated. Meanwhile, in DNB it also has a bias around –0.019. Applying the transmittance correction, we get new results after correction for these bands as shown in .
Table 4. The radiometric calibration evaluation for VIIRS and MODIS and their consistency in M11 and B7 before and after gas transmittance correction.
After the transmittance correction, the biases at the around 2.12 μm wavelength and DNB could be reduced. The differences between the VIIRS M11 and MODIS B7 are reduced from 6.9% to 3.5%. In the study by Uprety and Cao (Citation2015), they reported a 5.4% bias relative to Operational Land Imager (OLI) but within 2% with uncertainty larger than 3% by Libya-4 and Sudan −1 desert.
5. Conclusions
This article reports the use of the Dunhuang CRCS to evaluate the NPP/VIIRS and Aqua/MODIS RSB radiometric calibration accuracy. During the 2015 CRCS campaign, in situ measurement data obtained on 14 August and 21 August were used for radiometric calibration evaluation, 2 days for VIIRS and 1 day (21 August) for MODIS. The results have shown that for most NPP/VIIRS RSBs, the radiometric calibration accuracy is within ±2% except for I3, M2, M10, and DNB whose biases are 3.2%, – 2.7%, 2.2%, and – 4.8%, respectively. As for MODIS B1–B7, the bias is within ±1%, except for B2 and B7 with a bias 1.7% and – 5.7%.
Consistency between VIIRS and MODIS observations in the similar bands is demonstrated in this article. For most bands, there is good agreement between them with a discrepancy in the order of approximately 2%. The SWIR 2.1 μm band and the VIIRS DNB show larger biases than the other bands partly because of the SRF difference between the two sensors and the unsuitable calculation in this band by the 6S RTM. After the two-way transmittance correction by MODTRAN, a positive effect is demonstrated. The correction reduces part of the bias of MODIS B7 and VIIRS DNB and, hence, reduces the difference between MODIS B7 and VIIRS M11 from 6.9% to 3.6%.
In conclusion, both the MODIS and VIIRS RSBs radiometric calibration performance are generally excellent and meet their designed specifications. In the future, a more accurate atmosphere absorption model, such as a line-by-line model, should be used to reduce the bias of transmittance correction. Multiyear measurements would also help to assess the stability of these instruments.
Currently the VIIRS calibration community is struggling in improving RSB calibration accuracy for EDR application, specially for ocean colour application. Ocean colour application needs much more accurate calibration. Ocean colour application needs much more accurate calibration because ocean surface is dark with lower signals. Usually the dynamic range for ocean colour bands, such as MODIS B8, is under 30%. As for normal desert targets, the reflectance is just around 30% in most visible bands. If the linearity of sensor is good enough, the Dunhuang site could be suitable for evaluation and calibration sensor for ocean colour bands.
Acknowledgements
Authors sincerely thank the experiment team members of 2015 CRCS campaign. We also would like to thank MODIS and VIIRS calibration team for processing and providing the MODIS and VIIRS data. This article was funded by the ‘The National Science and Technology Program of China (Grant No. 2015AA123704)’ and ‘National Natural Science Foundation of China (Grant No. 41675036, 41590874 and 41475031).
Disclosure statement
No potential conflict of interest was reported by the authors.
Additional information
Funding
References
- Bhatt, R., D. R. Doelling, A. Wu, J. Xiong, B. R. Scarino, C. O. Haney, and A. Gopalan. 2014. “Initial Stability Assessment of S-NPP VIIRS Reflective Solar Band Calibration Using Invariant Desert and Deep Convective Cloud Targets.” Remote Sensing 6 (4): 2809–2826. doi:10.3390/rs6042809.
- Cao, C., F. D. Luccia, X. Xiong, W. Robert, and F. Weng. 2014. “Early On-Orbit Performance of the Visible Infrared Imaging Radiometer Suite Onboard the Suomi National Polar-Orbiting Partnership (S-NPP) Satellite.” IEEE Transactions on Geoscience and Remote Sensing 52 (2): 1142–1156. doi:10.1109/TGRS.2013.2247768.
- Cao, C., J. Xiong, S. Blonski, Q. Liu, S. Uprety, X. Shao, Y. Bai, and F. Weng. 2013. “Suomi NPP VIIRS Sensor Data Record Verification, Validation, and Long-Term Performance Monitoring.” Journal of Geophysical Research: Atmospheres 118: 11,664–11,678. doi:10.1002/2013JD020418.
- Chen, L., Y. Jing, P. Zhang, and X. Hu. 2016. “Analysis of Aerosol Properties Derived from Sun Photometer and Lidar over Dunhuang Radiometric Calibration Site.” Proceedings SPIE 9876, Remote Sensing of the Atmosphere, Clouds, and Precipitation VI, 98763G. doi:10.1117/12.2228016.
- Chen, L., N. Xu, Y. Li, R. Wu, X. Hu, and P. Zhang. 2014. “FY3C/MERSI Pre-Launch Calibration for Reflective Solar Bands.” Proceedings SPIE 9264, Earth Observing Missions and Sensors: Development, Implementation, and Characterization III, 92640Z. doi:10.1117/12.2070397.
- Chen, L. X., H. N. Xu, and P. Zhang. 2013. “The Application of Deep Convective Clouds in Calibration and Responds Monitoring the Reflective Solar Bands of FY3A/MERSI (Medium Resolution Spectral Imager).” Remote Sensing 5 (12): 6958–6975. doi:10.3390/rs5126958.
- Doelling, D. R., A. Wu, and X. Xiong. 2015. “The Radiometric Stability and Scaling of Collection 6 Terra and Aqua-Modis VIS, NIR, and SWIR Spectral Bands.” IEEE Transactions on Geoscience and Remote Sensing 53 (8): 4520–4535. doi:10.1109/TGRS.2015.2400928.
- Hu, X., J. Liu, L. Sun, Z. Rong, Y. Li, Y. Zhang, Z. Zheng, R. Wu, L. Zhang, and X. Gu. 2010. “Characterization of CRCS Dunhuang Test Site and Vicarious Calibration Utilization for Fengyun (FY) Series Sensors.” Canada Journal Remote Sensing 36 (5): 566–582. doi:10.5589/m10-087.
- Hu, X. Q., L. Sun, J. J. Liu, L. Ding, X. Wang, Y. Li, Z. J. Zheng, N. Xu, and L. Chen. 2012. “Calibration for the Solar Reflective Bands of Medium Resolution Spectral Imager Onboard FY-3A.” IEEE Transactions on Geoscience and Remote Sensing 50 (12): 4915–4928. doi:10.1109/TGRS.2012.2214226.
- Lei, N., Z. Wang, and X. Xiong. 2015. “On-Orbit Radiometric Calibration of Suomi NPP VIIRS Reflective Solar Bands through Observations of a Sunlit Solar Diffuser Panel.” IEEE Transactions on Geoscience and Remote Sensing 53: 5983–5990. doi:10.1109/TGRS.2015.2430814.
- Li, Y., Z. Rong, L. Zhang, L. Sun, and N. Xu. 2014. “The Comparison of BRDF Model and Validation of MCD43 Products by the 2013 Dunhuang Gobi Experiments.” Proceedings SPIE 9264, Earth Observing Missions and Sensors: Development, Implementation, and Characterization III, 926415. doi:10.1117/12.2067763.
- Liang, X., and A. Ignatov. 2010. “Monitoring of IR Clear-Sky Radiances over Oceans for SST (MICROS).” Journal of Atmospheric & Oceanic Technology 28 (10): 1228–1242. doi:10.1175/JTECH-D-10-05023.1.
- Liang, X., and A. Ignatov. 2013. “AVHRR, MODIS, and VIIRS Radiometric Stability and Consistency in SST Bands.” Journal of Geophysical Research: Atmospheres 118 (6): 3161–3171.
- Liao, L. B., S. Weiss, S. Mills, and B. Hauss. 2013. “Suomi NPP VIIRS Day-Night Band On-Orbit Performance.” Journal of Geophysical Research: Atmospheres 118 (22): 12,705–12,718.
- Shao, X., and C. Cao. 2013. “Vicarious Calibration of S-NPP/VIIRS Day-Night Band.” Proceedings SPIE 8866, Earth Observing Systems XVIII, 88661S. doi:10.1117/12.2023412.
- Slater, P. N., S. F. Biggar, R. G. Holm, R. D. Jackson, Y. Mao, M. S. Moran, J. M. Palmer, and B. Yuan. 1987. “Reflectance- and Radiance-Based Methods for the In-Flight Absolute Calibration of Multispectral Scanners.” Remote Sensing of Environment 22 (1): 11–37. doi:10.1016/0034-4257(87)90026-5.
- Sun, J. Q., X. Xiong, W. L. Barnes, and B. Guenther. 2007. “MODIS Reflective Solar Bands On-Orbit Lunar Calibration.” IEEE Transactions on Geoscience & Remote Sensing 45 (7): 2383–2393. doi:10.1109/TGRS.2007.896541.
- Sun, L., X. Hu, M. Guo, and N. Xu. 2013. “Multisite Calibration Tracking for Fy-3a Mersi Solar Bands.” IEEE Transactions on Geoscience & Remote Sensing 50 (12): 4929–4942. doi:10.1109/TGRS.2012.2215613.
- Uprety, S. A., and C. Cao. 2015. “Suomi NPP VIIRS Reflective Solar Band On-Orbit Radiometric Stability and Accuracy Assessment Using Desert and Antarctica Dome C Sites.” Remote Sensing of Environment 166: 106–115. doi:10.1016/j.rse.2015.05.021.
- Vermote, E. F., D. Tanre, J. L. Deuze, M. Herman, and J. J. Morcrette. 1997. “Second Simulation of the Satellite Signal in the Solar Spectrum, 6S: An Overview.” IEEE Transactions on Geoscience and Remote Sensing 35 (3): 675–686. doi:10.1109/36.581987.
- Vermote, E. F., D. Tanre, J. L. Deuze, M. Herman, J. J. Morcrette, and S. Y. Kotchenova. 2006. Second Simulation of a Satellite Signal.6s User Guide Version 3. http://6s.ltdri.org/pages/manual.html
- Wang, W., and C. Cao. 2016. “Monitoring the NOAA Operational VIIRS RSB and DNB Calibration Stability Using Monthly and Semi-Monthly Deep Convective Clouds Time Series.” Remote Sensing 8 (1): 32. doi:10.3390/rs8010032.
- Wu, A., X. Xiong, C. Cao, and K. F. Chiang. 2016. “Assessment of SNPP VIIRS VIS/NIR Radiometric Calibration Stability Using Aqua MODIS and Invariant Surface Targets.” IEEE Transactions on Geoscience and Remote Sensing 54 (5): 2918–2924. doi:10.1109/TGRS.2015.2508379.
- Xiong, X., A. Angal, J. Butler, C. Cao, D. Doelling, A. Wu, and X. Q. Wu. 2016. “Global Space-Based Inter-Calibration System Reflective Solar Calibration Reference: From Aqua MODIS to S-NPP VIIRS.” SPIE Asia-Pacific Remote Sensing. doi:10.1117/12.2224320.
- Xiong, X., J. Sun, and W. Barnes. 2008. “Intercomparison of On-Orbit Calibration Consistency between Terra and Aqua MODIS Reflective Solar Bands Using the Moon.” IEEE Geoscience and Remote Sensing Letters 5 (4): 778–782. doi:10.1109/LGRS.2008.2005591.
- Xiong, X., J. Q. Sun, J. A. Esposito, B. Guenther, and W. L. Barnes. 2003. “MODIS Reflective Solar Bands Calibration Algorithm and On-Orbit Performance.” Proceedings of SPIE - the International Society for Optical Engineering 4891 (1): 535–546.
Table A1. Radiometric calibration bias results for NPP/VIIRS solar reflectance bands (except M6 and M9 bands) on 16 August and 21 August.
Table A2. Radiometric calibration bias results for Aqua/MODIS solar reflectance bands (B1–B7) on 21 August.