
ABSTRACT
Multi-sensor data from different satellites were analysed to study the interannual variability of the cold domes northeast of Taiwan. From the empirical orthogonal function analysis of along-track satellite altimeter data and sea surface temperature, both revealed a cold dome phenomenon located at approximately 122°36´E and 25°24´N, and their principal components demonstrated a variation of 4–6 years. The cold dome variation correlates best with the Oceanic Niño index and poorly with Pacific Decadal Oscillation index. The forcing could be wind stress curl and Kuroshio volume transport, which produce an upwelling around the Men-Hua Canyon. Positive wind stress curl and the on-shelf water transport of the Kuroshio Current through the North Men-Hua Canyon increase the chance of the cold dome formation which may be responsible for the interannual variability of cold domes.
1. Introduction
Cold domes are frequently observed northeast of Taiwan near the edge of the continental shelf. Historical hydrological observations and modelling studies showed a counterclockwise circulation with a diameter of 100 km, and a low temperature that is centred at 25.6°N and 122.1°E (Tang et al. Citation1999). The on-shelf intrusion of the Kuroshio causes subsurface water to well up, forming the features of low sea surface temperature (SST) and isotherms with a dome-like structure which is termed a cold dome or cold patch (Tang, Tai, and Yang Citation2000; Jan et al. Citation2011). Cold domes appear on the sea surface, and the accompanying upwelling brings the subsurface, nutrient-rich water to the surface, causing the region to be highly biologically productive (Chern and Wang Citation1990). The temperature and salinity inside a cold dome can be about 3°C below and 0.5 psu above those of the ambient shelf water at a depth of 50 m (Jan et al. Citation2011; Gopalakrishnan et al. Citation2013).
Numerous studies on the seasonal variability of cold domes northeast of Taiwan have been carried out using observational data, numerical models, and satellite-observed SST (e.g. Cheng et al. Citation2009; Jan et al. Citation2011; and Chau-Ron, Lu, and Chao Citation2008). Using the SST images of 6 years (2003–2008), Cheng et al. (Citation2009) demonstrated that the occurrence probability of cold dome is higher than 33% from July to September and lower than 4% from December to February. The occurrences of cold dome events mainly depend on the seasonal migration of the Kuroshio Current (Tang, Tai, and Yang Citation2000; Chau-Ron, Lu, and Chao Citation2008). In contrast to its behaviour during winter, the axis of the Kuroshio moves seaward during summer, away from the east coast of Taiwan, thereby enhancing the development of the cold dome (Tang et al. Citation1999; Gopalakrishnan et al. Citation2013). Chao (Citation1990) and Hsin, Chiang, and Chau-Ron (Citation2011) have suggested that the seasonal migration of the Kuroshio’s axis is caused by a surface Ekman drift associated with the reversal of the monsoon. Additionally, the monsoonal change of wind stress curl can induce a seasonal variation of near-surface upwelling above a depth of 30 m (Chang, Chau-Ron, and Oey Citation2009), where the formation of cold domes may increase. A recent numerical study by Shen, Tseng, and Jan (Citation2011) suggested that the water transport of the Kuroshio and topographical influences are mainly responsible for the formation of cold domes. The volume transport of the Kuroshio east of Taiwan is often low in winter (approximately 12 Sverdrup, Sv, 1 Sv = 106 m3 s−1) when the cold dome events are rare. High-transport events, by contrast, often appear in summer (approximately 30 Sv) and cause frequent cold dome events (Gopalakrishnan et al. Citation2013; Soeyanto et al. Citation2014; Gilson and Roemmich Citation2002).
El Niño-Southern Oscillation (ENSO) originates in the equatorial Pacific Ocean and is caused by surface wind stress and SST variations mediating between the ocean and the atmosphere (McPhaden, Zebiak, and Glantz Citation2006; Huang et al. Citation2015). ENSO is defined as the SST variability in the region of 5°N–5°S and 120°–170°W. When ENSO is in its warm phase, the SST is warmer in the eastern Pacific but cooler in the western Pacific. On one hand, the cold phase of ENSO, La Niña, tends to enhance the east Asian monsoon. On the other hand, the warm phase, El Niño, suppresses the east Asian monsoon (Lau and Nath Citation2006). The study of the thermal fronts off northeastern Taiwan by Hsin, Chiang, and Chau-Ron (Citation2011) demonstrated that the SST front is stronger in the La Niña summer than that in the El Niño summer. The volume transport of the Kuroshio between 1993 and 2001 was at its minimum during the 1997–1998 El Niño event and at its maximum during the La Niña event in 2000 (Gilson and Roemmich Citation2002). In addition, the Pacific Decadal Oscillations (PDO) is the other influencer of the interannual variability in the western North Pacific. The Kuroshio path moves seaward with larger volume transport in the warm phase of PDO and shifts shoreward in the opposite phase (Wang and Oey Citation2014; Wu Citation2013). Using the altimeter data of 16 years (1992–2008), Cheng et al. (Citation2009) analysed an upwelling region that may enhance the cold dome formation to the northeast of Taiwan and observed its seasonal and interannual variation over a period of 4.7 years. However, they focused mainly on the seasonal variability and formulating an identification algorithm. The factors contributing to the interannual variability of cold domes remain uncertain according to the previous studies.
2. Data and methodology
The daily SST data used in this study were derived from high-resolution blended analyses by the National Oceanic and Atmospheric Administration (NOAA). The optimum interpolation SST was constructed by combining multi-satellite data, ship observations, and buoy data (Reynolds et al. Citation2007). The data set was averaged onto a 1/4° grid by using data available from September 1981 to the present.
Daily absolute dynamic topography (ADT) maps, sea level anomaly (SLA) maps, and surface current fields were downloaded from the Archiving Validation and Interpretation of Satellite Oceanography (AVISO) data programme. A satellite altimeter supplies sea surface height within a period of 9.9156 days. The merged products were constructed using data from up to four satellites at a time and applying the data unification and altimeter combination system. Data were then interpolated onto a 1/4° × 1/4°Cartesian grid. The data set encompassed the period from January 1993 to the present. The SLA maps, which were computed by removing the 1993–2012 mean at each grid point, were smoothened with a low-pass filter of 3° × 3° to reduce mapping errors.
The sea surface wind (SSW) data from July 1987 to May 2017 were derived from the cross-calibrated multi-platform (CCMP) using remote-sensing systems. The CCMP gridded surface winds were integrated using satellite radiometer wind speeds, satellite scatterometer wind vectors, moored buoy wind data, and model wind fields. The CCMP SSW data set is a consistent and gap-free SSW vector field with 1-day temporal resolution and 1/4° spatial resolution (Atlas et al. Citation2011).
3. Results and discussion
3.1. Temporal variability of cold dome
shows the satellite SST image of a cold dome observed on 28 September 2014, of which the temperature was approximately 1°C cooler than the ambient temperature. Surface current anomaly adjusted the 20-year mean to reveal on-shelf intrusions through the North Mien-Hua Canyon. Cyclonic circulation induced a drop of temperature that formed around the edge of continental shelf. Moreover, the properties of the cold dome displayed in confirm that the cold SST has a close relationship with this negative SLA (i.e. cyclonic circulation in the northern hemisphere).
Figure 1. SST (shaded colour) blended with multi-satellite images and AVISO surface current anomalies (arrows) on 28 September 2014. The thicker black contour and the thinner white lines indicate the periphery of the automatically identified cold dome and isobaths, respectively. The dotted blue line represents the ground track of the satellite altimeter (Track 240) crossing precisely over the cold dome.
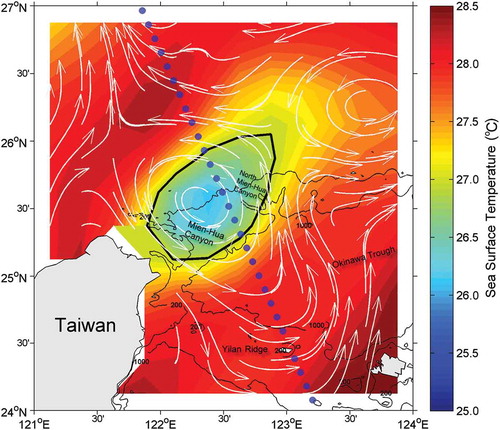
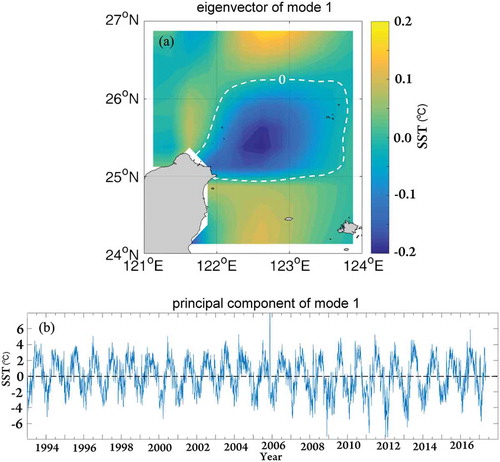
We used track-240 SLA data (dotted line in ) obtained over a period of 9.9156 days when crossing directly over the cold dome and SST to demonstrate the temporal variability of the cold dome on the interannual timescale. To distinguish the cold dome pattern from the long-term SLA and SST data, we applied empirical orthogonal function (EOF) (Kutzbach Citation1967). In this study, the two leading EOF were significantly different from the rest based on the criterion developed by North et al. (Citation1982). Based on the method of North et al. (Citation1982), the eigenvalue error for each EOF mode was estimated. When the associated error interval of an EOF mode overlaps that of the previous one, this EOF mode is not significant. This study focused on the first dominant mode of EOF which eigenvector can exhibit the spatial variation of the cold dome. Mode 1 of SLA and of SST accounted for 54% and 45%, respectively, of the total variance ( and ), more than double of the next largest mode 2. Both of mode 1eigenvector (EV1) revealed a substantial variation in sea level around 122°36´E and 25°24´N, which indicated the presence of the cold dome. This result is consistent with the cold dome region in the Hovmӧller plot of along-track SLA attained by Cheng et al. (Citation2009).
Figure 2. Empirical orthogonal function (EOF) of mode 1 (54%) with along-track SLA (track 240): (a) eigenvector of mode 1 (EV1) and (b) principal component of mode 1 (PC1). (c) Wavelet power spectrum of PC1 using the Morlet wavelet. The black contour encloses significant regions (90% confidence level); a lighter shade indicates the cone of influence where edge effects might distort the diagram.
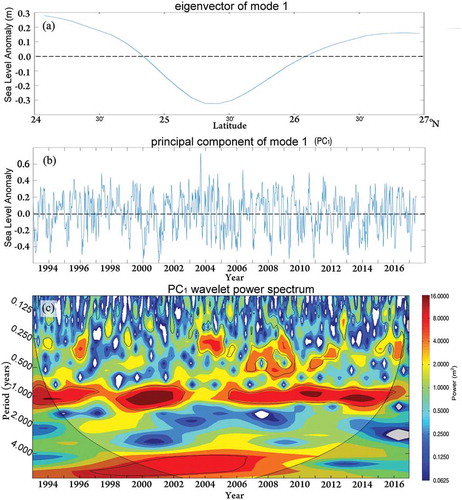
Figure 3. EOF of mode 1 (45%) with SST: (a) EV1 and (b) PC1.
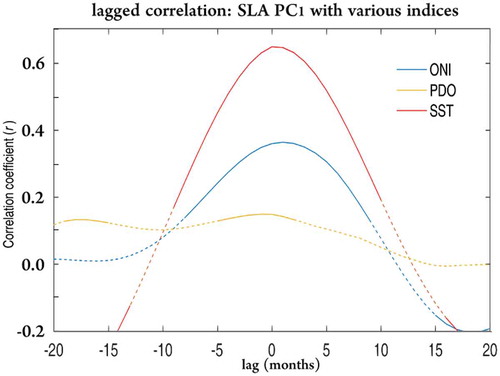
The principal component (PC1) of the mode 1 eigenvector showed intra-seasonal, seasonal, and inter-annual variations. A striking seasonal variation, wherein cold domes often form in summer but rarely formed in winter, is shown in ) and ). This mode accounts for the growth (when PC1 > 0) and suppression (when PC1 < 0) of the cold dome. To emphasize the interannual variability, a 12-month low-pass filter was applied of which the results were shown in . The cold dome appeared somewhat passive between 1996–1998, 2000–2002, and 2005–2007 but appeared more active from 1998–2000 and 2002–2004. To emphasize the interannual variability, the time series of the principal components were further analysed using a wavelet transform (Torrence and Compo Citation1998). ) illustrates the wavelet power spectrum derived from the Morlet wavelet. With a 90% confidence interval, the power was mainly concentrated at the annual and interannual (4–6 years) periods although there was appreciable power observed within shorter periods. The 4-to-6-year band for cold domes may be associated with the variation of the 2-to-8-year band for various climate indices (Gehne, Kleeman, and Trenberth Citation2014). We further examined how SLA PC1 correlates with SST, Oceanic Niño index (ONI), and PDO to pinpoint the cause of the cold dome fluctuations. SLA PC1 is best correlated with SST PC1 with a correlation coefficient r = 0.68 (). This result could be construed by the phenomenon of upwelling which often induces low SLA and low SST, but sometime low SST do not surge along with low SLA. SLA can reveal a total sea-level variation containing surface and subsurface. The intrusion of the cold subsurface Kuroshio water may not necessarily cause the low temperature signature on the surface (Chau-Ron, Lu, and Chao Citation2008). In addition, the r is 0.38 for ONI which often yields short lags (about 1 month), but sometimes ONI has the lead. The correlation of SLA PC1 with PDO is poor, suggesting that its connections with the cold dome variation are tenuous.
Figure 4. Twelve-month low-pass filtered time series of (a) SLA PC1 (blue) and SST PC1 (orange) and (b) ONI (yellow) and PDO (green).
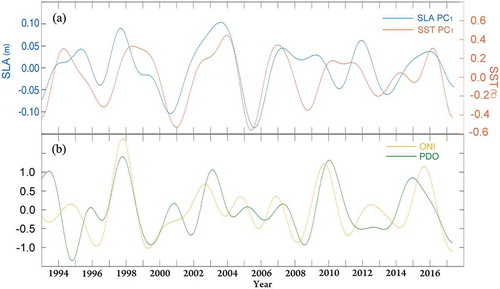
Figure 5. Lagged correlations of SLA PC1 with SST PC1, ONI, and PDO. Dash-dots indicate an insignificant correlation coefficient (r) at the 95% confidence level.
3.2. Effects of wind stress curl
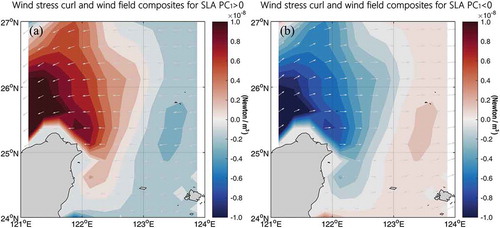
Wind fields around Taiwan are largely dominated by the east Asian monsoons. In a study by Jan, Sheu, and Kuo (Citation2006), wind data derived from a weather station northeast of Taiwan indicated that the southwest monsoon usually sets in between May and August, and the northeast monsoon sets in during the rest of the year. CCMP-derived wind fields from January 1993 to May 2017 were used in this study. The wind stress curl was positive over the majority of the studied region ()), suggesting that cold domes could be intensified by wind stress curl. During SLA PC1 < 0 periods, on one hand, negative anomalies regarding wind stress curl were observed ()) which may weaken upwelling and substantially affect the extent of the cold dome activities. On the other hand, positive wind stress curl intensified during SLA PC1 > 0 periods which may enhance upwelling and increase the likelihood of the cold dome formation. However, wind is responsible only for upwelling near the surface (above a depth of 30 m) (Chang, Chau-Ron, and Oey Citation2009), and modelling studies (Chau-Ron, Lu, and Chao Citation2008; Shen, Tseng, and Jan 2011) have suggested that cold dome occurrence depends on the Kuroshio’s axis and water transport more than on surface Ekman transport caused by local wind. Hence, we address the effect of current fields in the following section.
Figure 6. Wind fields (arrows) and wind stress curl (shaded) for (a) SLA PC1 > 0 and for (b) SLA PC1 < 0.
3.3. Impacts of the Kuroshio Current
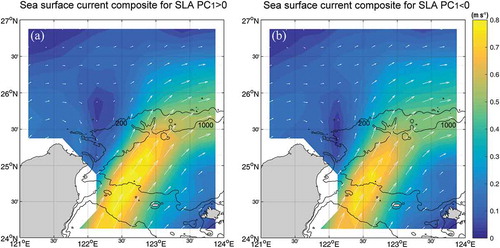
From the geostrophic current pattern derived from AVISO, the northeastward Kuroshio prevailed in the northeast of Taiwan throughout the year. The axis of the Kuroshio is mainly located between Taiwan and Yonaguni Island (121°30´–123°E), and the current enters the East China Sea through the Yilan Ridge and heads northeastward towards the east around the North Mien-Hua Canyon when approaching the continental shelf (). The path of the Kuroshio Current is resulted from the effects of the surrounding bathymetry (Hsin, Chiang, and Chau-Ron Citation2011). ) indicates that the Kuroshio Current exhibits stronger northeastward currents that are approximately 0.8 m s−1 in scale along its path from the North Mien-Hua Canyon to the east of Taiwan. This implies that on-shelf water transport through the North Men-Hua Canyon is more abundant during SLA PC1 > 0 than the typical conditions which should result in a higher growth rate of cold domes. By contrast, the on-shelf current around the North Men-Hua Canyon is slightly weakened during SLA PC1 < 0 ()). This implies that the variation of the Kuroshio Current to the northeast of Taiwan should modulate the occurrence of cold domes.
Figure 7. Surface current vectors (arrows) and speed (shaded) derived from ADT for (a) SLA PC1 > 0 and for (b) SLA PC1 < 0.
4. Conclusions
This study applied EOF analysis to an altimetry data set (track 240) of 24 years (1993–2017) to study the cold domes northeast of Taiwan. The SLA EV1 (67% of the total variance) and SST EV1 indicated a great variation in sea level around 122.6°E and 25.4°N, and their PC1 illustrated significant periods of intra-seasonal, seasonal, and inter-annual (around 4–6 years) variations. At the inter-annual periods, variability of cold dome is best correlated with the ONI and poorly with the PDO index. Wang, Renguang, and Xiouhua (Citation2000) presented a strong teleconnection between the East Asian monsoons and the ENSO cycles, and the relationship between the East Asian winter monsoon and the ENSO can be modulated by the PDO (Chen, Feng, and Renguang Citation2013). This suggests the East Asian monsoon mainly connects with ENSO although their relationship could be modulated by the PDO. However, the mechanism of the interaction between the PDO and the ENSO is complex and needs to be further investigated.
The dominant mode is related to wind stress curl and on-shelf water transport of Kuroshio. The stronger positive wind stress curl and wind stress can give rise to turbulence mixing and upwelling, which induce lower SLA and cooler SST. In addition, when Kuroshio water transport is larger, there could be more water in on-shelf intrusion through the North Men-Hua Canyon, which can induce a cyclonic recirculation around 122°36´E and 25°24´N and display a low SLA pattern. Although the change of Kuroshio transport is obvious compared to the wind variability, both would be accounted for the interannual variability of cold domes. Moreover, cold domes have effects on the shelf water temperature of which the variation is in concert with the inter-annually variability of SLA. Upwelling can raise cooler water to the sea surface that may alter the ecosystem of the shelf northeast of Taiwan. These results imply that the interannual variability of cold domes could be associated with the ENSO through wind stress curl and Kuroshio transport anomalies.
Acknowledgments
The authors appreciate all the constructive comments from reviewers. The altimeter products were produced by Ssalto/Duacs and distributed by Aviso, with support from Cnes (http://www.aviso.altimetry.fr/duacs/). CCMP Version-2.0 vector wind analyses are produced by Remote Sensing Systems. Data are available at www.remss.com. NOAA High Resolution SST data provided by the NOAA/OAR/ESRL PSD, Boulder, Colorado, USA, from their web site at http://www.esrl.noaa.gov/psd/. ONI values were provided by the NOAA Climate Prediction Center (http://www.cpc.ncep.noaa.gov).
Disclosure statement
No potential conflict of interest was reported by the authors.
Additional information
Funding
Related Research Data
References
- Atlas, R., R. N. Hoffman, J. Ardizzone, S. Mark Leidner, J. C. Jusem, D. K. Smith, and D. Gombos. 2011. “A Cross-Calibrated, Multiplatform Ocean Surface Wind Velocity Product for Meteorological and Oceanographic Applications.” Bulletin of the American Meteorological Society 92 (2): 157. doi:10.1175/2010BAMS2946.1.
- Chang, Y.-L., W. Chau-Ron, and L.-Y. Oey. 2009. “Bimodal Behavior of the Seasonal Upwelling off the Northeastern Coast of Taiwan.” Journal of Geophysical Research: Oceans 114: C3. doi:10.1029/2008JC005131.
- Chao, S.-Y. 1990. “Circulation of the East China Sea, a Numerical Study.” Journal of the Oceanographical Society of Japan 46 (6): 273–295. doi:10.1007/BF02123503.
- Chau-Ron, W. 2013. “Interannual Modulation of the Pacific Decadal Oscillation (PDO) on the Low-Latitude Western North Pacific.” Progress in Oceanography 110: 49–58. doi:10.1016/j.pocean.2012.12.001.
- Chau-Ron, W., H.-F. Lu, and S.-Y. Chao. 2008. “A Numerical Study on the Formation of Upwelling off Northeast Taiwan.” Journal of Geophysical Research: Oceans 113: C8. doi:10.1029/2007JC004697.
- Chen, W., J. Feng, and W. Renguang. 2013. “Roles of ENSO and PDO in the Link of the East Asian Winter Monsoon to the following Summer Monsoon.” Journal of Climate 26 (2): 622–635. doi:10.1175/JCLI-D-12-00021.1.
- Cheng, Y.-H., H. Chung-Ru, Z.-W. Zheng, Y.-H. Lee, and N.-J. Kuo. 2009. “An Algorithm for Cold Patch Detection in the Sea off Northeast Taiwan Using Multi-Sensor Data.” Sensors 9 (7): 5521–5533. doi:10.3390/s90705521.
- Chern, C.-S., and J. Wang. 1990. “The Exchange of Kuroshio and East China Sea Shelf Water.” Journal of Geophysical Research 95 (16): 16017–16023. doi:10.1029/JC095iC09p16017.
- Gehne, M., R. Kleeman, and K. E. Trenberth. 2014. “Irregularity and Decadal Variation in ENSO: A Simplified Model Based on Principal Oscillation Patterns.” Climate Dynamics 43 (12): 3327-3350. doi:10.1007/s00382-014-2108-6.
- Gilson, J., and D. Roemmich. 2002. “Mean and Temporal Variability in Kuroshio Geostrophic Transport South of Taiwan (1993–2001).” Journal of Oceanography 58 (1): 183–195. doi:10.1023/A:1015841120927.
- Gopalakrishnan, G., B. D. Cornuelle, G. G. Gawarkiewicz, and J. L. McClean. 2013. “Structure and Evolution of the Cold Dome off Northeastern Taiwan: A Numerical Study.” Oceanography 26. doi:10.5670/oceanog.2013.06.
- Hsin, Y.-C., T.-L. Chiang, and W. Chau-Ron. 2011. “Fluctuations of the Thermal Fronts off Northeastern Taiwan.” Journal of Geophysical Research: Oceans 116: C10. doi:10.1029/2011JC007066.
- Huang, B., V. F. Banzon, E. Freeman, J. Lawrimore, W. Liu, T. C. Peterson, T. M. Smith, P. W. Thorne, S. D. Woodruff, and H.-M. Zhang. 2015. “Extended Reconstructed Sea Surface Temperature Version 4 (ERSST. V4). Part I: Upgrades and Intercomparisons.” Journal of Climate 28 (3): 911–930. doi:10.1175/JCLI-D-14-00006.1.
- Jan, S., C.-C. Chen, Y.-L. Tsai, Y.-J. Yang, J. Wang, C.-S. Chern, G. G. Gawarkiewicz, R.-C. Lien, L. R. Centurioni, and J.-Y. Kuo. 2011. “Mean Structure and Variability of the Cold Dome Northeast of Taiwan.” Oceanography 24. doi:10.5670/oceanog.2011.98.
- Jan, S., D. D. Sheu, and H.-M. Kuo. 2006. “Water Mass and Throughflow Transport Variability in the Taiwan Strait.” Journal of Geophysical Research: Oceans 111: C12. doi:10.1029/2006JC003656.
- Kutzbach, J. E. 1967. “Empirical Eigenvectors of Sea-Level Pressure, Surface Temperature and Precipitation Complexes over North America.” Journal of Applied Meteorology 6 (5): 791–802. doi:10.1175/1520-0450(1967)006<0791:EEOSLP>2.0.CO;2.
- Lau, N.-C., and M. J. Nath. 2006. “ENSO Modulation of the Interannual and Intraseasonal Variability of the East Asian monsoon-A Model Study.” Journal of Climate 19 (18): 4508–4530. doi:10.1175/JCLI3878.1.
- McPhaden, M. J., S. E. Zebiak, and M. H. Glantz. 2006. “ENSO as an Integrating Concept in Earth Science.” Science 314 (5806): 1740–1745. doi:10.1126/science.1132588.
- North, G. R., T. L. Bell, R. F. Cahalan, and F. J. Moeng. 1982. “Sampling Errors in the Estimation of Empirical Orthogonal Functions.” Monthly Weather Review 110 (7): 699–706. doi:10.1175/1520-0493(1982)110<0699:SEITEO>2.0.CO;2.
- Reynolds, R. W., T. M. Smith, C. Liu, D. B. Chelton, K. S. Casey, and M. G. Schlax. 2007. “Daily High-Resolution-Blended Analyses for Sea Surface Temperature.” Journal of Climate 20 (22): 5473–5496. doi:10.1175/2007JCLI1824.1.
- Shen, M.-L., Y.-H. Tseng, and S. Jan. 2011. “The Formation and Dynamics of the Cold-Dome off Northeastern Taiwan.” Journal of Marine Systems 86 (1): 10–27. doi:10.1016/j.jmarsys.2011.01.002.
- Soeyanto, E., X. Guo, J. Ono, and Y. Miyazawa. 2014. “Interannual Variations of Kuroshio Transport in the East China Sea and Its Relation to the Pacific Decadal Oscillation and Mesoscale Eddies.” Journal of Geophysical Research: Oceans 119 (6): 3595–3616. doi:10.1002/2013JC009529.
- Tang, T. Y., J. H. Tai, and Y. J. Yang. 2000. “The Flow Pattern North of Taiwan and the Migration of the Kuroshio.” Continental Shelf Research 20 (4): 349–371. doi:10.1016/S0278-4343(99)00076-X.
- Tang, T. Y., Y. Hsueh, Y. J. Yang, and J. C. Ma. 1999. “Continental Slope Flow Northeast of Taiwan.” Journal of Physical Oceanography 29 (6): 1353–1362. doi:10.1175/1520-0485(1999)029<1353:CSFNOT>2.0.CO;2.
- Torrence, C. and G. P. Compo. 1998. “A Practical Guide to Wavelet Analysis.” Bulletin of the American Meteorological Society 79 (1): 61–78. doi: 10.1175/1520-0477(1998)079<0061:apgtwa>2.0.CO;2.
- Wang, B., W. Renguang, and F. Xiouhua. 2000. “Pacific–East Asian Teleconnection: How Does ENSO Affect East Asian Climate?” Journal of Climate 13 (9): 1517–1536. doi:10.1175/1520-0442(2000)013<1517:PEATHD>2.0.CO;2.
- Wang, J., and L.-Y. Oey. 2014. “Inter-Annual and Decadal Fluctuations of the Kuroshio in East China Sea and Connection with Surface Fluxes of Momentum and Heat.” Geophysical Research Letters 41 (23): 8538–8546. doi:10.1002/2014GL062118.