
ABSTRACT
South Korea has experienced severe droughts and water scarcity problems that have influenced agriculture, food prices, and crop production in recent years. Traditionally, climate-based drought indices using point-based meteorological observations have been used to help quantify drought impacts on the vegetation in South Korea. However, these approaches have a limited spatial precision when mapping detailed vegetation stress caused by drought. For these reasons, the development of a drought index that provides detailed spatial-resolution information on drought-affected vegetation conditions is essential to improve the country’s drought monitoring capabilities, which are needed to help develop more effective adaptation and mitigation strategies. The objective of this study was to develop a satellite-based hybrid drought index called the vegetation drought response index for South Korea (VegDRI-SKorea) that could improve the spatial resolution of agricultural drought monitoring on a national scale. The VegDRI-SKorea was developed for South Korea, modifying the original VegDRI methodology (developed for the USA) by tailoring it to the available local data resources. The VegDRI-SKorea utilizes a classification and regression tree (CART) modelling approach that collectively analyses remote-sensing data (e.g. normalized difference vegetation index (NDVI)), climate-based drought indices (e.g. self-calibrated Palmer drought severity index (PDSI) and standardized precipitation index (SPI)), and biophysical variables (e.g. elevation and land cover) that influence the drought-related vegetation stress. This study evaluates the performance of the recently developed VegDRI-SKorea for severe and extreme drought events that occurred in South Korea in 2001, 2008, and 2012. The results demonstrated that the hybrid drought index improved the more spatially detailed drought patterns compared to the station-based drought indices and resulted in a better understanding of drought impacts on the vegetation conditions. The VegDRI-SKorea model is expected to contribute to the monitoring of drought conditions nationally. In addition, it will provide the necessary information on the spatial variations of those conditions to evaluate local and regional drought risk assessment across South Korea and assist local decision-makers in drought risk management.
1. Introduction
Drought poses significant water and food security concerns in many parts of the world and can lead to negative agricultural, economic, and environmental impacts (Wilhite et al. Citation2000; Hayes et al. Citation2011). In comparison to other natural hazards, droughts frequently have greater economic, environmental, and social consequences (Wilhite Citation1997; Heim Citation2002). According to a World Bank global natural disaster report (Dilley et al. Citation2005), about 38% of the world’s land area has some level of drought exposure, and this area contains about 70% of the total global population and agricultural production. As a result, it is essential to monitor and assess drought conditions and associated impacts more accurately to help decision-makers develop more timely and efficient risk management strategies (Hayes et al. Citation1999; Svoboda et al. Citation2002).
Understanding how droughts develop, evolve, and affect us is vital in the preparation and planning for droughts and for mitigating their impacts (Hayes, Wilhelmi, and Knutson Citation2004; Svoboda et al. Citation2015). Traditionally, climate-based drought indices calculated from station-based meteorological observations (e.g. precipitation and air temperature) have been used to characterize drought conditions throughout the world. Examples of these commonly used indices include the Palmer drought severity index (PDSI; Palmer Citation1965), deciles (Gibbs and Maher Citation1967), standardized precipitation index (SPI; McKee, Doesken, and Kleist Citation1993), and standardized precipitation evapotranspiration index (SPEI; Vicente-Serrano, Begueria, and Lopez-Moreno Citation2010). Because these indices are based on ground-based point observations, they are typically spatially interpolated using spatial statistical techniques (e.g. inverse distance weighting (IDW)) to grids to generate spatially continuous maps of drought severity patterns. The accuracy of the spatial drought patterns depicted in these interpolated grids is highly dependent on the spatial density and distribution of the stations with less spatial precision as the distance between stations increases. As a result, traditional climate-based drought index maps often depict broad-scale drought patterns that do not depict local-scale spatial variations in drought conditions (Mokhtari, Adnan, and Busu Citation2013; Yan et al. Citation2014; Boyte et al. Citation2015).
Satellite remote sensing has provided an alternative means of acquiring spatially detailed and more localized information about drought severity patterns because of the spectral observations that are collected across the entire landscape (Liu and Kogan Citation1996; Kogan Citation2001, Citation2002; Agam et al. Citation2007; Anderson et al. Citation2011, Citation2013; Yang, Shang, and Jiang Citation2012; Mu et al. Citation2013; Otkin et al. Citation2014; AghaKouchak et al. Citation2015; Bokusheva et al. Citation2016; Martinez-Fernandez et al. Citation2016; Wang et al. Citation2016). Over the past few decades, the satellite-derived normalized difference vegetation index (NDVI) data have been widely used for vegetation and drought monitoring (Peters et al. Citation2002; Ghulam et al. Citation2007; Gu et al. Citation2007, Citation2008; Philippon et al. Citation2007; Rojas, Vrieling, and Rembold Citation2011; Hao, Zhang, and Yao Citation2015; Vicente-Serrano et al. Citation2015; Wu, Qu, and Hao Citation2015). The analyses of time-series NDVI data have been effective for identifying vegetation condition anomalies as determined by comparing the current vegetation status to the long-term historical average status for the same time period during the calendar year (Wardlow, Egbert, and Kastens Citation2007; Pervez, Budde, and Rowland Citation2014; Tadesse et al. Citation2015b). Although remote sensing-based indices such as NDVI have proved valuable for monitoring general vegetation condition, they are somewhat limited for effectively characterizing the impacts of drought on vegetation (Karnieli et al. Citation2010; Wardlow et al. Citation2012). A negative vegetation condition anomaly expressed in the NDVI data record can be related to many types of plant stresses in addition to drought. These stresses include excessively wet conditions (e.g. chlorosis in plants), hail damage, pest infestations, plant pathogens and viruses, and land-use/land-cover (LULC) changes. As a result, additional information is often required to discern the drought-affected areas from locations where the vegetation is influenced by other environmental and anthropogenic factors.
An alternative hybrid drought index called the Vegetation Drought Response Index (VegDRI) (Brown et al. Citation2008) has been developed to provide drought-specific information that addresses the limitations of the traditional climate- and satellite-based indices discussed earlier. The VegDRI incorporates both the satellite-derived vegetation index data with traditional climate-based drought index information and also considers the LULC type, soils, elevation, and ecological setting to determine the severity of agricultural drought for a given location (Brown et al. Citation2008; Tadesse et al. Citation2010). The VegDRI is an operational tool for the continental USA developed by the National Drought Mitigation Center (NDMC) and U.S. Geological Survey (USGS) Earth Resources Observation and Science (EROS) Center. The VegDRI information has been used by the U.S. Drought Monitor (USDM) and for other drought-related applications, including forest mortality assessments and wildfire potential. In addition, VegDRI can develop differentiated drought indicators by tailoring them to the available local data resources such as climate and biophysical information depending on the application area (Wardlow et al. Citation2012; Tadesse et al. Citation2014).
In recent years, there has been a growing global concern that droughts may be increasing in frequency, severity, and duration given changing climatic conditions and documented increases in extreme climate events (Wilhite, Sivakumar, and Pulwarty Citation2014). South Korea has experienced severe droughts and water scarcity problems influencing agriculture, food prices, and crop production (Nam et al. Citation2012a; Hong et al. Citation2016). According to the Korea Rural Community Corporation (KRC), historical extreme droughts in South Korea occurred from 1994 to 1995, 2000 to 2001, 2008, and 2012, specifically over the paddy/rice-growing period from April to October (Kim et al. Citation2011). Previous studies have also shown that most parts of the central and southwest regions of South Korea experienced an increase in drought frequency and severity, especially after the mid-1990s (Nam et al. Citation2012b; Lee, Oh, and Byun Citation2015). Faced with these challenges, decision-makers in South Korea need spatially explicit and timely information to help develop drought preparedness plans and enhanced decision support systems to deliver timely and reliable drought information (Nam et al. Citation2015b). In South Korea, researchers mainly use traditional methods in applying climate indices based on rainfall data for drought assessment and monitoring. The Korea Meteorological Administration (KMA) (www.kma.go.kr) determines current drought conditions using the SPI, PDSI, and the precipitation anomaly percentage. However, the existing monitoring system has limitations because the KMA provides only meteorological drought indices, and these indicators may not adequately reflect the impacts of agricultural drought across multiple regions. In addition, these drought monitoring tools cannot provide the necessary spatially detailed drought information, especially at the local level, because they provide only the station-based drought conditions. Therefore, improved drought monitoring models based on climate and remote-sensing data are essential to the development of effective adaptation and mitigation strategies for drought planning and preparedness.
This study focused on the development of a customized version of the VegDRI for South Korea, called the vegetation drought response index for South Korea (VegDRI-SKorea). It adopted a suite of remote-sensing, climate, and biophysical data inputs and modelling schemes similar to those developed by Brown et al. (Citation2008) in an effort to provide a high spatial resolution agricultural drought monitoring tool for the country. The specific objectives of this study are (i) to develop a tailored VegDRI-SKorea tool based on the specific climatic, remote-sensing, and biophysical data sets available for the country; (ii) to assess the impacts of the recent major drought events across South Korea for the 2001, 2008, and 2011 drought events to establish a drought impact record to compare to the VegDRI-SKorea results over the paddy/rice-growing period from April to October; and (iii) to compare the agricultural drought patterns detected by the VegDRI-SKorea to vegetation-related drought impacts and assess how well this index characterized those observed impacts for selected cases.
2. Study area description
The Korean Peninsula is located between China and Japan in East Asia (35°50ʹ N, 127°00ʹ W). The climate variability in South Korea has complex spatial and temporal variations because of the varying climatic and topographic characteristics arising from a complicated mountainous terrain. shows the land-cover map and spatial distribution of the weather stations. These data were classified according to land-cover type (agricultural, forest, and rangeland) on a Landsat satellite image (2000) obtained from the Korean Water Management Information System. Approximately 70% of the total paddy/rice fields lie in the western and southern lowlands, with the rest in the valleys between mountains. A mountain range runs along the east coast, and the rivers flow to the west and south. The central and southwest regions are agricultural areas. According to the Ministry for Food, Agriculture, Forestry and Fisheries of South Korea (2011), agricultural water withdrawal accounts for approximately 47% of the total water use in South Korea and is mostly utilized for paddy irrigation. South Korea’s land area is 100.0 × 10³ km2, of which 17.1% is farmland and 62.2% is forest. Of the farmland, 18.1% is composed of paddy fields (9.8%) and upland fields (7.3%) (Nam, Hong, and Choi Citation2015a). The rice-growing period is from April to October, and monoculture is the general practice. April is the nursery period, with seedlings being transplanted in late May. Irrigation water is supplied from May to September, and rice is harvested in late October.
Figure 1. Locations of meteorological stations and land-cover map (Korean Water Management Information System).
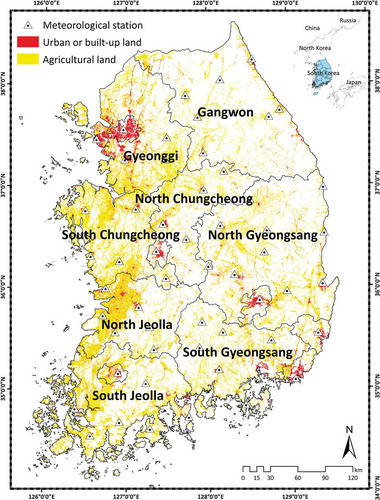
The station-based observed daily meteorological data were obtained from the KMA. Two criteria were used to screen the data and select the stations. First, a station must have had a record of more than 30 years. Second, a station was removed if more than 10% of the data was missing for any month during its record. All data were organized and screened for errors and missing values. After the screening process, the final database for 54 meteorological stations was selected, as shown in . In this study, the historical weather data periods covered 13 years from 2001 to 2013. The daily meteorological variables of average temperature (°C) and precipitation (mm) were used to calculate the drought indices of the SPI and self-calibrated PDSI (Wells, Goddard, and Hayes Citation2004). The daily meteorological data were adjusted to remove biases caused by changes in the observation time, instrument changes, and the movement of meteorological stations.
3. Materials and methods
3.1. Vegetation drought response index in South Korea
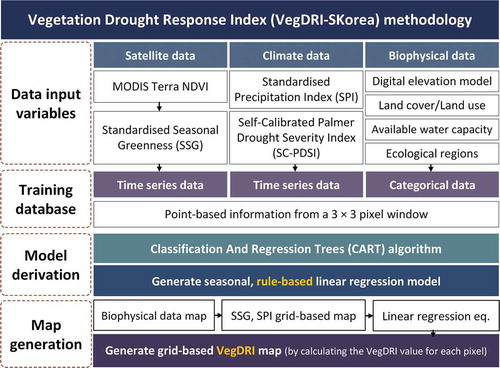
The VegDRI methodology, by design, specifically targets the effects of drought on vegetation and represents a compositing approach that integrates traditional climate-based drought index information and satellite-based NDVI measures of vegetation conditions with several biophysical and environmental characteristics (Tadesse, Brown, and Hayes Citation2005; Brown et al. Citation2008; Wardlow et al. Citation2012). The VegDRI-SKorea methodology consists of four primary steps, as shown in . The first step was to organize the input data for the seven variables (). The input data used in VegDRI-SKorea consists of three major variable categories: satellite data, climate data, and biophysical data. A 13-year historical record (2001–2013) of climate-based drought indices and satellite-derived NDVI observations was included in the input database. The biophysical variables, including land cover, are considered to be static (i.e. they remain unchanged over the 13-year historical record) in the VegDRI-SKorea models. The second step was to create the training database using historical time-series data that includes both continuous and categorical data. The point data for training are extracted from gridded data input variables (e.g. digital elevation model (DEM), land cover (LC), soil available water capacity (AWC), and ecological regions (ECO)) and combined with tabular historical climate-based variables (e.g. SPI and self-calibrated PDSI). For each variable, the point-based information was summarized for each weather station location and then subdivided into thirteen 16-day periods over the paddy-/rice-growing season from April to October. The third step was to generate an empirically derived model for the 16-day periods across the calendar year by applying a classification and regression tree (CART) algorithm to the information in the training database. The fourth and final step was to apply the rule-based linear regression models to the geospatial data to produce a 250-m resolution grid-based VegDRI-SKorea map by calculating the VegDRI values for each pixel. The models were applied at a 16-day time-step to the geospatial data to produce a map for each respective period. A 16-day interval (period) was selected to be consistent with the 16-day temporal compositing interval of the Moderate Resolution Imaging Spectroradiometer (MODIS) NDVI data used in this study.
Table 1. Data input variables for the VegDRI-SKorea model.
Figure 2. Flow chart of the process used to produce the VegDRI-SKorea model.
3.2. Data inputs for the VegDRI-SKorea model
3.2.1. Satellite-based NDVI-related variables
The satellite data used in this study include 16-day composite, 250-m MODIS NDVI (MOD13) data obtained from the USGS MODIS EarthExplorer data archive (http://earthexplorer.usgs.gov). The historical MODIS NDVI data from 2001 to 2013 were preprocessed using the original MODIS data source and the atmospheric correction algorithm obtained from the Preprocess Program for MODIS satellite images (RDA Citation2011).
The time-series MODIS NDVI data were used to calculate the one vegetation-related variable, the standardized seasonal greenness (SSG) (Tadesse et al. Citation2014) for incorporation into the VegDRI-SKorea model. The SSG represents the accumulated NDVI through the growing season, which is standardized both spatially and temporally. With a higher SSG, the vegetation is more productive, and anomalously low SSG values are indicative of stressed vegetation. A time series of SSG observations produced from the 16-day MODIS 250-m NDVI data was calculated for each year in the 13-year historical record to provide vegetation condition information for the VegDRI-SKorea model. To calculate the SSG, seasonal greenness (SG) is first calculated using Equation (1):
where is the seasonal greenness,
is the start of growing season,
is the end of growing season, and i is the unit of time (16-day). The growing season times were provided by a growing period of paddy/rice from April to October in South Korea.
The SSG metric is then calculated for each 16-day time-step for each year using the following standardization formula in Equation (2):
where is the current SSG for each period,
is the average SG observed in the historical record up to time period i, and
is the standard deviation of these historical
values.
The range of possible values for relative greenness in the SSG measurement is determined by the ratio of the current NDVI to the mean NDVI for a time period for each pixel. The result is a historical time series of SSG over 13 years, which have zero-centered values in deviation units (ranging from −4.0 to +4.0) reflecting general vegetation conditions that are spatiotemporally comparable over both space and time because of the standardization process (Wardlow et al. Citation2012). The SSG values greater than zero represent above-average vegetation conditions often representative of above-average vegetation production, whereas values less than zero reflect below-average conditions that can be indicative of drought stress.
3.2.2. Climate-based drought index variables
The climate-based independent variable integrated into the empirical-based VegDRI-SKorea was the SPI, which is designed to quantify the precipitation anomaly for a defined time period (e.g. 1, 3, 12, 24, or 36 weeks), based on the long-term precipitation record. The SPI is calculated by fitting the long-term precipitation record over a specific time-step to a probability distribution, which is then transformed to a gamma distribution (Trnka et al. Citation2009). The positive and negative SPI values represent more and less precipitation, respectively, compared to the historical mean precipitation (Edwards and McKee Citation1997). In this study, the station-based SPI data were calculated for 12 time intervals ranging from 4 to 52 weeks, and each SPI was tested separately in the VegDRI-SKorea models to determine the specific SPI interval that provided the best model accuracy. presents the results from this testing. A 36-week SPI at the 16-day time-step was selected for the VegDRI-SKorea model after exhaustive statistical testing of all SPI time intervals. The selection was based on the SPI that had a consistently high correlation coefficient (r) value across all growing season periods. This index (36-week SPI) has been tested and used for the original VegDRI methodology (i.e. developed for the USA) (Brown et al. Citation2008; Wardlow et al. Citation2012).
Table 2. Results of the SPI testing as an input for the VegDRI-SKorea model.
The self-calibrated PDSI at the 2-week time-step, which reflects how soil moisture conditions compare to normal conditions using a supply-and-demand model of a water balance equation, was used as the dependent variable in the VegDRI-SKorea model. This index was an appropriate dependent variable for the VegDRI model in the USA (Brown et al. Citation2008; Tadesse et al. Citation2015a) because the self-calibrated PDSI accounts for the effects of precipitation and temperature, both of which strongly influence drought stress on vegetation, as well as other local conditions (e.g. soil type and texture).
3.2.3. Static biophysical variables
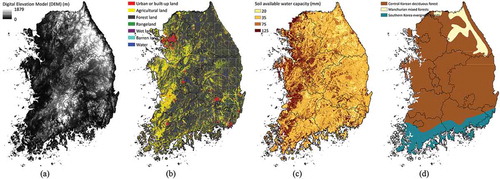
Several biophysical variables describing various environmental characteristics that influence climate–vegetation interactions were integrated into the VegDRI-SKorea model, including the elevation from the DEM, LULC type, soil AWC, and ECO (). The elevation data were included along with the soil AWC because spatial variations in both of these landscape characteristics can result in differing levels of sensitivity to drought stress for a given LULC type (Tadesse et al. Citation2015a). The elevation data were obtained from the NASA Shuttle Radar Topographic Mission (SRTM) in the form of a resampled 250-m DEM extracted from the global 3-arc second elevation data set referred to as Version 4 (Jarvis et al. Citation2008). The LULC data were obtained from the USGS 1-km Global Land Cover Data set and resampled to the 250-m grid resolution to be used in developing the VegDRI-SKorea model. The LULC data map was aggregated into six thematic classes: urban/built-up land, agricultural land, forestland, rangeland, wet land, and barren land ()). The LULC data are included in the VegDRI-SKorea model to better parameterize the NDVI signals and climate-vegetation responses exhibited by the different land-cover types (Brown et al. Citation2008). The soil AWC represents the variability among soils to hold moisture and make it available to plants. The soil AWC data were acquired from the Korean Soil Information System of the Rural Development Administration. The ECO data are used to define different ecoregion zones within the country, which are relatively large areas of land and/or water containing a characteristic set of natural communities that share a large majority of their species, ecological dynamics, and environmental conditions (Olson and Dinerstein Citation2002). The ecoregion variable provides a geographic framework to account for the considerable variability in environmental conditions that can influence basic climate conditions and the level of drought stress on vegetation (Wardlow et al. Citation2012; Tadesse et al. Citation2014). In South Korea, the ECO data are mainly determined based on vegetation types obtained from the Nature Conservancy, and they delineate the regional-scale units of biodiversity that include the Central Korean deciduous forest, Manchurian mixed forests, and southern Korea evergreen forests ()).
Figure 3. Static biophysical variables. (a) Digital elevation model (DEM), (b) land cover/land use, (c) soil available water capacity, (d) ecological regions.
3.2.4. VegDRI-SKorea model development using the training database
To develop the VegDRI-SKorea model, a training database of the aforementioned satellite-based, climate-based, and biophysical variables was assembled for a total of 13 years from 2001 to 2013 for 54 selected weather stations. Summarized zonal statistics for the area surrounding each station were calculated for all the variables in a raster format from a 3 × 3 pixel window centered on each station location. The average zonal value was used for all variables in a continuous data format (e.g. the soil AWC) and the majority class for variables in a nominal data format (e.g. the LULC and ECO). The historical time series of the SSG and SPI data were sequentially ordered for each station. The biophysical variables were considered static, and their single constant values remained constant across time in the database. The extracted records in the database were temporally subdivided into 16-day time periods () to accommodate the development of the period-specific VegDRI-SKorea models.
Table 3. The VegDRI-SKorea classification of drought-induced vegetation stress scheme and value ranges.
Table 4. Evaluation of the VegDRI-SKorea model (Tadesse, Brown, and Hayes Citation2005; Brown et al. Citation2008; Wardlow et al. Citation2012).
3.2.5. VegDRI-SKorea model generation using a regression tree analysis
After the training database was assembled for each station, the VegDRI-SKorea models for each 16-day time period were generated using a regression tree analysis software called Cubist (Rulequest Research Citation2015). The CART approach, which was originally developed by Breiman et al. (Citation1984), generates a series of rule-based linear regression models using the historical data in the training database. The CART algorithm performs a binary recursive partitioning, and this process is repeated, further subdividing the training data until the partitioning process is terminated by user-defined criteria (e.g. minimum rule cover or percent of cases allowed to generate a rule; Breiman et al. Citation1984) (Tadesse et al. Citation2004; Tadesse, Brown, and Hayes Citation2005; Wardlow et al. Citation2012).
In the VegDRI-SKorea model, 80% of the historical data were used for training and 20% were withheld to validate the model results. Each rule set has a corresponding multivariate linear regression equation that can be used to produce the values of the VegDRI-SKorea. The VegDRI-SKorea models are composed of an unordered set of rules, with each rule having the syntax: if x conditions are met, then use the associated linear regression model. An example of the rules generated by the Cubist algorithm for VegDRI-SKorea is given below for the first period of the 13-period growing season evaluated in South Korea, which includes 7–22 April.
Example rule 1:
If the LC is forest, grasslands, pasture, or croplands,
SSG is less than −0.76, and
SPI is less than −0.68,
then VegDRI-SKorea is calculated by the following multivariate regression equation:
VegDRI-SKorea = −0.75 + 0.86 SPI + 0.49 SSG. (3)
If the data associated with a case met the threshold criteria for the two continuous variables (i.e. SSG and SPI) and were represented by one of the four LC classes identified (i.e. forest, grasslands, pasture, and croplands), then the corresponding multivariate linear regression equation was applied to calculate a VegDRI-SKorea value. If two or more rules in the Cubist model apply to the case, then the individual values from each regression equation will be averaged to arrive at the final VegDRI-SKorea value. The value can then be categorized into one of seven drought severity classes, with the class value ranges being defined by the levels of the drought-induced vegetation stress based on a modified version of the self-calibrated PDSI (http://drought.unl.edu) developed by Wells, Goddard, and Hayes (Citation2004) drought severity classification scheme ().
3.3.1. VegDRI-SKorea model implementation
The rule sets from the appropriate Cubist model are then applied to the gridded image input data for the corresponding time period of the model using MapCubist (Rulequest Research Citation2015), which was developed at the USGS EROS Center to produce the series of 250-m resolution VegDRI-SKorea maps. For the SPI and self-calibrated PDSI variables, which were acquired as point-based data from the weather station locations, a 250-m raster grid layer was generated for each period using an IDW interpolation method for the mapping phase. During the implementation of the model to the gridded image data, the values of all the input variables for each pixel are considered when determining which rules apply, and the corresponding linear regression equations associated with the rules are applied to input data values to calculate the VegDRI-SKorea value for each pixel. Thirteen VegDRI-SKorea maps from April to October (the growing season) during the 2001, 2008, and 2012 drought events were produced.
4. Results and discussion
4.1. Statistical analysis of VegDRI-SKorea model evaluation
A cross-validation technique was used to assess quantitatively the statistical accuracy of the VegDRI-SKorea models for each period. A holdout year approach was implemented in which the self-calibrated PDSI data for all stations were withheld from the training data. The model generated from the other years of training data was used to estimate the self-calibrated PDSI values for each station for that holdout year. The analysis was completed separately for each 16-day period. This analysis was conducted to determine how well the VegDRI-SKorea model was able to reproduce the self-calibrated PDSI drought severity classification (i.e. the dependent variable).
A summary of the r across the 13 growing periods is presented in . The r for each period represents the mean r between the self-calibrated PDSI and VegDRI-SKorea values across the 13-year period for all station locations. The results showed that the VegDRI-SKorea models had an intermediate to high level of model accuracy across the growing season, with r ranging from 0.66 to 0.76. The model accuracy gradually increased as the growing season progressed, with r of 0.66 and 0.67 for the April periods to 0.72 and 0.76 for the September periods. These results are consistent with earlier VegDRI research in the USA, which reported slightly lower r early in the growing season. This is when the NDVI response can be highly variable because vegetation greenness can vary considerably depending on the timing of the start of the growing season as well as the early season drought conditions that may include excessive cold/hot or wet/dry conditions (Tadesse, Brown, and Hayes Citation2005; Brown et al. Citation2008; Wardlow et al. Citation2012).
4.2. An investigation of drought monitoring capabilities: a comparison of the 2001 drought year and the 2003 wet year
According to the KMA and KRC, most of South Korea, except for the southwest region, experienced severe and extreme drought conditions starting in 2000 and extending into 2001. This was one of the worst droughts in the past 90 years of climate observations (KMA Citation2012). The precipitation records for several weather stations from March to June 2001 showed less than 20% of mean historical rainfall (1981–2010). During the peak of the growing season (August to September) in 2001, long-term drought conditions had a widespread impact over more than 190 km2 of the country’s farmland (MOLIT Citation2002). Therefore, the 2001 drought year was selected to investigate the capabilities of VegDRI-SKorea and evaluate the performance of this new index using a retrospective analysis of the vegetation conditions during this extreme drought event (). For contrast purposes, the VegDRI-SKorea map results were also evaluated for 2003, which was a wet year for the same periods in the growing season ().
Figure 4. The seasonal time-series VegDRI-SKorea maps in 2001 (drought year). (a) 7–22 April, (b) 23 April–8 May, (c) 9–24 May, (d) 25 May–9 June, (e) 10–25 June, (f) 26 June–11 July, (g) 12–27 July, (h) 28 July–12 August, (i) 13–28 August, (j) 29 August–13 September, (k) 14–29 September, (l) 30 September–15 October, (m) 16–31 October.
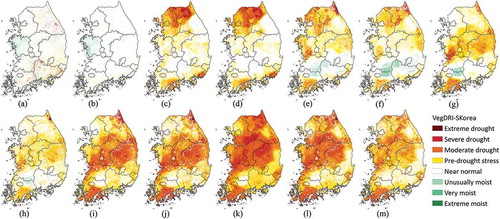
Figure 5. The seasonal time-series VegDRI-SKorea maps in 2003 (wet year). (a) 7–22 April, (b) 23 April–8 May, (c) 9–24 May, (d) 25 May–9 June, (e) 10–25 June, (f) 26 June–11 July, (g) 12–27 July, (h) 28 July–12 August, (i) 13–28 August, (j) 29 August–13 September, (k) 14–29 September, (l) 30 September–15 October, (m) 16–31 October.
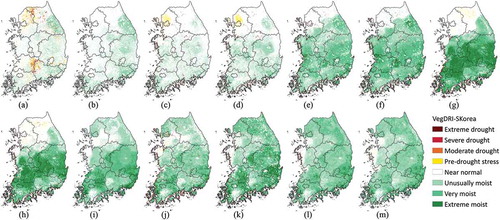
Because this study is focused mainly on the vegetation condition assessment, the VegDRI-SKorea models were developed and applied for the time periods corresponding to the primary paddy/rice growing season from April to October in 2001. shows the seasonal time series of the VegDRI-SKorea maps for the 2001 drought year. These maps show the progression of drought conditions across the growing season, with extreme drought conditions detected by VegDRI-SKorea over much of the country by August and September. shows the statistical summary of the areal coverage of the drought for eight provinces in South Korea based on the VegDRI-SKorea drought classification. shows the observed precipitation records in the 2001 drought year and 2003 wet year for the 3-month period from March to May for the northwest, northeast, and central regions where drought occurred compared to the historical records from 1981 to 2010. The columns for the eight stations show the precipitation summary, including the 3-month total precipitation, the historical normal precipitation for the same period, and the ratio of the total precipitation between the 2001 drought year and 2003 wet year and the normal precipitation.
Table 5. Temporal changes in drought area ratios of total area in each district where the threshold level is less than moderate drought (e.g. moderate, severe, and extreme drought) as determined by the VegDRI-SKorea values for the eight provinces in South Korea during the 2001 drought year.
Table 6. Summary of 3-month total precipitation from March to May in 2001 (drought year) and 2003 (wet year) for the northwest, northeast, and central regions in South Korea.
In 2001, the conditions were drier than normal across the northern regions in May, as shown by the extensive pre-drought stress and moderate drought coverage in the VegDRI-SKorea (,)). Over these regions, the long-term precipitation for March, April, and May was only 38.5, 41.8, and 46.9 mm, respectively, which was 19%, 20%, and 22% of the mean historical rainfall record (). Specifically, the VegDRI-SKorea map in the northeast regions shows 38.9% of the area in the moderate to extreme drought categories by the 9–24 May period. In the central regions, the VegDRI-SKorea map shows only 3.0–4.5% of the areas classified as moderate to extreme drought conditions in May (). The precipitation from March to May over these regions in 2001 was 28–32% of the mean normal rainfall record (). However, the drought rapidly intensified from drier-than-normal conditions as the next 2-month precipitation from June to July was below 60% of the mean normal rainfall record (KMA Citation2002). The VegDRI-SKorea maps showed 17.5% and 22.8% of the central regions in moderate to extreme drought by July (). The spatial extent of the moderate to extreme drought conditions continued to expand across the central regions, covering 70.9% of the area by August and 98.5% by late September (). In the adjacent central regions, a similar pattern was found, with the spatial extent of extreme drought increasing to 47.2% in August and 81.6% in September (). This significant precipitation deficit in 2001 across these regions is reflected in the VegDRI-SKorea maps. In comparison, other regions of South Korea had smaller total areas exhibiting these high levels of drought severity (). From July to September (2001), the area of moderate to extreme drought in the southwest regions ranged from 10.0% to 56.9% (North Jeolla) and from 21.9% to 59.5% (South Jeolla). The moderate to extreme drought conditions in the southeast regions ranged from 22.1% to 62.1% (North Gyeongsang). Over these regions, the long-term precipitation in August and September was 262.5 mm (southwest) and 242.4 mm (southeast). In contrast, these totals compare to 98.2 mm (central) and 113.9 mm (central) (KMA Citation2002). Because of the precipitation differences between these regions, the VegDRI-SKorea maps showed different drought conditions. As a result, the VegDRI-SKorea maps demonstrated the ability to characterize spatial variations in drought conditions across the country corresponding with observed precipitation data.
The precipitation from widespread rainfall events ranged from 41.5 to 273.4 mm (average 86.4 mm) over South Korea from 30 September to 10 October 2001 (KMA Citation2002), bringing improvement to the drought conditions across the region. However, the extended drought conditions had already caused irreversible plant stress by this point in the growing season, resulting in only slight improvements in the drought conditions on the VegDRI-SKorea maps in October as the rains returned. Therefore, because of the record long-term rainfall deficit throughout the summer, the VegDRI-SKorea maps still showed that about 40% of the area in the central and southwest regions was still in moderate to extreme drought.
shows the seasonal time series of VegDRI-SKorea maps during the 2003 wet year. The annual total precipitation in 2003 was 1522 mm over South Korea compared to 1017 mm in the 2001 drought year (KMA Citation2012). The pre-drought stress during the spring season from April and May occurred in the northwest regions in 2003. Over these regions, the long-term precipitation from January to April was only 208.6 mm, which was 56% of the mean normal rainfall record compared to other regions (KMA Citation2004). Specifically, the VegDRI-SKorea map in the northwest regions shows 23.4% of the area in the pre-drought stress category by the 9–24 May period. In the western regions, the precipitation from widespread rainfall events ranged from 183.4 mm in June to 424.4 mm in July (KMA Citation2004), bringing wet conditions over these regions. In addition, very moist and extreme moist conditions during the summer season for July and August occurred in most of the southwest region. The spatial extent of the moist conditions continued to expand across the west and southwest regions during this year.
4.3. Regional drought monitoring capabilities: a comparison of the VegDRI-SKorea and self-calibrated PDSI for the 2001 drought year
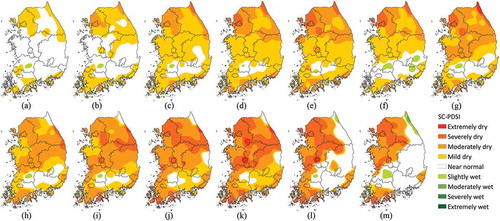
A regional-scale comparison of the VegDRI-SKorea and self-calibrated PDSI maps for the 2001 drought year is provided to illustrate the drought monitoring capabilities of the VegDRI-SKorea. shows the self-calibrated PDSI maps over the study area for the 2001 drought year. A seasonal time series of the self-calibrated PDSI maps () and the VegDRI-SKorea maps () shows that the general spatial patterns and intensity of drought depicted in the two maps were similar. However, several local-scale differences in the drought patterns characterized in the 250-m VegDRI-SKorea maps and self-calibrated PDSI maps illustrate some of the inherent differences between these two indicators. The first example occurs in the northwest and northeast regions during May to June 2001. The self-calibrated PDSI map shows generally mild and moderately dry conditions across these areas, while the VegDRI-SKorea map has classified moderate, severe, and extreme drought conditions for the same locations. In the northwest and northeast regions, the total amount of precipitation during these periods averaged 59.7 mm, which was 23% of the mean historical rainfall record (KMA Citation2002). According to the historical drought records obtained by the KRC, the investigations of the historical drought conditions confirmed that extreme drought occurred mainly in the northern regions of South Korea during these periods in 2001. The northern regions during June to July that year represent a second example, where the VegDRI-SKorea map depicted a more timely response showing an improvement in the drought conditions compared to the self-calibrated PDSI map. After a major rainfall event totaling more than 150 mm rainfall (MOLIT Citation2002) occurred from 10 June 2001 to the end of the month over much of South Korea, the VegDRI-SKorea map showed significant improvement in drought conditions, as shown in ). However, the self-calibrated PDSI map did not show recovery from the mild and moderately dry conditions during these periods. The PDSI may delay or lag in the detection of or recovery from drought over several months since the data depend on soil moisture and its properties, which have been simplified to one value in each climate division (Hayes, Alvord, and Lowrey Citation2007). As a result, these specific examples show how the improved 250-m spatial resolution of the VegDRI-SKorea would be valuable for local-scale drought monitoring and be used as a complementary tool to provide more timely detection of improvement in drought conditions compared to the station-based self-calibrated PDSI.
Figure 6. The seasonal time-series self-calibrated PDSI maps in 2001 (drought year). (a) 7–22 April, (b) 23 April–8 May, (c) 9–24 May, (d) 25 May–9 June, (e) 10–25 June, (f) 26 June–11 July, (g) 12–27 July, (h) 28 July–12 August, (i) 13–28 August, (j) 29 August–13 September, (k) 14–29 September, (l) 30 September–15 October, (m) 16–31 October.
4.4. Investigations of drought-related vegetation stress in 2008 and 2012 drought years
The autumn of 2008 and the spring of 2012 marked two additional severe to extreme drought events in South Korea, with part of the country experiencing its driest year in the modern climatic data record during one of these two years. These two additional drought years were selected to investigate the VegDRI-SKorea capabilities for different types of regional drought events and severity patterns. and show the statistical summary of the spatial coverage of drought at the provincial level for eight provinces in South Korea based on the VegDRI-SKorea drought classification for the 2008 autumn drought and 2012 spring drought events, respectively. Each period in and was selected to investigate the capabilities of VegDRI-SKorea and evaluate the performance using a retrospective analysis of the vegetation conditions when severe and extreme drought occurred.
Table 7. Temporal changes in drought area ratios of total area in each district where the threshold level is less than moderate drought (e.g. moderate, severe, and extreme drought) as determined by the VegDRI-SKorea values for the eight provinces in South Korea during the 2008 autumn drought.
Table 8. Temporal changes in drought area ratios of total area in each district where the threshold level is less than moderate drought (e.g. moderate, severe, and extreme drought) as determined by the VegDRI-SKorea values for the eight provinces in South Korea during the 2012 spring drought.
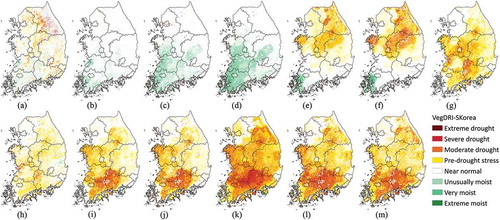
shows the seasonal time series of the VegDRI-SKorea for the 2008 drought year. shows the observed monthly precipitation records from the 2008 and 2012 drought years from April to October for the north and south regions. In 2008, conditions were wetter than normal across the southwest regions in May, as shown by unusually and very moist conditions in the VegDRI-SKorea (,)). Over these regions, the total precipitation in May was 156 and 158 mm, which was 1.7 times more than other regions. However, the total precipitation amounts from July to October averaged 293 and 305 mm (southwest) and 185 and 310 mm (southeast), which was 33% and 27% compared to the north regions, respectively (). The VegDRI-SKorea maps depicted unusually dry conditions, with 27.8% (central), 31.3% (southwest), and 46.6% (southeast) of the southern region under moderate to extreme drought from 29 August to 13 September (). This drought event reached its peak areal extent in September, and it continued in October. Specifically, the VegDRI-SKorea maps reflected these drought conditions with moderate to extreme drought conditions increasing to 74.1% in the southwest region and 78.9% in the southeast region by 14–29 September (). Even though these regions showed some improvement during late October, the VegDRI-SKorea maps still showed significant drought areas in these regions (60.5% in the southwest and 62.7% in the southeast) because the vegetation had not yet recovered from the severe stress of the long-term precipitation deficit (e.g. 34% of mean historical rainfall record) over these areas. As a result, the VegDRI-SKorea maps across the southern regions showed a transition from moist conditions in May to emerging drought conditions by July to severe to extreme conditions by September, reflecting the changing patterns of precipitation.
Table 9. Summary of monthly total and per cent of normal precipitation from April to October in 2008 and 2012 (drought years) for the north and south regions in South Korea.
Figure 7. The seasonal time-series VegDRI-SKorea maps in 2008 (drought year). (a) 7–22 April, (b) 23 April–8 May, (c) 9–24 May, (d) 25 May–9 June, (e) 10–25 June, (f) 26 June–11 July, (g) 12–27 July, (h) 28 July–12 August, (i) 13–28 August, (j) 29 August–13 September, (k) 14–29 September, (l) 30 September–15 October, (m) 16–31 October.
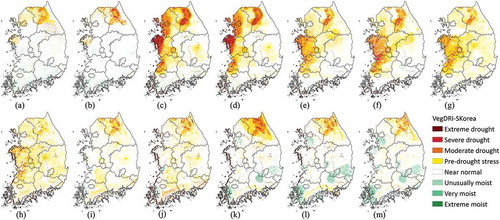
shows the seasonal time series of the VegDRI-SKorea for the 2012 spring drought year. The VegDRI-SKorea map shows the severe and extreme drought conditions detected over the northwest and central regions during the spring season. Over these regions, the long-term precipitation value in May 2012 was 32% of the mean historical rainfall record over South Korea, with the greatest deficits in the northwest (17% of mean historical rainfall) and central (14% of mean historical rainfall) regions (). Severe to extreme drought conditions rapidly developed across the northwest, northeast, and central regions in April and May, with the maximum areal extent of these conditions detected in the 9–24 May 2012 period. At that time, the northwest had 33.7% of its areas classified as being under severe to extreme drought, while the northeast and central regions had 23.5% and 48.0% of their areas, respectively, in those drought severity categories (). The precipitation from widespread rainfall events averaged 27.0 mm over the northwest and northeast regions from 28 May to 8 June 2012 (KMA Citation2013), bringing improvement to the drought conditions. The VegDRI-SKorea maps showed some improvement in June as the classified drought area decreased to 6.5% and 10.6% in these regions, respectively (). However, because the 2-month precipitation amount from May to June over these regions averaged 34.2 mm (KMA Citation2013), the maps still showed a significant drought area of 38.3% in the central region, as the vegetation had not recovered from the severe stress from earlier in the spring until late June and early July ().
Figure 8. The seasonal time-series VegDRI-SKorea maps in 2012 (drought year). (a) 7–22 April, (b) 23 April–8 May, (c) 9–24 May, (d) 25 May–9 June, (e) 10–25 June, (f) 26 June–11 July, (g) 12–27 July, (h) 28 July–12 August, (i) 13–28 August, (j) 29 August–13 September, (k) 14–29 September, (l) 30 September–15 October, (m) 16–31 October.
5. Conclusions
The VegDRI approach, which was initially developed by the NDMC and USGS EROS, has the flexibility to be adapted for other regions of the world using the climate, satellite, and biophysical data sets that are available for those regions. This was demonstrated in this study, where a new VegDRI-SKorea model was developed for South Korea to monitor agricultural drought conditions. Using 13 years (2001–2013) of historical satellite, climate, and biophysical data sets available for the country, the VegDRI-SKorea model results showed that this index maintained a high level of model accuracy when compared with the self-calibrated PDSI across both the growing season and diverse environmental conditions.
Case studies for the 2001, 2008, and 2012 historical drought events over South Korea illustrated the ability of VegDRI-SKorea to characterize local-scale variations in drought conditions across the growing season. The results of this study confirmed that the temporal and spatial patterns of the 2001, 2008, and 2012 drought events depicted by the VegDRI-SKorea show the severity of the drought on vegetation. The significant precipitation deficit in 2001, which caused one of the worst droughts in the past 90 years of climate observations, was reflected in the VegDRI-SKorea maps, with the spatial extent of moderate to extreme drought conditions expanding to more than 70% of the area in the central region by late September. Specifically, the VegDRI-SKorea maps for the 2008 autumn drought events showed the transition from moist conditions in May to emerging drought conditions by July to severe to extreme conditions by September, as was reflected in the changing patterns of precipitation.
In addition, the results demonstrated that the more spatially detailed drought patterns that are depicted at a 250-m resolution in the VegDRI-SKorea maps can help in improving the characterization of the vegetation conditions as compared to the commonly used satellite-based drought index (e.g. NDVI) and station-based drought index (e.g. self-calibrated PDSI). The VegDRI-SKorea maps showed generally moderate, severe, and extreme drought conditions for the northern regions during May to June 2001, while the self-calibrated PDSI maps had classified mild and moderately dry conditions across these areas. As a result, the VegDRI-SKorea would be valuable for local-scale drought monitoring to depict and provide a more timely indication of the improvement of drought conditions than the station-based drought indices.
The VegDRI-SKorea tool can be used for drought monitoring by agricultural producers, decision-makers relying on early warning information, policymakers, and other stakeholders to improve management decisions. A strength of the VegDRI approach is its flexibility to be customized to the specific variables of a given location and its ability to integrate new data inputs and variable types, as they become available (Brown et al. Citation2008; Wardlow et al. Citation2012; Tadesse et al. Citation2014). This study demonstrates that the VegDRI process explained by Brown et al. (Citation2008) can be applied successfully in other regions around the world, such as South Korea. Finally, further research and development of the VegDRI-SKorea will expand the study coverage area to all of Korea, including North Korea, for drought and vegetation condition monitoring.
Acknowledgements
This research was supported by the Rural Development Administration (RDA) through Cooperative Research Program for Agriculture Science & Technology Development, funded by Ministry of Agriculture, Food and Rural Affairs (MAFRA) (PJ012569022017). This research was also supported by Korea Institute of Planning and Evaluation for Technology in Food, Agriculture, Forestry and Fisheries (IPET) through Advanced Production Technology Development Program, funded by MAFRA (116117-03-1-SB020). The authors are also grateful for the financial support provided by the National Aeronautics and Space Administration (NASA) grant number NNX14AD30G. The views expressed in this study are those of the authors and do not necessarily reflect the views of RDA, IPET, MAFRA, NASA, or any of its subagencies. The authors would also like to thank Deborah Wood (National Drought Mitigation Center, NDMC) for her editing expertise and Karin Callahan (NDMC), Chris Poulsen (NDMC), Yared A. Bayissa (UNESCO-IHE Institute for Water Education), and Suk-Young Hong (National Academy of Agricultural Science, Rural Development Administration) for technical assistance and data support during the early stages of the research. Finally, the authors would like to thank the editor, and anonymous reviewers who took the time to review and provide guidance on this article.
Disclosure statement
No potential conflict of interest was reported by the authors.
Additional information
Funding
References
- Agam, N., W. P. Kustas, M. C. Anderson, F. Li, and C. M. U. Neale. 2007. “A Vegetation Index Based Technique for Spatial Sharpening of Thermal Imagery.” Remote Sensing of Environment 107: 545−558. doi:10.1016/j.rse.2006.10.006.
- AghaKouchak, A., A. Farahmand, F. S. Melton, J. Teixeira, M. C. Anderson, B. D. Wardlow, and C. R. Hain. 2015. “Remote Sensing of Drought: Progress, Challenges and Opportunities.” Reviews of Geophysics 53: 452−480.
- Anderson, M. C., C. Hain, J. Otkin, X. Zhan, K. Mo, M. Svoboda, B. Wardlow, and A. Pimstein. 2013. “An Intercomparison of Drought Indicators Based on Thermal Remote Sensing and NLDAS-2 Simulation with U.S. Drought Monitor Classifications.” Journal of Hydrometeorology 14: 1035−1056. doi:10.1175/JHM-D-12-0140.1.
- Anderson, M. C., C. Hain, B. Wardlow, A. Pimstein, J. R. Mecikalski, and W. P. Kustas. 2011. “Evaluation of Drought Indices Based on Thermal Remote Sensing of Evapotranspiration over the Continental United States.” Journal of Climate 24: 2025−2044. doi:10.1175/2010JCLI3812.1.
- Bokusheva, R., F. Kogan, I. Vitkovskaya, S. Conradt, and M. Batyrbayeva. 2016. “Satellite-Based Vegetation Health Indices as a Criteria for Insuring against Drought-Related Yield Losses.” Agricultural and Forest Meteorology 220: 200−206. doi:10.1016/j.agrformet.2015.12.066.
- Boyte, S. P., B. K. Wylie, D. J. Major, and J. F. Brown. 2015. “The Integration of Geophysical and Enhanced Moderate Resolution Imaging Spectroradiometer Normalized Difference Vegetation Index Data into a Rule-Based, Piecewise Regression-Tree Model to Estimate Cheatgrass Beginning of Spring Growth.” International Journal of Digital Earth 8 (2): 118−132. doi:10.1080/17538947.2013.860196.
- Breiman, L., J. H. Friedman, R. A. Olshen, and C. I. Stone. 1984. Classification and Regression Trees. Belmont, CA: Wadsworth International Group.
- Brown, J. F., B. D. Wardlow, T. Tadesse, M. J. Hayes, and B. C. Reed. 2008. “The Vegetation Drought Response Index (Vegdri): A New Integrated Approach for Monitoring Drought Stress in Vegetation.” GIScience & Remote Sensing 45: 16−46. doi:10.2747/1548-1603.45.1.16.
- Dilley, M., R. S. Chen, U. Deichmann, A. L. Lerner-Lam, and M. Arnold. 2005. Natural Disaster Hotspots: A Global Risk Analysis. Washington, DC: World Bank. https://openknowledge.worldbank.org/handle/10986/7376 License: CC BY 3.0 IGO.
- Edwards, D. C., and T. B. McKee. 1997. “Characteristics of 20th Century Drought in the United States at Multiple Time Scales.” Climatology Report Number 97−2, Fort Collins, CO: Colorado State University.
- Ghulam, A., Q. Qin, T. Teyip, and Z. L. Li. 2007. “Modified Perpendicular Drought Index (MPDI): A Real-Time Drought Monitoring Method.” ISPRS Journal of Photogrammetry & Remote Sensing 62: 150−164. doi:10.1016/j.isprsjprs.2007.03.002.
- Gibbs, W. M., and J. V. Maher. 1967. “Rainfall Deciles as Drought Indicators.” Australia. Bureau of Meteorology, Bulletin no. 48. Melbourne, Commonwealth Bureau of Meteorology.
- Gu, Y., J. F. Brown, J. P. Verdin, and B. Wardlow. 2007. “A Five-Year Analysis of MODIS NDVI and NDWI for Grassland Drought Assessment over the Central Grate Plains of the United States.” Geophysical Research Letters 34: L06407. doi:10.1029/2006GL029127.
- Gu, Y., E. Hunt, B. Wardlow, J. B. Basara, J. F. Brown, and J. P. Verdin. 2008. “Evaluation of MODIS NDVI and NDWI for Vegetation Drought Monitoring Using Oklahoma Mesonet Soil Moisture Data.” Geophysical Research Letters 35: L22401. doi:10.1029/2008GL035772.
- Hao, C., J. Zhang, and F. Yao. 2015. “Combination of Multi-Sensor Remote Sensing Data for Drought Monitoring over Southwest China.” International Journal of Applied Earth Observation and Geoinformation 35: 270−283. doi:10.1016/j.jag.2014.09.011.
- Hayes, M., M. Svoboda, N. Wall, and M. Widhalm. 2011. “The Lincoln Declaration on Drought Indices: Universal Meteorological Drought Index Recommended.” Bulletin of the American Meteorological Society 92: 485−488. doi:10.1175/2010BAMS3103.1.
- Hayes, M. J., C. Alvord, and J. Lowrey. 2007. “Drought Indices.” Feature Article from Intermountain West Climate Summary 3: 2−6.
- Hayes, M. J., M. D. Svoboda, D. A. Wilhite, and O. V. Vanyarkho. 1999. “Monitoring the 1996 Drought Using the Standardized Precipitation Index.” Bulletin of the American Meteorological Society 80: 429−438. doi:10.1175/1520-0477(1999)080<0429:MTDUTS>2.0.CO;2.
- Hayes, M. J., O. Wilhelmi, and C. Knutson. 2004. “Reducing Drought Risk: Bridging Theory and Practice.” Natural Hazards Review 5: 106−113. doi:10.1061/(ASCE)1527-6988(2004)5:2(106).
- Heim, R. R. 2002. “A Review of Twentieth-Century Drought Indices Used in the United States.” Bulletin of the American Meteorological Society 83: 1149−1165.
- Hong, E. M., W. H. Nam, J. Y. Choi, and Y. A. Pachepsky. 2016. “Projected Irrigation Requirements for Upland Crops Using Soil Moisture Model under Climate Change in South Korea.” Agricultural Water Management 165: 163−180. doi:10.1016/j.agwat.2015.12.003.
- Jarvis, A., H. I. Reuter, A. Nelson, and E. Guevara. 2008. “Hole-Filled SRTM for the Globe Version 4.” The CGIAR-CSI SRTM 90m Database. http://srtm.csi.cgiar.org.
- Karnieli, A., N. Agam, R. T. Pinker, M. Anderson, M. L. Imhoff, G. G. Gutman, and N. Panov. 2010. “Use of NDVI and Land Surface Temperature for Drought Assessment: Merits and Limitations.” Journal of Climate 23: 618−633. doi:10.1175/2009JCLI2900.1.
- Kim, D. W., H. R. Byun, K. S. Choi, and S. B. Oh. 2011. “A Spatiotemporal Analysis of Historical Droughts in Korea.” Journal of Applied Meteorology and Climatology 50: 1895−1912. doi:10.1175/2011JAMC2664.1.
- Kogan, F. 2002. “World Droughts in the New Millennium from AVHRR-based Vegetation Health Indices.” Eos, Transactions American Geophysical Union 83 (48): 557−563. doi:10.1029/2002EO000382.
- Kogan, F. N. 2001. “Operational Space Technology for Global Vegetation Assessment.” Bulletin of the American Meteorological Society 82: 1949−1964. doi:10.1175/1520-0477(2001)082<1949:OSTFGV>2.3.CO;2.
- KMA (Korea Meteorological Administration). 2002. “Annual Climatological Report 2001.” Korea Meteorological Administration, Seoul: South Korea (in Korean).
- KMA (Korea Meteorological Administration). 2004. “Annual Climatological Report 2003.” Korea Meteorological Administration, Seoul: South Korea (in Korean).
- KMA (Korea Meteorological Administration). 2012. “The Climate Atlas of Korea.” Meteorological Resources Division, Korea Meteorological Administration, Seoul: South Korea (in Korean).
- KMA (Korea Meteorological Administration). 2013. “Annual Climatological Report 2012.” Korea Meteorological Administration, Seoul: South Korea (in Korean).
- Lee, B. R., S. B. Oh, and H. R. Byun. 2015. “The Characteristics of Drought Occurrence in North Korea and Its Comparison with Drought in South Korea.” Theoretical and Applied Climatology 121: 199−209. doi:10.1007/s00704-014-1230-z.
- Liu, W. T., and F. N. Kogan. 1996. “Monitoring Regional Drought Using the Vegetation Condition Index.” International Journal of Remote Sensing 17 (14): 2761−2782. doi:10.1080/01431169608949106.
- Martinez-Fernandez, J., A. Gonzalez-Zamora, N. Sanchez, A. Gumuzzio, and C. M. Herrero-Jimenez. 2016. “Satellite Soil Moisture for Agricultural Drought Monitoring: Assessment of the SMOS Derived Soil Water Deficit Index.” Remote Sensing of Environment 177: 277−286. doi:10.1016/j.rse.2016.02.064.
- McKee, T. B., N. J. Doesken, and J. Kleist. 1993. “The Relationship of Drought Frequency and Duration to Time Scale.” In Preprints, 8th Conference on Applied Climatology, Anaheim, CA: American Meteorological Society, 179−184.
- MOLIT (Ministry of Land, Infrastructure, and Transport). 2002. “Drought Record Report 2001.” Ministry of Land, Infrastructure, and Transport, Sejong: South Korea (in Korean).
- Mokhtari, M. H., R. Adnan, and I. Busu. 2013. “A New Approach for Developing Comprehensive Agricultural Drought Index Using Satellite-Derived Biophysical Parameters and Factor Analysis Method.” Natural Hazards 65: 1249−1274.
- Mu, Q., M. Zhao, J. S. Kimball, N. G. McDowell, and S. W. Running. 2013. “A Remotely Sensed Global Terrestrial Drought Severity Index.” Bulletin of the American Meteorological Society 94: 83−98. doi:10.1175/BAMS-D-11-00213.1.
- Nam, W. H., J. Y. Choi, S. H. Yoo, and B. A. Engel. 2012a. “A Real-Time Online Drought Broadcast System for Monitoring Soil Moisture Index.” KSCE Journal of Civil Engineering 16 (3): 357−365. doi:10.1007/s12205-012-1357-3.
- Nam, W. H., J. Y. Choi, S. H. Yoo, and M. W. Jang. 2012b. “A Decision Support System for Agricultural Drought Management Using Risk Assessment.” Paddy Water Environment 10 (3): 197−207. doi:10.1007/s10333-012-0329-z.
- Nam, W. H., M. J. Hayes, M. D. Svoboda, T. Tadesse, and D. A. Wilhite. 2015b. “Drought Hazard Assessment in the Context of Climate Change for South Korea.” Agricultural Water Management 160: 106−117. doi:10.1016/j.agwat.2015.06.029.
- Nam, W. H., E. M. Hong, and J. Y. Choi. 2015a. “Has Climate Change Already Affected the Spatial Distribution and Temporal Trends of Reference Evapotranspiration in South Korea?” Agricultural Water Management 150: 129−138. doi:10.1016/j.agwat.2014.11.019.
- Olson, D. M., and E. Dinerstein. 2002. “The Global 200: Priority Ecoregions for Global Conservation.” Annals of the Missouri Botanical Garden 89 (2): 199−224. doi:10.2307/3298564.
- Otkin, J. A., M. C. Anderson, C. Hain, and M. Svoboda. 2014. “Examining the Relationship between Drought Development and Rapid Changes in the Evaporative Stress Index.”.” Journal of Hydrometeorology 15: 938−956. doi:10.1175/JHM-D-13-0110.1.
- Palmer, W. C. 1965. “Meteorological Drought.” In Research Paper 45. Washington, DC: U.S. Department of Commerce.
- Pervez, M., S. M. Budde, and J. Rowland. 2014. “Mapping Irrigated Areas in Afghanistan over the past Decade Using MODIS NDVI.” Remote Sensing of Environment 149: 155−165.
- Peters, A. J., E. A. Walter-Shea, L. Ji, A. Vina, M. Hayes, and M. D. Svoboda. 2002. “Drought Monitoring with NDVI-based Standardized Vegetation Index.” Photogrammetric Engineering & Remote Sensing 68 (1): 71−75.
- Philippon, N., L. Jarlan, N. Martiny, P. Camberlin, and E. Mougin. 2007. “Characterization of the Interannual and Intraseasonal Variability of West African Vegetation between 1982 and 2002 by Means of NOAA AVHRR NDVI Data.” Journal of Climate 20: 1202−1218. doi:10.1175/JCLI4067.1.
- Rojas, O., A. Vrieling, and F. Rembold. 2011. “Assessing Drought Probability for Agricultural Areas in Africa with Coarse Resolution Remote Sensing Imagery.” Remote Sensing of Environment 115: 343−352. doi:10.1016/j.rse.2010.09.006.
- Rural Development Administration (RDA). 2011. “Preprocess Program for MODIS Satellite Images.” Program Registration No. 2011-01-189-012198 (2011.12.28), Rural Development Administration, Suwon: South Korea (in Korean).
- Rulequest Research. 2015. Data Mining with Cubist. http://www.rulequest.com/cubist-info.html.
- Svoboda, M., D. LeComte, M. Hayes, R. Heim, K. Gleason, J. Angel, B. Rippey, et al. 2002. “The Drought Monitor.” Bulletin of the American Meteorological Society 83: 1181−1190.
- Svoboda, M. D., B. A. Fuchs, C. C. Poulsen, and J. R. Nothwehr. 2015. “The Drought Risk Atlas: Enhancing Decision Support for Drought Risk Management in the United States.” Journal of Hydrology 526: 274−286. doi:10.1016/j.jhydrol.2015.01.006.
- Tadesse, T., J. F. Brown, and M. J. Hayes. 2005. “A New Approach for Prediction Drought-Related Vegetation Stress: Integrating Satellite, Climate, and Biophysical Data over the U.S. Central Plains.” ISPRS Journal of Photogrammetry & Remote Sensing 59: 244−253. doi:10.1016/j.isprsjprs.2005.02.003.
- Tadesse, T., B. G. Demisse, B. Zaitchik, and T. Dinku. 2014. “Satellite-Based Hybrid Drought Monitoring Tool for Prediction of Vegetation Condition in Eastern Africa: A Case Study for Ethiopia.” Water Resources Research 50: 2176−2190. doi:10.1002/2013WR014281.
- Tadesse, T., G. B. Senay, G. Berhan, T. Regassa, and S. Beyene. 2015b. “Evaluating A Satellite-Based Seasonal Evapotranspiration Product and Identifying Its Relationship with Other Satellite-Derived Products and Crop Yield: A Case Study for Ethiopia.” International Journal of Applied Earth Observation and Geoinformation 40: 39−54. doi:10.1016/j.jag.2015.03.006.
- Tadesse, T., B. Wardlow, J. Brown, M. Svoboda, M. Hayes, B. Fuchs, and D. Gutzmer. 2015a. “Assessing the Vegetation Condition Impacts of the 2011 Drought across the U.S. Southern Great Plains Using the Vegetation Drought Response Index (VegDRI).” Journal of Applied Meteorology and Climatology 54: 153−169. doi:10.1175/JAMC-D-14-0048.1.
- Tadesse, T., B. D. Wardlow, M. J. Hayes, M. D. Svoboda, and J. F. Brown. 2010. “The Vegetation Outlook (VegOut): A New Method for Predicting Vegetation Seasonal Greenness.” GIScience & Remote Sensing 47: 25−52. doi:10.2747/1548-1603.47.1.25.
- Tadesse, T., D. A. Wilhite, S. K. Harms, M. J. Hayes, and S. Goddard. 2004. “Drought Monitoring Using Data Mining Techniques: A Case Study for Nebraska, USA.” Natural Hazards 33: 137−159. doi:10.1023/B:NHAZ.0000035020.76733.0b.
- Trnka, M., M. Dubrovsky, M. Svoboda, D. Semeradova, M. Hayes, Z. Zalud, and D. Wilhite. 2009. “Developing a Regional Drought Climatology for the Czech Republic.”.” International Journal of Climatology 29: 863−883. doi:10.1002/joc.1745.
- Vicente-Serrano, S. M., S. Begueria, and J. I. Lopez-Moreno. 2010. ““A Multiscalar Drought Index Sensitive to Global Warming: The Standardized Precipitation Evapotranspiration Index.” Journal of Climate 23: 1696−1718. doi:10.1175/2009JCLI2909.1.
- Vicente-Serrano, S. M., D. Cabello, M. Tomas-Burguera, N. Martin-Hernandez, S. Begueria, C. Azaorin-Molina, and A. E. Kenawy. 2015. “Drought Variability and Land Degradation in Semiarid Regions: Assessment Using Remote Sensing Data and Drought Indices (1982-2011).” Remote Sensing 7: 4391−4423. doi:10.3390/rs70404391.
- Wang, J., Z. Ling, Y. Wang, and H. Zeng. 2016. “Improving Spatial Representation of Soil Moisture by Integration of Microwave Observations and the Temperature-Vegetation-Drought Index Derived from MODIS Products.” ISPRS Journal of Photogrammetry & Remote Sensing 113: 144−154. doi:10.1016/j.isprsjprs.2016.01.009.
- Wardlow, B. D., S. L. Egbert, and J. H. Kastens. 2007. “Analysis of Time-Series MODIS 250 M Vegetation Index Data for Crop Classification in the U.S. Central Great Plains.” Remote Sensing of Environment 108: 290−310. doi:10.1016/j.rse.2006.11.021.
- Wardlow, B. D., T. Tadesse, J. F. Brown, K. Callahan, S. Swain, and E. Hunt. 2012. “The Vegetation Drought Response Index (Vegdri): An Integration of Satellite, Bioclimate, and Biophysical Data.” In Remote Sensing and Drought: Innovative Approaches to Monitoring, edited by B. D. Wardlow, M. C. Anderson, and J. Verdin, 51−74, Boca Raton: CRC Press. http://digitalcommons.unl.edu/droughtfacpub
- Wells, N., S. Goddard, and M. J. Hayes. 2004. “A Self-Calibrating Palmer Drought Severity Index.” Journal of Climate 17: 2335−2351. doi:10.1175/1520-0442(2004)017<2335:ASPDSI>2.0.CO;2.
- Wilhite, D. A. 1997. “Responding to Drought: Common Threads from the Past, Visions for the Future.” Journal of the American Water Resources Association 33: 951−959. doi:10.1111/j.1752-1688.1997.tb04116.x.
- Wilhite, D. A., M. J. Hayes, C. Knutson, and K. H. Smith. 2000. “Planning for Drought: Moving from Crisis to Risk Management.” Journal of the American Water Resources Association 36: 697−710. doi:10.1111/j.1752-1688.2000.tb04299.x.
- Wilhite, D. A., M. V. K. Sivakumar, and R. Pulwarty. 2014. “Managing Drought Risk in a Changing Climate: The Role of National Drought Policy.” Weather and Climate Extremes 3: 4−13. doi:10.1016/j.wace.2014.01.002.
- Wu, D., J. J. Qu, and X. Hao. 2015. “Agricultural Drought Monitoring Using MODIS-based Drought Indices over the USA Corn Belt.” International Journal of Remote Sensing 36 (21): 5403−5425. doi:10.1080/01431161.2015.1093190.
- Yan, H., S. Q. Wang, H. Q. Lu, Q. Yu, Z. C. Zhu, R. B. Myneni, Q. Liu, and H. H. Shugart. 2014. “Development of a Remotely Sensing Seasonal Vegetation-Based Palmer Drought Severity Index and Its Application of Global Drought Monitoring over 1982-2011.” Journal of Geophysical Research: Atmospheres 119: 9419−9440.
- Yang, Y., S. Shang, and L. Jiang. 2012. “Remote Sensing Temporal and Spatial Patterns of Evapotranspiration and the Responses to Water Management in a Large Irrigation District of North China.” Agricultural and Forest Meteorology 164: 112−122. doi:10.1016/j.agrformet.2012.05.011.