
 ?Mathematical formulae have been encoded as MathML and are displayed in this HTML version using MathJax in order to improve their display. Uncheck the box to turn MathJax off. This feature requires Javascript. Click on a formula to zoom.
ABSTRACT
Rural hamlets in the Southeast Sahel, because of their pastoral setting and dependence on local agricultural production, are particularly vulnerable to flash flooding, loss of soil and the inundation of arable land caused by sudden storm events. High resolution satellite precipitation estimates (SPEs) could prove essential for detecting, monitoring, predicting and mitigating the effects of such hydrometeorological extremes. The focus of this report is on assessing – in the context of the needs of the local community − the effectiveness of what has become the gold standard for such applications in Africa and elsewhere since 1998: Tropical Rainfall Monitoring Mission (TRMM) Multisatellite Precipitation Analysis (TMPA) program’s 0.25° × 0.25°, daily 3B42 Version 7 satellite-gauge merged product. The scientific community now has almost 20 years of TMPA data that will likely play a significant role well into the future for retrospective studies in conjunction with the next generation (post-2014) Global Precipitation Mission (GPM) products. To assess the 3B42 product for the purposes of this report, we employ a pixel-to-point comparison of 3B42 daily time series with synchronous gauge data at four well-separated gauge sites. While others have found notable agreement between 3B42 and gauge observations aggregated over large areas and seasonal to annual time periods, it is a different matter downscaling to daily values at local sites, where we find a disturbing number of ‘false alarms’ and ‘missed events’. More than 90% of the total annual rainfall estimated by the 3B42 is contributed by daily events that are misaligned in time or intensity with gauge events. This largely concurs with the findings of our prior reports based on CPC-RFE2 0.1° × 0.1° daily values. Thus, users might be cautious in using the TMPA 3B42, CPC-RFE2 or, by inference, any SPE, as deterministic metrics for detecting and monitoring short term (i.e. ≤ 1 day), extreme storm events in this area of the Sahel.
KEYWORDS:
1. Introduction
Most of the cumulative rainfall delivered to the Southeast Sahel is from the intense, but localized, convective storm activity associated with the seasonal northward migration of the tropical rain belt into the region. Since the most intense downpours from these convective storm systems have lateral scale sizes on the order of a few kilometres or so, a storm system passing through a region may result in two contrasting types of local hydrometeorological extremes: one hamlet may experience flash flooding, while an adjacent hamlet may continue to experience parched, drought conditions. Thus, patterns of local rainfall are essential to water-dependent stakeholders in a community that ranges from herders and farmers to water and natural hazard managers. In a largely agrarian society, most community members have an immediate and vested interest in when has it rained, where has it rained and how much has it rained. Such information is essential at the hamlet level, not only due to the extreme impact of flash floods versus droughts, but also because rainfall patterns are determining factors in selecting the appropriate crop for the expected season, when to till (if one can till due to field conditions), when to plant and when to harvest. A matter of a few weeks’ delay or advance in scheduling directly depends on the timing and amount of local rainfall. In the view of local community members we have interviewed, the local spatial and temporal distribution of rain fields – on a spatial scale much finer than the typical distance between rain gauges in the country – is of significant importance, hence a number of the local population have shown an interest in the potential of satellite rainfall estimates. The question we pose in this report is whether one of the most popular and most accessible high resolution satellite precipitation products (SPPs) proposed for such applications is adequate for the purpose local stakeholders would require.
Our approach will be to employ a pixel-to-point comparison (cf. Habib, Elsaadani, and Haile Citation2012; Thiemig et al. Citation2012; Zulkafli et al. Citation2014) of the respective SPP to surface gauge data at four discrete sites in the Southeast Sahel. Each gauge serves as a proxy for representing the daily rainfall on a field-sized plot or small catchment. Our satellite precipitation estimates (SPEs) will be from the Tropical Rainfall Monitoring Mission (TRMM) Multisatellite Precipitation Analysis (TMPA) 3B42 Version 7 database. Our principal gauge site is the World Meteorological Organization (WMO) gauge ID 62,752 at Gedaref City (GED), Sudan, for the time period 1999−2015. The 17 years of GED gauge data provide the highest quality, longest time series we have been able to assemble for this area. In addition, for independent corroboration of our findings at the principal site, we include similar pixel-to-point analyses of the TMPA 3B42 with gauge data from three cooperative stations in the region for which we have been able to assemble data for the period of 2010–2013.
Of the variety of SPE tools available (c.f. http://www.isac.cnr.it/~ipwg/data/datasets.html), the TMPA 3B42 database is recommended as one of the most convenient, yet robust products to employ for high-resolution studies (Maggioni, Meyers, and Robinson Citation2016; Thiemig et al. Citation2012), particularly since it is readily subsetted into local maps and time series (see, for example, https://giovanni.gsfc.nasa.gov/giovanni/). The TMPA 3B42 product has proven to be effective for addressing a variety of hydrological issues, particularly those associated with predicting, monitoring and mitigating longer term, wider area hydrometeorological hazards (Chiu and Shin Citation2006; Habib, Elsaadani, and Haile Citation2012; Huffman et al. Citation2007; Nicholson Citation2014; Roca et al. Citation2010; Thiemig et al. Citation2012). Prior work by the scientific community has shown broad agreement between annual and monthly time series of TMPA and surface gauge data for East Africa and other regions of the globe, particularly when time samples are aggregated over substantial spatial areas (Cattani, Merino, and Levizzani Citation2016; Hong et al. Citation2007; Li, Zhang, and Xu Citation2012; Nicholson Citation2014; Nicholson et al. Citation2003; Villarini and Krajewski Citation2007). However, at the highest resolution – say, pixel scale – and at sampling intervals of a day, the quality of an SPP, in terms of its ability to represent the timing and intensity of specific storm events, is substantially attenuated because of the relatively high-occurrence frequency and intensity of ‘false alarms’ (significant overestimates) and ‘missed events’ (significant underestimates), as we have previously reported for this area for the anomalous 2012 rainfall season using CPC-RFE2 (Hermance and Sulieman Citation2013; Citation2014; hereafter referred to as papers 1 and 2). In this report, we assess the degree to which such artefacts in the 3B42 database reduce its effectiveness for detecting and monitoring extreme hydrometeorological events on a spatial and temporal scale of significance to local stakeholders in the Southeast Sahel.
2. Study area
The location of our study area in southeastern Sudan is shown in . ) is a view of the larger region, with a colour overlay from the TMPA 3B42 rainfall product (described later in the text) representing daily rainfall (5 mm) for 27 July 2006 – a day for which the 3B42 indicated a significant storm event at our principal GED site. The 2006 rainfall season was particularly intense in this area. The distribution and dimensions of the clusters of storm activity for the day show the small spatial scales expected for the local convective-type storms typical for the unimodal monsoonal rainy season in the Sahel. The location of Gedaref City is indicated in ) by an open circle so as not to mask the colour-coded map of the TMPA 3B42 product. Also shown in the figure are the local borders of the Sahel, the region of Africa immediately south of the Sahara bounded by mean annual rainfalls of 100 mm on the north and 600 mm on the south (Hermance Citation2014). Elevation contour lines at 200 m are shown in the background of the map in ). As a point of reference, Gedaref City has an elevation of 600 m. The site lies on what is generally a rolling savanna plain, except for the southeast–northwest trending Gedaref–Gallabat Ridge, having a local relief of some 100 m. The ridge extends to the foothills of the Ethiopian highlands to the southeast. Eritrea is to the east and northeast. ) shows the location of our principal WMO GED gauge relative to three cooperative gauges operated by the Sudan Mechanized Farming Corporation. These are referred to later in this report (Section 6). The background elevation contours show that the community of Doka in ) lies on a somewhat elevated segment of the Gedaref–Gallabat Ridge.
Figure 1. Location of our study area. (a) Regional map for the vicinity of Gedaref City (open circle) in Southeast Sahel showing daily rainfall for 27 July 2006 (5 mm), based on TMPA 3B42 estimates. Elevation contour interval is 200 m, with Gedaref State shown by the hatched area. (b) Local map showing the location of three cooperative gauge sites in addition to the principal WMO Gedaref gauge. Elevation contour interval is 50 m.
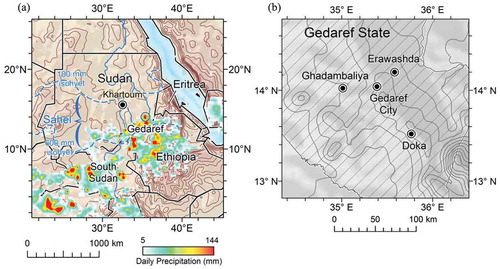
We selected the display date of 27 July 2006 for the TMPA rainfall product in ) following an inspection of the daily 3B42 time series in to determine the maximum daily storm event for our principal study period: 1999 − 2015. As seen in ), according to the 3B42 database, there is an intense localization of rainfall over the city on this date. The satellite estimated value of 117 mm for this day is the maximum daily storm event for this location recorded for 3B42 for the 17-year period of our study. Thus, ) is showing a potential major flash-flood inducing storm event, underscoring the small dimensions of the spatial scale and, indirectly, the temporal scale (one day or less) that products of the TMPA (and its follow-on Global Precipitation Mission, GPM) might be expected to resolve to be useful to the local user community. The following report assesses the status of the last decade and a half of such data. Corresponding GED gauge data for the 27 July 2006 3B42 event in ) are described later in Section 5.2.3 and .
Figure 2. Daily precipitation time series for the TMPA 3B42 product (panel (a)) compared with GED WMO gauge values (panel (b)) for the 1999 − 2015 epoch. Panel (c) shows daily differences or deviations between pairs of the principal daily rainfall metrics of this study: gauge and 3B42, where (3B42-GED gauge).
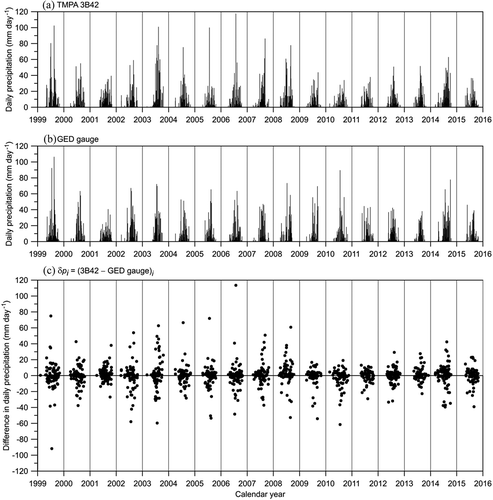
Figure 3. Regression analysis between the principal daily rainfall metrics of this study (3B42 versus GED gauge values) for the period of record 1999 − 2015. Data pairs are purged of couplets having zeros in common. Dashed line is only for reference showing a unit slope.
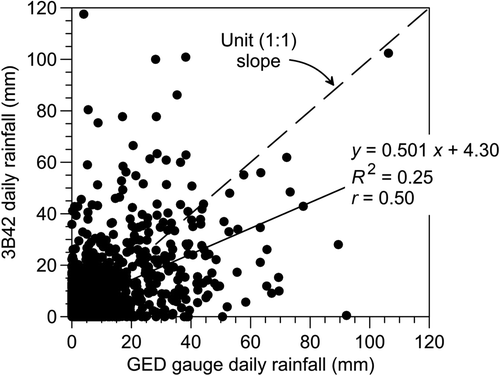
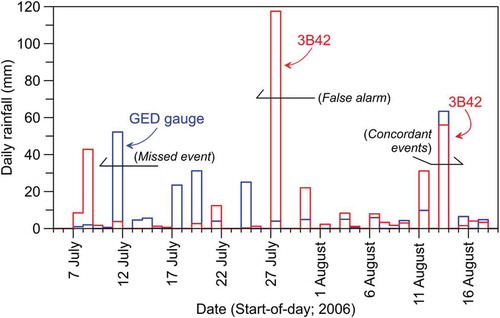
Figure 4. Enlarged overlays, 5 July 2006 to 18 August 2006, of GED gauge and 3B42 daily time series, around the date 27 July 2006, the maximum storm-day of record of the 3B42 database for the period of record, 1999 − 2015. See for the areal coverage of the 27 July 2006 event.
3. Data used in this study
3.1. Selected SPE
The application of satellite observations to predict and monitor hydrometeorological hazards has been emphasized by developers from before the first launch of instruments into space in the late 1950s (Fritz Citation1964; Barrett Citation1970; Arkin and Xie Citation1994; Habib, Henschke, and Adler Citation2009; Hong et al. Citation2007; Huffman et al. Citation2007; Kucera et al. Citation2013; Todd et al. Citation1995; Wu et al. Citation2016). A listing of representative SPE data sets has been compiled by the International Precipitation Working Group and is available at http://www.isac.cnr.it/~ipwg/data/datasets.html. Maggioni, Meyers, and Robinson (Citation2016) review the merits and accuracy of a number of the high-resolution SSP that have been reported by workers during the TRMM/TMPA era, both satellite-only and satellite-gauge (SG) merged products. As their spatial and temporal resolution has improved, a number of satellite missions particularly those of the National Oceanic and Atmospheric Administration (NOAA), the National Aeronautics and Space Administration (NASA), the Defense Meteorological Satellite Program and the Japan Aerospace Exploration Agency (JAXA), including several of the European Space Agency have focused on the role that satellites might play in the short-term forecasting of local high intensity storm events responsible for flash flooding, and under the appropriate geomorphic conditions, might cause landslides and mass movement of earth materials. Of the SPE products that agencies have made readily available to the larger public are those of NOAA’s Climate Prediction Center (CPC). In papers 1 and 2, we used the CPC African Rainfall Estimation Algorithm, Version 2.0, commonly referred to as the RFE2 (CPC-RFE2 Citation2012) and downloadable from: ftp://ftp.cpc.ncep.noaa.gov/fews/fewsdata/africa/rfe2/. The Tropical Rainfall Measuring Mission (TRMM), beginning with the single TRMM satellite launched as a joint project of NASA and JAXA in 1998, has now evolved to the TMPA program producing a variety of products, many of which have been reprocessed through a number of versions over the last decade (Huffman and Bolvin Citation2017).
In this report, we employ the TMPA Level 3 (L3) 3B42 Version 7 estimator produced as the 0.25° × 0.25° quasi-global (50°N-S) gridded databases described by Huffman et al. (Citation2007). The NASA labelling or identifier system (e.g. 3B4X) denotes that it is a Level 3 (gridded) product with input from multiple sensors (‘B’), and uses non-TRMM data (‘40’-series). The TMPA 3B42 Version 7 (V7) merges satellite rainfall estimates (S) from a number of instruments on different platforms with gauge data (G) through monthly adjustments to scaling parameters. The 3B42 SG algorithm first combines a range of microwave precipitation estimators from multiple low-earth-orbiting satellites merged with infrared precipitation estimators from multiple geosynchronous satellites. These combined estimates are then recalibrated with surface precipitation gauge data to provide the final SG-merged precipitation estimate as a Level 3 (L3) 3 h (optionally 1 day) 0.25° × 0.25° quasi-global (50°S to 50°N) gridded SG-rainfall database. Through reprocessing, the 3B42 is now available at a 3 h sampling interval from 1998 to present (2018). The latency period of the 3B42 SG merged database is normally about 2 months after the end of the month of record.
3.2. Gauge data for the Southeast Sahel
As noted in the introduction, our principal gauge of interest for this study is the WMO Gauge Number 62,752 in Gedaref (or Gadarif) City, Sudan (35.3912°E, 14.0385°N). The GED gauge is a member of the WMO Global Observing System (GOS) and a provider of quasi-real-time meteorological data to the WMO Global Telecommunications System (GTS) gauge network. As explained in the introduction, this is the only gauge in the region for which we have been able to compile a complete daily record for the time period of our study 1999−2015. Following WMO protocols, precipitation is collected in calibrated vertical-walled cylindrical containers, with amounts recorded by hand at 6 h synoptic intervals throughout the day, beginning at 09:00 (hh:mm) local time (LT) (which is 06:00 UTC) on the day-of-record, and ending at 09:00 LT the following day. The U.S. National Center for Environmental Information [NCEI, formally the National Climate Data Center (NCDC)] provides precipitation daily values [including the Global Summary of the Day] through several venues: ftp://ftp.ncdc.noaa.gov/pub/data/gsod/ and ftp://ftp.ncdc.noaa.gov/pub/data/ghcn/daily/. Data delivered to international data centres through the WMO GTS are available from the U.S. CPC at ftp://ftp.cpc.ncep.noaa.gov/fews/gts/. The Gedaref Met Office, for the purpose of quality control and to supply daily values missing from the NCEI (NCDC) and CPC archives, has provided other data directly to one of the coauthors (HMS). The on-site records of the Gedaref Met Office enabled in-filling of missing values and overall QA/QC of the database used. However, only data from 1999 to 2015 were available through the Gedaref Met Office for this purpose, thus restricting our period-of-record, since 3B42 data could not be cross-checked with gauge data for a complete set of daily values.
In Section 3.1, we mentioned that the TMPA 3B42 product is recalibrated on a monthly basis with surface gauge data. Depending on the time interval, the TMPA employs one or more globally gridded 0.5° × 0.5° gauge products produced by the Deutscher Wetterdienst (DWD) Global Precipitation Climatology Centre (GPCC) (Huffman and Bolvin Citation2017). Details on the GPCC product can be found in Schneider et al. (Citation2016). Members of the WMO GOS/GTS gauge network are significant contributors to the GPCC database. It is likely, therefore, that the WMO GOS/GTS gauge ID 62,752 at Gedaref City (our principal gauge site) is frequently used by the DWD GPCC to produce these monthly products. Thus, there might be some degree of interdependence of TMPA 3B42 time series and synchronous gauge data from members of the WMO GOS/GTS network (Cattani, Merino, and Levizzani Citation2016). If so, we would expect such effects to be most prominent at monthly and longer time scales. Therefore, the difference reported later in our discussion of only a few percent between the annual cumulates of 3B42 daily values and the annual cumulates of GED gauge daily values should not be surprising. To assess the degree of the potential interdependence of daily 3B42 and gauge values at our study site, we include similar pixel-to-point analyses for 2010–2013 for three cooperative gauge sites [see )]. These three gauges also provided daily values for papers 1 and 2, where daily time series are plotted for 2012.
3.3. Purging 3B42 and gauge time series of data pairs having common zeros
There are 6209 calendar days between 1 January 1999 and 31 December 2015, of which 4908 – 79% of the daily time series − have no rainfall reported for either the gauge data or the 3B42 estimates. We refer to these as ‘zero rainfall days’. Since the objective of our analysis is to assess the TMPA 3B42 product as a tool for detecting and monitoring synchronous rainfall events, we felt it advisable to reject data pairs where neither 3B42 nor the GED gauge recorded rainfall. Thus, a preliminary step in preparing our data was to reject those data pairs having zeros-in-common to minimize the effects of ‘zero-clumping’ in our analyses. This resulted in 1301 pairs of gauge and 3B42 events that had no zeros in common − one or the other metric reported rainfall ≥ 0.1 mm, which is the minimum daily value traditionally reported by gauges. Thus, 21% of the total number of calendar days were used in this analysis, since 79% of the days are rejected as being ‘dry’ in-common. The dates of storm events are not the same for both metrics. In the period of 1999−2015, there was an annual mean number of 59 storm-days recorded by the gauge and 60 storm-days reported by the 3B42 product. However, the gauge and 3B42 events are not always synchronous, so that the population of event pairs purged of zeros-in-common has a mean number of 77 event days, or data pairs, per year.
4. Methods
The methods used here to assess the skill level of the 3B42 product are similar to those used by other authors in the literature, or with slight modifications. To illustrate our procedures, the respective time series for our principal site are shown in , which compares daily time series for 3B42 SG with simultaneous daily observations from the WMO GED gauge over the period of record 1999–2015. The TMPA 3B42 three hour data have been time-base shifted and accumulated to daily values in Sudan LT. ) shows daily precipitation time series for the TMPA 3B42 product in Sudan LT. ) shows daily WMO GED gauge values to which the 3B42 are compared. ) shows the daily deviation between pairs of the principal daily rainfall metrics. Throughout this report, it is understood that ‘deviation’ refers to ‘daily deviation’, defined by the expression (). The ‘absolute deviation’ (AD) is a generic reference to
. As described in Section 3.3, only storm-days are used in this analysis, since all pixel-to-point data pairs (3B42 versus gauge) have been purged of days where both the SPE and gauge values have zero rainfall in common (< 0.1 mm day-1). The deviation
is used to calculate the signed and/or absolute difference between daily values of
and
, where i is the index of the respective member pair of the relevant time series. Composite statistics are presented in terms of either the original measurement metrics (mm day-1 or mm year-1) or normalized by an appropriate reference metric, with results expressed as percent (%) or fractional percent (i.e. decimal values).
A simple, but robust procedure for assessing the day-by-day concordance of SPE and gauge pairs, and their deviations, is to compare the synchrony of storms by rank. This determines whether the strongest storms as determined by gauge coincide by date and intensity with the strongest storms determined by SPEs. Examples are presented in . In addition, we will commonly make use of the mean of a metric, such as the mean of daily or annual rainfall for a gauge or collocated SPE pixel, or mean of a deviation, . We use the symbol
to denote the annualized cumulative value of a metric, which is computed as the 17-year average annual sum of a parameter. For example, the bias of 3B42 relative to the respective gauge will accordingly be
, where the summation index i over daily values is suppressed for convenience.
Table 1. Compare estimated intensity of the seven maximum SPE events with highest ranked gauge observations: 1999−2015.
As do many authors, we will make use of the root-mean-square (RMS) of a metric or deviation. Notation-wise, the RMS deviation of a data pair will be RMSD, and if we use the conventional notation of DV for the daily value of rainfall, the RMS value of daily variations will be RMSDV. The coefficient of variation (CV) is defined as the RMSD of a data pair, divided by the mean of the reference metric, usually the mean of the reference gauge values. A particularly useful assessment parameter is the simple, but robust metric: the mean of absolute deviations (MAD) or some variation thereof (Cattani, Merino, and Levizzani Citation2016; Gebremichael et al. Citation2014; Maggioni, Meyers, and Robinson Citation2016). A simple adaptation of the latter metric is to compute the ratio of the sum of ADs of daily SPEs to the sum of daily gauge values. We will refer to this ratio as the coefficient of misrepresentation, which we will use as a direct, quantitative indicator of cumulative day-by-day misfit in time and intensity of the respective 3B42 to gauge values.
Another class of metrics to assess estimation error is based on linear least squares and the first-order regression between an ensemble of pixel-to-point data pairs: a test variable versus the reference variable
, where each of the two refers to time series at one of the four gauge sites in this study [see )]. This leads to the best fitting slope (or transfer coefficient) between the data pairs and intercept. The covariance between the two variables, normalized by the geometric mean of the variances of each variable, is used to compute the coefficient of determination (
) and the Pearson correlation coefficient (r). While we do not advise drawing final conclusions from the usual significance tests and confidence intervals based on the respective variants being drawn from normal (i.e. Gaussian) distributions, we nevertheless find it useful to inspect the above regression parameters for comparative purposes. Some workers also calculate the Spearman’s rank correlation coefficient (Kendall Citation1970), our previous experience with similar data in this region (paper 2) has shown the latter provides little advantage over the Pearson’s correlation coefficient, which is more commonly used in the literature.
5. Analysis: TMPA 3B42 as a deterministic predictor of rainfall
5.1. Daily correlation of 3B42 rainfall estimates with gauge reference
is a regression analysis between the principal daily rainfall metrics of this study for the period of record 1999–2015. The respective data pairs only include those daily values not having common zeros, ruling out most of the days in November–March (NDJFM), inclusive.
The rather low coefficient of determination ( ≈ 0.25) shown in from the regression of 3B42 on the GED gauge data is typical for that found by other workers using 3B42 Version 7 (Xue et al. Citation2013) and implies that 75% of the variance of the observed rainfall is unexplained by a day-by-day deterministic link between 3B42 and actual rainfall events. (A similar result was found for the CPC-RFE2 product in paper 1.) The transfer coefficient (slope of the regression line) of ≈ 0.50 has a t-statistic of 20.6, so that it is unlikely the series are not related, and a 95% probability that the transfer coefficient lies between 0.45 and 0.55, which is significantly biased from unity − its target value from the TMPA algorithm. In regard to significance tests, and confidence intervals, for the type of broad-tailed, somewhat asymmetric distribution of the deviations involved, the assumption that normal statistics applies is qualitative at best. The suppressed slope of the regression line, or transfer coefficient, of 0.50 – notably less than unity – is not due to an intrinsic lower intensity of the 3B42 product relative to the gauge (such as the transfer coefficient of gauge to 3B42 values being intrinsically less than unity), but due to the inherent discordance – reduced covariance – between 3B42 and gauge events in timing and intensity. Qualitatively, these results imply that the covariance of 3B42 and gauge values is approximately 50% of the geometric mean of the variances of the 3B42 and gauge time series. To qualitatively reinforce that the two series are significantly related, in spite of the relatively low correlation, we find that whereas the coefficient of determination for the original, time synchronized purged data pairs is R2 = 0.25; for the pair when the GED gauge data are lagged by one day, R2 = 0.0063 and for the case when 3B42 is lagged one day, R2 = 0.0002. Thus, the R2 = 0.25, when 3B42 and GED gauge are ‘in-phase’, is qualitatively confirming that the members of the data pair are related. The next section assesses the implications of these deviations more robustly.
5.2. Robust determination of misrepresentations by false alarms and missed events
5.2.1. Definitions
The scatter of daily deviations presented in ) qualitatively assesses the day-by-day asynchrony of 3B42 with gauge-recorded rain events and shows that there are significant anomalies between the 3B42 estimates and gauge reference values. A section of , from 2006, is enlarged and replotted in to show that, in assessing the quality of SPE data, one will generally have three classes of events: 1) concordant events that are relatively synchronous in amplitude and timing with reference gauge events; 2) missed events (non-detects or significant underestimates) in which the gauge data indicate a significant storm event, whereas the SPE data imply a small or absent corresponding event and finally 3) false alarms (or significant overestimates), whereby the 3B42 records imply the occurrence of a significant storm event for which there is little or no evidence in the reference gauge data.
5.2.2. Regarding the 27 July 2006, maximum SPE event of record
Referring to the 1999−2015 time series in ), and their differences in ), it is clear that the largest daily storm of record for the 3B42 database occurs as a single spike in 2006; on 27 July to be exact, as shown in the expanded view of the timing of this event in . This is also the same day on which rainfall for our study area is displayed on the map in , showing an intense area of rain accumulation directly over the location of the (encircled) GED gauge. Is the 3B42 value a valid representation of the actual rainfall on that day?
A series of events in the time period including 27 July are shown in , beginning with two sequential SPE false alarms on 7 July and 8 July followed by the SPE missed event on 11 July (labelled). Several missed events follow, with a subdued false alarm on 21 July, and the concordant (synchronous) gauge and SPE event on 24 July. This typical mixed pattern of hits and misses is followed on 27 July by the 3B42 storm-day of record (for 1999 − 2015), having a daily intensity of 117 mm (labelled). In contrast, the gauge measurement for 27 July was only 4 mm. The latter agrees remarkably well with the CPC Rainfall Estimation Algorithm Version 2.0 (RFE2) estimate for the day of 4 mm for the 0.1° × 0.1° grid box collocated with the GED gauge in Gedaref City, with a range of 8−11 mm for the nearest surrounding pixels. The close agreement between gauge and the RFE2 estimate is likely due to the fact that the CPC applies daily SG calibrations to its Africa rainfall product, and the gridded map base used for this often uses the daily WMO GED gauge values. In contrast, the TMPA 3B42 SG product applies only a monthly composited gauge adjustment.
Continuing with the event scenario in , the singular TMPA 3B42 false alarm on 27 July is followed on 30 July by a more subdued (20 mm) false alarm, and finally on 13 August, by a set of concordant SPE and gauge events (labelled).
5.2.3. Ranked extremes
shows, in ranked form, the most intense storm-day events that are for the GED gauge. In the 1999−2015 period of record, there were seven such events. For any purpose of planning or mitigation of extreme weather, these would potentially be the most destructive events. The table compares these seven events by rank to the seven most extreme storm-days reported by the TMPA 3B42 product. Most important in is the discordance versus concordance in the timing of these events.
We note that the maximum storm-day of record (106 mm) for the GED gauge occurring on 19 August 1999 strikingly accords with the second ranked storm-day of record (102 mm) for 3B42. However, the remaining six highest ranked examples do not fare so well. In fact, as shown in , the maximum storm-day of record (118 mm) for 3B42 on 27 July 2006 is a false alarm. A second aspect of note in is that these seven most extreme events appear to be more intense for 3B42 than for the GED gauge. The mean intensity of the seven maximum events for GED is 83 mm day-1, while for 3B42, the mean intensity is 95 mm day-1, implying a positive mean bias of 15% for the most extreme daily events reported by 3B42.
5.2.4. RMS and ADs of daily SPES from gauge values
annualizes several of the principal features of daily TMPA 3B42 storm events with corresponding gauge data for the 17-year period of record 1999−2015. Row 1 of presents the mean annual rainfall of each metric – the 3B42 SPE and GED gauge − averaged over the 17-year period of record. Row 2 in is the annualized cumulative value of all daily false alarms, computed from the sum of all positive Row 3 in is the annualized cumulative value of all daily missed values, computed from the sum of all negative
. Of note is the magnitude of
, or the annualized cumulative value of the daily AD, in row 4, which is a robust composite metric of the misassignment of annual rainfall by the 3B42. For the 17 year period of record 1999 − 2015, the mean annual
is 584 mm, which is 93% of the mean annual GED gauge rainfall (631 mm).
Table 2. 1999–2015 Summary of 3B42 misassignment of daily rainfall. 77 days year-1. Annual bias = 2.2%.
Alternative metrics are sometimes used to present such results (Awange et al. Citation2016; Chiu and Shin Citation2006; Gebremichael et al. Citation2014; Gosset et al. Citation2013; Liu Citation2015). , rows 6 and 7 summarize the results in terms of the respective RMSDVs (RMS daily values). Rows 9 presents the commonly used mean daily rainfall for the GED gauge and the 3B42 metric (for a mean annual number of 77 storm-days). Row 10 is the MAD, which at 7.6 mm (rounded from 7.58 mm), when accumulated each year over a mean number of 77 daily storm events, is the 584 mm appearing in row 4. While row 9 shows that, for the Southeast Sahel, over time the mean daily gauge rainfall (8.2 mm) is remarkably close to the mean daily 3B42 rainfall (8.4 mm), the MAD in row 10 shows that on a day-by-day basis, the two metrics are significantly discordant in timing and intensity.
5.2.5. Statistical distribution of event misassignment by frequency and intensity
shows plots of two statistical distributions of the signed daily deviations of 3B42 from gauge values as given by . First, all 1301 values of
are ranked by increasing value from the most negative extreme. We then compute the cumulative fractions of two types of base totals as functions of
. In one case, we plot the cumulative fraction (quantile) of the mean annual number of storm-days (77 days per year), as a function of the ranked signed deviation intensities. In the other case, we plot the cumulative fraction of the annual total anomaly of the AD, or the mean annual total misrepresented rainfall (
= 584 mm), as a function of the ranked signed deviation intensities. lists representative values from the distributions in .
Table 3. Cumulative statistics on the daily deviation of 3B42 from GED gauge (1301 events; 1999−2015) .
Figure 5. Statistical distributions of the signed daily deviations of 3B42 from gauge values p plotted along the abscissa (x-axis), where the quantile with respect to the ordinate (y-axis) is the fraction of the respective base total, which is either the annual mean number of storm-days per year, or the total annual anomaly or misrepresented rainfall per year.
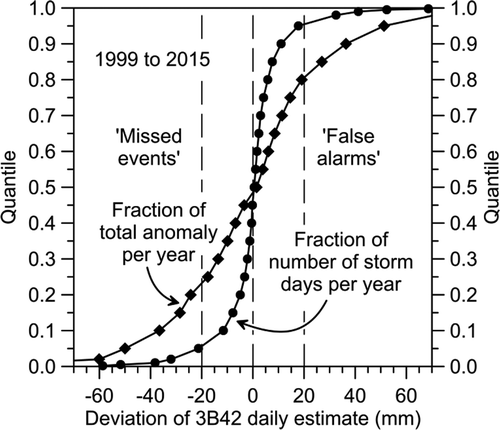
From on-site experience with the impact of rainstorms in the study area, we assert that any positive deviations from gauge values of 20 mm and greater are significant false alarms. Any negative deviations from gauge values more negative than –20 mm are significant missed events. Vertical dashed lines in highlight these ranges. The total annual anomaly is the annualized sum of the ADs (). Thus, according to the outer distribution in , 23% of the annual anomaly is associated with missing events of significant intensity (
mm), and 19% of the annual anomaly is associated with significant false alarms (
mm). In total, therefore, 42% of the significant storm total anomalies are misrepresented by the TMPA 3B42 database. From , and the tails of the distribution in , approximately 10% of the storm-day anomalous totals are beyond the range
, hence pose major threats to communities and natural ecosystems.
also shows the cumulative distribution of the number of days in a year associated with the rank of the signed deviation. The distribution is significantly more compact than the fraction of anomalous total rainfall. More than 90% of the storm-days have 3B42 deviations within the range ±20 mm, which is to say only 10% of the storm-days are misrepresented with deviations beyond the range ±20 mm. However, as noted in the previous paragraph, approximately 42% of the total annual anomaly (584 mm) is contributed by deviations beyond the range ±20 mm.
6. Compare results from cooperative gauge sites
compares the summary statistics for the principal GED data set for 1999–2015, with complementary data sets from the same GED gauge site, along with the three cooperative gauge sites for 2010–2013 [for locations, see )]. The number of purge samples (N) is given for each site and respective period of record, followed by the Pearson’s correlation coefficient (r), and the slope (transfer function) and intercept of a linear regression of 3B42 on the respective gauge data. While statistically meaningful, the correlation coefficient and the slope being significantly less than one are due to the poor covariance of the respective 3B42–gauge pairs. Not surprisingly, the bias for the principal 1999–2015 GED site is smallest, and most likely due to the GED gauge being used to calibrate monthly cumulates of 3B42 values. The CV and COM both confirm our concerns with the ability of the 3B42 to represent the timing and intensity of daily storm events. It seems that comparing the correlation coefficient, the slope, CV and COM among each of the 4 sites in 2010–2013, that the GED site has lower estimation errors than the three cooperative gauge sites. Most likely this is, again, a consequence of the GED gauge being regularly included in constructing the DWD GPCC gridded database, that in turn is used by the TMPA algorithm to calibrate the 3B42 satellite product.
Table 4. Compare summary statistics for the principal GED data set for 1999–2015, with complementary data sets from three cooperative gauge sites for 2010–2013.
7. Conclusions
To detect, monitor, predict and mitigate the effects of high impact, short term, extreme hydrometeorological events in the Southeast Sahel, on-site SPP users – farmers, herders and water managers – need SPEs that can adequately characterize anomalous rainfall event(s) on the hamlet scale. As the accountability of SPEs improves in the future through developments in the next generation GPM program, there will still be interest in returning to the years of its predecessor TMPA products. TMPA data have been and will continue to be critical for many reanalysis and retrospective applications of the 1998–2014 era. However, we conclude that daily deviations show that 3B42 storm events are too large, or too small, too early or too late, by degrees that are of the same order as the total amount of rainfall for the year. We have determined that, over the 17-year period 1999 − 2015, approximately 93% of the annual rainfall at our principal GED study site is contributed by daily events that the 3B42 product misrepresents in timing and intensity. For the 4 years 2010–2013, while the COM for GED drops to approximately 80%, it increases to more than 100% for the three cooperative gauges. Users need to ask whether such a misrepresentation is consistent with their intended application. Over a period of time, the accumulated effect of the 3B42’s false alarms and missed events tend to balance out, similar to our findings in paper 1 and paper 2 for the CPC-RFE2 product. But on a day-by-day, storm-by-storm basis, this was not the case for the CPC-RFE2, nor is it the case for the TMPA 3B42 SG. In this report, we have shown that of the seven most extreme daily events for the 17-year period recorded by the GED gauge, only one was synchronously detected by the 3B42 SPE (). Moreover, the extreme member of the set of seven daily events identified by the 3B42 database on 27 July 2006 (see ) is in fact a false alarm, with no counterpart in the gauge data, nor in the respective CPC-RFE2 product for that day.
Based on field experience in the area, and conversations with local stakeholders, any positive deviation from a gauge value of 20 mm or greater is a significant false alarm, and any negative deviation from a gauge value more negative than –20 mm is a significant missed event. The composite effect of both false alarms and missing values is that 42% of significant storm events are misrepresented by the TMPA 3B42 database. Moreover, approximately 10% of the significant storm events are beyond the range , resulting in major misrepresentation of actual hydrometeorological conditions to the local communities and natural ecosystems.
Our analysis indicates qualitatively and quantitatively that the utility of the 3B42 to serve as a deterministic predictor of the occurrence and intensity of daily rainfall on a day-by-day, storm-by-storm basis is currently inadequate for the purposes of predicting and monitoring the type of daily rainfall events responsible for the local scale, high impact, short-term hydrometeorological extremes typical of the Southeast Sahel.
Acknowledgements
The authors would like to acknowledge the data and services provided through the Tropical Rainfall Measurement Mission Project (TRMM), now evolved to the TRMM Multisatellite Precipitation Analysis (TMPA) program, particularly access to the Version 7 TRMM/TMPA 3B42 database provided through the Goddard Space Flight Center Distributed Active Archive Center (GSFC DAAC), Greenbelt, MD. Data may be accessed at http://disc.gsfc.nasa.gov/datacollection/TRMM_3B42_V7.shtml; data, and subsetting by area and date is available at the Giovanni site: https://giovanni.gsfc.nasa.gov/giovanni/.
Disclosure statement
No potential conflict of interest was reported by the authors.
References
- Arkin, P. A., and P. P. Xie. 1994. “The Global Precipitation Climatology Project - 1st Algorithm Intercomparison Project.” Bulletin of the American Meteorological Society 75 (3): 401–419. doi:10.1175/1520-0477(1994)075<0401:tgpcpf>2.0.co;2.
- Awange, J. L., V. G. Ferreira, E. Forootan, S. Khandu, A. Andam-Akorful, N. O. Agutu, and X. F. He. 2016. “Uncertainties in Remotely Sensed Precipitation Data over Africa.” International Journal of Climatology 36 (1): 303–323. doi:10.1002/joc.4346.
- Barrett, E. C. 1970. “Estimation of Monthly Rainfall from Satellite Data.” Monthly Weather Review 98 (4): 322–327. doi:10.1175/1520-0493(1970)098<0322:TEOMRF>2.3.CO;2.
- Cattani, E., A. Merino, and V. Levizzani. 2016. “Evaluation of Monthly Satellite-Derived Precipitation Products over East Africa.” Journal of Hydrometeorology 17 (10): 2555–2573. doi:10.1175/jhm-d-15-0042.1.
- Chiu, L., and D.-B. Shin. 2006. “Surface Rain Rates from TRMM Satellite Algorithms.” In Earth Science Satellite Remote Sensing, Science and Instruments, edited by J. Qu, W. Gao, M. Kafatos, R. Murphy, and V. Salomonson, 317–336. London: Springer.
- CPC-RFE2. 2012. “African Rainfall Estimation Algorithm, Version 2.0.” Accessed 26 December 2012. http://www.cpc.ncep.noaa.gov/products/fews/RFE2.0_tech.pdf.
- Fritz, S. 1964. “Pictures from Meteorological Satellites and Their Interpretation.” Space Science Reviews 3 (4): 541–580. doi:10.1007/bf00214471.
- Gebremichael, M., M. M. Bitew, F. A. Hirpa, and G. N. Tesfay. 2014. “Accuracy of Satellite Rainfall Estimates in the Blue Nile Basin: Lowland Plain versus Highland Mountain.” Water Resources Research 50 (11): 8775–8790. doi:10.1002/2013WR014500.
- Gosset, M., J. Viarre, G. Quantin, and M. Alcoba. 2013. “Evaluation of Several Rainfall Products Used for Hydrological Applications over West Africa Using Two High-Resolution Gauge Networks.” Quarterly Journal of the Royal Meteorological Society 139 (673): 923–940. doi:10.1002/qj.2130.
- Habib, E., M. Elsaadani, and A. T. Haile. 2012. “Climatology-Focused Evaluation of CMORPH and TMPA Satellite Rainfall Products over the Nile Basin.” Journal of Applied Meteorology and Climatology 51 (12): 2105–2121. doi:10.1175/jamc-d-11-0252.1.
- Habib, E., A. Henschke, and R. F. Adler. 2009. “Evaluation of TMPA Satellite-Based Research and Real-Time Rainfall Estimates during Six Tropical-Related Heavy Rainfall Events over Louisiana, USA.” Atmospheric Research 94 (3): 373–388. doi:10.1016/j.atmosres.2009.06.015.
- Hermance, J. F. 2014. Historical Variability of Rainfall in the African East Sahel of Sudan Implications for Development, SpringerBriefs in Earth Sciences. London: Springer.
- Hermance, J. F., and H. M. Sulieman. 2013. “Comparing Satellite RFE Data with Surface Gauges for 2012 Extreme Storms in African East Sahel.” Remote Sensing Letters 4 (7): 696–705. doi:10.1080/2150704X.2013.787498.
- Hermance, J. F., and H. M. Sulieman. 2014. “Assessing Daily and Seasonal Satellite Rainfall Estimates Using Local Gauges for the Anomalous 2012 Monsoon Season in the African East Sahel.” International Journal of Remote Sensing 35 (1): 253–288. doi:10.1080/01431161.2013.866294.
- Hong, Y., R. F. Adler, F. Hossain, S. Curtis, and G. J. Huffman. 2007. “A First Approach to Global Runoff Simulation Using Satellite Rainfall Estimation.” Water Resources Research 43 (8). doi:10.1029/2006wr005739.
- Huffman, G. J., and D. T. Bolvin. 2017. “TRMM and Other Data Precipitation Data Set Documentation.” Accessed 2 November 2017. ftp://meso-a.gsfc.nasa.gov/pub/trmmdocs/3B42_3B43_doc.pdf.
- Huffman, G. J., R. F. Adler, D. T. Bolvin, G. J. Gu, E. J. Nelkin, K. P. Bowman, Y. Hong, E. F. Stocker, and D. B. Wolff. 2007. “The TRMM Multisatellite Precipitation Analysis (TMPA): Quasi-Global, Multiyear, Combined-Sensor Precipitation Estimates at Fine Scales.” Journal of Hydrometeorology 8 (1): 38–55. doi:10.1175/jhm560.1.
- Kendall, M. 1970. Rank Correlation Methods. 4th ed. London: Charles Griffin.
- Kucera, P. A., E. E. Ebert, F. J. Turk, V. Levizzani, D. Kirschbaum, F. J. Tapiador, A. Loew, and M. Borsche. 2013. “Precipitation from Space Advancing Earth System Science.” Bulletin of the American Meteorological Society 94 (3): 365–375. doi:10.1175/bams-d-11-00171.1.
- Li, X. H., Q. Zhang, and C. Y. Xu. 2012. “Suitability of the TRMM Satellite Rainfalls in Driving a Distributed Hydrological Model for Water Balance Computations in Xinjiang Catchment, Poyang Lake Basin.” Journal of Hydrology 426: 28–38. doi:10.1016/j.jhydrol.2012.01.013.
- Liu, Z. 2015. “Comparison of Precipitation Estimates between Version 7 3-Hourly TRMM Multi-Satellite Precipitation Analysis (TMPA) Near-Real-Time and Research Products.” Atmospheric Research 153: 119–133. doi:10.1016/j.atmosres.2014.07.032.
- Maggioni, V., P. C. Meyers, and M. D. Robinson. 2016. “A Review of Merged High-Resolution Satellite Precipitation Product Accuracy during the Tropical Rainfall Measuring Mission (TRMM) Era.” Journal of Hydrometeorology 17 (4): 1101–1117. doi:10.1175/jhm-d-15-0190.1.
- Nicholson, S. E. 2014. “A Detailed Look at the Recent Drought Situation in the Greater Horn of Africa.” Journal of Arid Environments 103: 71–79. doi:10.1016/j.jaridenv.2013.12.003.
- Nicholson, S. E., B. Some, J. McCollum, E. Nelkin, D. Klotter, Y. Berte, B. M. Diallo, et al. 2003. “Validation of TRMM and Other Rainfall Estimates with a High-Density Gauge Dataset for West Africa. Part II: Validation of TRMM Rainfall Products.” Journal of Applied Meteorology 42 (10): 1355–1368. doi:10.1175/1520-0450(2003)042<355:votaor>2.0.co;2.
- Roca, R., P. Chambon, I. Jobard, and P. E. Kirstetter. 2010. “Comparing Satellite and Surface Rainfall Products over West Africa at Meteorologically Relevant Scales during the AMMA Campaign Using Error Estimates.” Journal of Applied Meteorology and Climatology 49 (4): 715–731. doi:10.1175/2009jamc2318.1.
- Schneider, U., A. Becker, P. Finger, A. Meyer-Christoffer, B. Rudolf, and M. Ziese. 2016. GPCC Full Data Reanalysis Version 7.0: Monthly Land-Surface Precipitation from Rain Gauges Built on GTS Based and Historic Data. Boulder, CO: Research Data Archive at the National Center for Atmospheric Research, Computational and Information Systems Laboratory.
- Thiemig, V., R. Rojas, M. Zambrano-Bigiarini, V. Levizzani, and A. De Roo. 2012. “Validation of Satellite-Based Precipitation Products over Sparsely Gauged African River Basins.” Journal of Hydrometeorology 13 (6): 1760–1783. doi:10.1175/JHM-D-12-032.1.
- Todd, M. C., E. C. Barrett, M. J. Beaumont, and J. L. Green. 1995. “Satellite Identification of Rain Days over the Upper Nile River Basin Using an Optimum Infrared Rain/No-Rain Threshold Temperature.” Journal of Applied Meteorology 34 (12): 2600–2611. doi:10.1175/1520-0450(1995)034<2600:SIORDO>2.0.CO;2.
- Villarini, G., and W. F. Krajewski. 2007. “Evaluation of the Research Version TMPA Three-Hourly 0.25 Degrees X 0.25 Degrees Rainfall Estimates over Oklahoma.” Geophysical Research Letters 34 (5). doi:10.1029/2006gl029147.
- Wu, H., M. Y. Huang, Q. H. Tang, D. B. Kirschbaum, and P. Ward. 2016. “Hydrometeorological Hazards: Monitoring, Forecasting, Risk Assessment, and Socioeconomic Responses.” Advances in Meteorology 1–3. doi:10.1155/2016/2367939.
- Xue, X. W., Y. Hong, A. S. Limaye, J. J. Gourley, G. J. Huffman, S. I. Khan, C. Dorji, and S. Chen. 2013. “Statistical and Hydrological Evaluation of TRMM-based Multi-Satellite Precipitation Analysis over the Wangchu Basin of Bhutan: Are the Latest Satellite Precipitation Products 3B42V7 Ready for Use in Ungauged Basins?” Journal of Hydrology 499: 91–99. doi:10.1016/j.jhydrol.2013.06.042.
- Zulkafli, Z., W. Buytaert, C. Onof, B. Manz, E. Tarnavsky, W. Lavado, and J.-L. Guyot. 2014. “A Comparative Performance Analysis of TRMM 3B42 (TMPA) Versions 6 and 7 for Hydrological Applications over Andean–Amazon River Basins.” Journal of Hydrometeorology 15 (2): 581–592. doi:10.1175/jhm-d-13-094.1.