
 ?Mathematical formulae have been encoded as MathML and are displayed in this HTML version using MathJax in order to improve their display. Uncheck the box to turn MathJax off. This feature requires Javascript. Click on a formula to zoom.
ABSTRACT
The subtropical high temperature anomaly of 2013 in China, adversely affected paddy rice physiology, especially at the heading, flowering and grain filling stages, and left untold damage and significant rice yield reductions in that year. Considering the importance of data on crop failure induced by abnormal meteorological events, in understanding the potential impacts of climate change on agriculture and food security, and in support of crop insurance policies, the current study employs satellite remote sensing data to map and estimate the areal extent of high-temperature-induced damage on paddy rice in 2013, along the Yangtze River, a major rice producing area in China. In this regard, the daily mean and maximum air temperatures were first estimated using the Moderate Resolution Imaging Spectroradiometer (MODIS) Land Surface Temperature (LST) products, MODIS Vegetation Indices (VI) products, altitude information from a Digital Elevation Model (DEM), and air temperature measurements at meteorological stations located within the Yangtze River Basin from 2000 to 2016, to derive fully covered mean and maximum daily air temperatures. Paddy rice cultivated areas were then identified based on the seasonal profiles of MODIS Enhanced Vegetation Index (EVI) and Land Surface Water Index (LSWI) in 2013, and map errors at provincial scales were no more than 8.7%. Finally, paddy rice growth characteristics were combined with MODIS VI products to identify heading and flowering stages, and the time series of daily mean and maximum air temperatures, paddy rice phenology and cultivated area, were integrated to map and estimate the rice crop area damaged by the anomalous high temperature. Our results show that all provinces along the Yangtze River, this study investigated, recorded a substantial damaged rice crop area, following the 2013 subtropical temperature high, and Anhui Province was the hardest hit with a damaged rice area of 63.6%. For the entire study area, a damage extent of about 5,656,000 ha, accounting for 35.9% of total paddy rice planted area, was recorded. This indicates a significant agro-meteorological disaster, and in an era of increasing climate variability and weather extremes, studies of this nature would greatly benefit global food security planning and management policies.
1. Introduction
Rice is one of the most important staple food in the world, and its cultivated fields account for about 15% of global cropland area (IRRI Citation1993). The rice crop thrives well under abundant precipitation and warmer temperatures (Liu et al. Citation2013). However, annual temperatures have increased by 0.13°C every 10 years between 1956 and 2006, twice as much as that recorded in the preceding century (IPCC Citation2007).
It has been indicated that anomalously high temperatures at periods coinciding with the paddy rice heading or flowering stages is a critical factor limiting crop yield as it hastens rice senescence, shortens grain filling duration and reduces biomass production, all of which contribute to a decline in grain yield (Huang et al. Citation2016; Tashiro and Wardlaw Citation1989). Monitoring the damage caused by high temperatures on paddy rice is therefore vital for understanding the potential impact of climate variability and change on agriculture and food security.
The key prerequisites for monitoring high-temperature-induced damage on the rice crop involve the estimation of fully covered daily maximum air temperature () and daily mean air temperature (
), estimating rice cultivated area and its distribution, and identifying the key stages of paddy rice growth, especially heading and flowering stage. Fortunately, there exists a growing body of literature on the acquisition of the above parameters using satellite data.
Several research showed that both daily mean air temperature and maximum air temperature can be estimated using satellite land surface temperature. Huang et al. (Citation2015) and Guo et al. (Citation2017) estimated daily mean air temperature using correlations between air temperature measured at meteorological stations and Land Surface Temperature (LST) generated from remote sensing datasets. Prihodko and Goward (Citation1997) proposed the Temperature Vegetation Index (TVX) to estimate maximum air temperature. Based on TVX, Stisen et al. (Citation2007) estimated maximum air temperature over Africa using Meteosat Second Generation, Spinning Enhanced Visible and Infrared Imager (MSG SEVIRI) data. Nieto et al. (Citation2011) calibrated the TVX algorithm using a new maximum Normalized Difference Vegetation Index (NDVI) value at different vegetation stages. Zhu, Lű, and Jia (Citation2013) showed that daily maximum temperature can be retrieved effectively from Moderate Resolution Imaging Spectroradiometer (MODIS) LST products using TVX. Vancutsem et al. (Citation2010) have also demonstrated the possibility of retrieving near surface air temperature from MODIS LST products in different ecosystems over Africa.
Meanwhile, various vegetation indices have been used to extract paddy rice cultivated area and phenology. Xiao et al. (Citation2005, Citation2006)) used NDVI, Enhanced Vegetation Index (EVI) and Land Surface Water Index (LSWI) to map paddy rice agriculture in South and Southeast Asia, and Southern China. Boschetti et al. (Citation2017) proposed a method for the automatic extraction of spatio-temporal information of the rice crop using EVI and Normalized Difference Flood Index (NDFI) data. Owing to its capability to minimize saturation at higher biomass levels, EVI is used in this study in tandem with LSWI. EVI time series have been extensively used across satellite sensors to map paddy rice fields (Tucker et al. Citation2005; Sun Citation2009a; Zheng, Wang, and Huang Citation2009; Dou et al. Citation2017; Mansaray et al. Citation2017, Citation2019). Yang, Shao, and Li (Citation2017) used an improved scheme for rice phenology estimation based on time-series multispectral environment and disaster monitoring and forecasting small satellite constellation A/B (HJ-1 A/B) and polarimetric RADARSAT-2 data. Sun et al. (Citation2009b) detected key growth stages of paddy rice using the temporal profile of MODIS EVI. Wang et al. (Citation2016) utilized the environment and disaster monitoring satellite (HJ-1) EVI time series to map the dynamic change of rice phenology.
Considering the importance of acquiring data on crop damage due to extreme weather patterns, the current study presents a framework for mapping high temperature damaged area of paddy rice by integrating daily mean air temperature, maximum air temperature, planting area, and phenology extracted from remote sensing data. With its wide use in the retrieval of relevant ecosystem parameters and its suitability for time-series-based large area mapping initiatives, MODIS data are utilized in the current study.
2. Materials
2.1. Study area
The study area along the Yangtze River extends from 24.5°N to 35.1°N and 97.4°E to 121.9°E. The area considered covers six provincial-level administrative units; Jiangsu Province, Anhui Province, Hubei Province, Hunan Province, Jiangxi Province and Sichuan Province (). Both single and double cropped paddy rice cultivation systems are practiced within the study area. While a double-cropped rice (DCR) cultivation system is practiced in Jiangxi and Hunan provinces, a single-cropped rice (SCR) cultivation system is dominant in Jiangsu, Anhui, Sichuan and Hubei provinces, with a few DCR fields in Anhui and Hubei provinces.
Figure 1. Location of study area and distribution of meteorological stations.
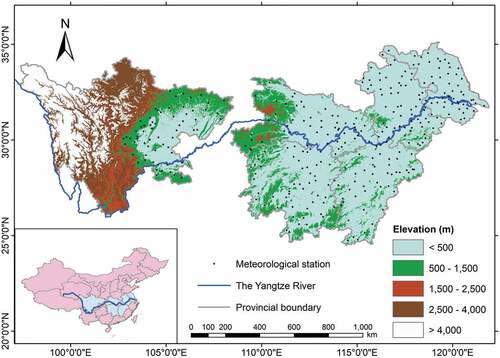
The study area has a subtropical monsoon climate with warm temperatures and abundant precipitation. The catchment area of the Yangtze River has the highest concentration of freshwater lakes in China, including the famous Lake Poyang and Lake Dongting, and most parts of the study area are relatively flat and low-lying. A combination of the above climatic, hydrographic and topographic factors makes the study area suitable for a wide range of farming activities, and it is no doubt being one of the major rice producers in China.
2.2. MODIS data
The Terra and Aqua satellite platforms hosting the MODIS sensor were launched in December 1999 and May 2002, respectively. The Terra satellite overpass time is about 10:30 ante meridiem (AM) in its descending mode and about 10:30 post meridiem (PM) in its ascending mode. In contrast, the Aqua satellite overpass time is about 1:30 AM in its ascending mode and about 1:30 PM in its descending mode (Wang, Li, and Cribb Citation2006). The MODIS products are generated in square tile units with the Sinusoidal (SIN) grid projection, each tile covers approximately 1200 km at the equator.
Four MODIS products (Collection 6) were used in this study, including the daily LST products (MOD11A1/MYD11A1) at 1 km spatial resolution, 16 day composite vegetation indices products (MOD13A2/MYD13A2) at 1 km spatial resolution, 8 day composite reflectance products (MOD09A1) at 500 m spatial resolution, and annual Land Cover products (MCD12Q1) at 500 m spatial resolution. The LST products and vegetation indices products are derived from Terra and Aqua satellites. MOD09A1 products are derived from Terra satellite. MOD12Q1 uses both Terra and Aqua MODIS input data once a year. All the products above are available on the website of the Land Processes Distributed Active Archive Center (LPDAAC).
MODIS LST products are generated from two thermal bands: band 31 (10.78 μm – 12.28 μm) and band 32 (11.77 μm – 12.27 μm) using the split-window algorithm (Wan et al. Citation2002). For MODIS daily LST products, there are 12 sub-datasets for each tile, sub-dataset 1 and sub-dataset 5 represent day and night LST at about 10:30 AM and 10:30 PM for Terra, respectively, and day and night LST at about 1:30 AM and 1:30 PM for Aqua, respectively. Sub-dataset 2 and sub-dataset 6 represent Quality Control (QC) for LST and emissivity of day and night, and good quality pixels are those whose QC value equals zero.
MODIS Vegetation Index (VI) products were produced using the Maximum Value Composite (MVC) method at 16 day temporal resolution (MOD13A2/MYD13A2). MODIS VI products are combined with 12 sub-datasets, including NDVI and EVI and their pixel reliability. MODIS VI products derived from Terra and Aqua satellites are 16 day composites, but they have an 8 day time difference. This study combines Terra with Aqua satellite VI products to obtain 8 day composite VI products at 1 km spatial resolution. Good quality pixels were selected using the Quality Assurance (QA) (sub-dataset 12).
For MODIS reflectance products (MOD09A1), sub-dataset 2 (Near Infrared, NIR) and sub-dataset 6 (Short-Wave Infrared, SWIR) were used to calculate LSWI. The LSWI quality was checked for consistency with MODIS VI products. After being resampled to the 1 km spatial resolution, LSWI data showed similar pixel quality with VI products of corresponding composite days.
MCD12Q1 products incorporate five different land cover classification schemes, including the International Geosphere-Biosphere Programme (IGBP) global vegetation classification scheme, the University of Maryland (UMD) scheme, the MODIS-derived Leaf Area Index (LAI), and Fraction of Photosynthetically Active Radiation (FPAR) scheme, the MODIS-derived Net Primary Production (NPP) scheme, and the Plant Functional Type (PFT) scheme. The PFT scheme was used in this study.
2.3. Meteorological data
In this study, air temperature data from 2000 to 2016 were collected from 381 meteorological stations within the study area. Collected temperature parameters included and
, measured at 1.5 m above the ground. These data were downloaded from China meteorological data service center (CMDC).
In the study area, paddy rice is mainly planted in flat and low-lying terrains. In order to better demonstrate the correlation between LST and air temperature for rice crop area, only meteorological stations located at altitudes lower than 1500 m and slopes under 2° were selected. In addition, considering the impact of land cover on LST, only meteorological stations located in vegetated areas as shown by the MODIS Global Land Cover product PFT scheme were selected. From the 381 meteorological stations in the study area, 330 meteorological stations met the criteria for use in the correlation between LST and air temperature. The spatial distribution of the 330 meteorological stations is illustrated in .
2.4. Digital Elevation Model (DEM) data
Shuttle Radar Topography Mission (SRTM) 90 m Digital Elevation Model (DEM) data were obtained from the Consultative Group on International Agricultural Research-Consortium for Spatial Information (CGIAR-CSI) GeoPortal. To ensure consistency with the spatial resolution of MODIS LST products, the 90 m spatial resolution of SRTM-DEM data were resampled to the 1 km spatial resolution, and then reprojected to the SIN grid projection. The 1 km spatial resolution SRTM-DEM covering the study area is also showed in .
3. Methods
illustrates the methodological approach adopted in this study. Firstly, LST dataset, vegetation indices dataset and reflectance dataset obtained from MODIS products were used to produce preprocessed LST image, NDVI image, EVI image and LSWI image. The DEM dataset was resampled to a 1 km spatial resolution and subset to the areal extent of the study area. Air temperature dataset measured at meteorological stations were processed to derive and
dataset. Secondly, fully covered
image and
image were obtained based on the estimated models of
and
using the satellite derived LST data as predictor. The temporal profiles of NDVI and LSWI were then used to map paddy rice pixels and estimate the crop’s heading and flowering. Finally, using critical threshold values, a combination of fully covered
image,
image, and paddy rice cultivated area image and its heading or flowering periods, allowed mapping of the high temperature damaged area of paddy rice in the study area in 2013.
Figure 2. Methodological approach used in the current study.
3.1. Estimation of LST under cloud cover
Several studies have shown that clear sky pixel i LSTi,ec in the estimated image can be calculated from corresponding pixels LSTi,rc in the reference image and pixel’s altitude (h) and EVI (Yu et al. Citation2015) using Equation (1). In the current study, the percentage of clear sky pixels in the reference image is more 70%, and the time difference between the estimate image and the reference image is less than a month.
Then the model and the coefficients a, b, c and d can be used to estimate cloud pixel j LSTj, ecl under cloud cover in the estimated image as Equation (2).
3.2. Estimation of daily maximum air temperature
Prihodko and Goward (Citation1997) developed the TVX method to estimate air temperature. Their results indicated a strong negative relationship between NDVI and LST, and the air temperature of a fully vegetated canopy was found equal to the air temperature within the canopy. Using a 7 7 moving window, a linear regression model between LST and NDVI is built if more than two-thirds of pixel LST and NDVI values are valid in a moving window. The relevant mathematical function is given in Equation (3).
where the coefficients S and I can be used to calculated the instantaneous air temperature (TTVX) of the pixel at the centre of the moving window using Equation (4).
where NDVIs is the NDVI value of fully covered vegetation. The infinite fully covered NDVI value computed by Prihodko and Goward (Citation1997) ranges from 0.82 to 0.86, and the maximum NDVI of paddy rice in the study area was approximately 0.82 (Zheng, Wang, and Huang Citation2009). In the current study therefore, 0.82 was chosen as the critical value of NDVI saturation.
The Aqua satellite overpass time is around 1:30 PM, and the instantaneous LST derived from Aqua MODIS is close to daily (Guo et al. Citation2017). At last, the daily maximum air temperature
is estimated using Equation (5).
3.3. Mapping paddy rice cultivated area
EVI is sensitive to canopy variations (Huete et al. Citation2002) and LSWI is sensitive to soil moisture. Due to the 500 m spatial resolution of MODIS 8 day composite reflectance (MOD09A1) product as against the 1 km spatial resolution of the MODIS 8 day composite vegetation indices product, LSWI was resampled to a 1 km spatial resolution.
At transplanting, paddy rice fields are flooded. At this stage, rice fields have little vegetation cover and therefore a lower EVI value. In contrast, LSWI being sensitive to water has its maximum value during this period. As paddy rice grows after transplanting, the increase in canopy leads to a corresponding increase in EVI up to the heading stage. After heading, the yellowing of leaves leads to a gradual decrease in EVI (Sun Citation2009a). These temporal profiles allowed for the discrimination of paddy rice and estimation of its heading or flowering stages. Rivers, ponds, forest and others were masked out using the MODIS Global Land Cover (MCD12Q1) product.
3.4. Mapping high temperature damaged area
Previous studies have indicated that high temperature damage on paddy rice is mainly confined to the crop’s heading or flowering stages, and this period has been successfully mapped using NDVI and EVI time series data (Wang et al. Citation2013; Xiao Citation2011). As paddy rice EVI reaches maximum at the heading or flowering stage, this parameter was found useful in the detection of the aforementioned growth stages.
Reference to subsections 3.1, 3.2, and 3.3, daily mean air temperature images, daily maximum air temperature images, planting area images of paddy rice, and the heading or flowering MODIS images of paddy rice were obtained and integrated to derive the high temperature damage images (HTDI) using Equation (6).
where RPAI represents rice planting area image, and HTI represents high temperature images, HTI = {daily for 3 consecutive days}
{daily
for 3 consecutive days}, and HOFI represents images of paddy rice at heading or flowering.
This information was further combined with the estimated area of paddy rice and its heading or flowering stages to produce a map and an estimate of the high temperature damaged area of paddy rice along the Yangtze River following the heat wave of 2013.
4. Results and discussion
4.1. Validation of daily  and daily
4.1.1. Calibration and validation of daily
LST has a strong correlation with near-surface air temperature in a certain range (Hachem, Duguay, and Allard Citation2011). In this study, a linear regression model for measured at 330 meteorological stations and LST derived from Terra and Aqua MODIS LST products was established. With the exception of data in 2013 which were used for validation, the regression model included
and LST data from 2000 to 2016. In addition, to accurately fit the correlation between
and LST of paddy rice cultivated fields and improve on the accuracy of estimating high temperature damaged area of paddy rice, a linear regression including data from the paddy rice green-up stage to the maturity stage was established, results of which are shown in .
Figure 3. Regression between daily mean air temperature and MODIS LST for model calibration. TD (a), TN (b), AD (c), AN (d) represent Terra Day time LST, Terra Night time LST, Aqua Daytime LST and Aqua Night time LST, respectively. N represents the sample number.
It is obvious that the liner relationship between and nighttime LST outperforms that involving daytime LST, considering the higher coefficient of determination (
) and lower root mean square error (
°C) with nighttime LST. Aqua nighttime LST had the best linear relationship with
(R2 = 0.87).
The spatial coverage of Aqua night time LST and Terra night time LST is limited, although both have been interpolated in the previous process. To increase LST coverage, both Terra night time and Aqua night time estimated were used. The computation rule is that if one pixel only has one estimated
, generated only by one satellite, the pixel
value was equal to this estimated
. But if the pixel had two estimated
, the pixel
was the mean value of the two estimated
, despite the presence of several deficient
pixels due to cloud interference. At last, Inverse Distance Weight (IDW) method was employed to the interpolation of
for the cloud-contaminated pixels because features proximal to each other are more likely to have similar attributes as against those at distances (Hodam et al. Citation2017) and air temperature has a strong spatial correlation.
(a) shows the correlation between measured and estimated
using both Terra and Aqua nighttime LST. The results show that measured
and estimated
have a relatively good correlation, and that 47.5% of the deviation is within 1.00°C and 94.3% of the errors are less than ±3.00°C. In addition, the R2 between
and estimated
is 0.95, with RMSE, MAE and Bias values of 1.60°C, 1.30°C and −0.30°C, respectively.
Figure 4. Validation of daily mean air temperature and daily maximum temperature estimated from MODIS LST (a) observed and estimated
using both Terra and Aqua nighttime LST, and (b) observed
and estimated
using TVX.
A body of scientific literature exists on the estimation of daily mean air temperature and daily maximum temperature using satellite data. Pichierri, Bonafoni, and Biondi (Citation2012) employed brightness temperature and emissivity from thermal infrared MODIS channel 31 and 32 to estimate direct air temperature 2 m above the ground surface in Milan, Italy, and obtained an error below 2.00°C. Colombi et al. (Citation2007) used empirical approaches to relate LST to air temperature, and instantaneous air temperature to daily mean air temperature, and they obtained a daily mean air temperature with an overall RMSE of 1.89°C. Guo et al. (Citation2017) employed daily mean air temperature data from meteorological stations in Anhui and Jiangsu provinces in China in 2013, to build a linear regression model that estimates daily mean air temperature, and an RMSE of 2.01°C was recorded. Yan et al. (Citation2009) estimated air temperature from MODIS data in East China using all synoptic weather stations, and recorded an RMSE of 3.23°C. In the current study, a better estimation accuracy with RMSE = 1.60°C was recorded when data acquired only from weather stations located in vegetated areas were used.
4.1.2. Calibration and validation of daily maximum air temperature estimation
Comparison of instantaneous air temperature () estimated using the TVX method, and
shows a strong positive correlation between
and
with R2 = 0.65, RMSE = 2.52°C, Bias = 0.65, and MAE = 1.95°C. The regression model between
and
is given in Equation (7).
The estimated was computed using Equation (7), and the results showed a decrease in RMSE from 2.50°C to 2.30°C and MAE from 2.00°C to 1.90°C. Then a linear regression between instantaneous air temperature at about 1:30 PM (estimated by TVX) and daily
was built to improve daily
estimation accuracy. (b) shows the relationship between estimated
and observed
, and a good correlation is observed. It is observed that 32.1% of the errors were within 1.00°C, and 79.5% were less than ±3.00°C. Similar to mean air temperature, the cloud contaminated pixels were interpolated via IDW, using all 381 meteorological stations.
A number of studies have attempted to derive maximum air temperature from LST using regression analysis (Vancutsem et al. Citation2010). Shah et al. (Citation2013) employed TVX to estimate daily maximum air temperature over the Indo-Gangetic Plain and obtained an RMSE of 2.20°C. Xu, Qin, and Shen (Citation2011) attempted to improve the TVX method by considering the influence of too much cloud or water and observed an MAE of 2.40°C. Our study built a linear regression model between the instantaneous air temperature derived from MODIS data and daily maximum temperature measured by meteorological stations, and a decrease in RMSE from 2.50°C to 2.30°C, and MAE from 2.00°C to 1.90°C, was recorded. These are acceptable.
4.2. Mapping and estimation of paddy rice area
There are two paddy rice cropping systems in a year in the study area, single-cropped rice and double-cropped rice. Double-cropped systems are divided into early rice and late rice. For paddy rice to be classified as early (including SCR fields), the following conditions should be met at the transplanting stage: LSWI + 0.05 > EVI, EVI < 0.26, and LSWI > 0.12. After transplanting, the EVI of early paddy rice fields is expected to attain at least half of its maximum value within the first five 8 day composites, or the mean EVI value should be greater than 0.35 between the sixth 8 day EVI composite and the eleventh 8 day EVI composite.
For late rice, the EVI at corresponding phenology to early rice is obviously higher due to the influence of the background on transplanting date, while LSWI is almost the same. This is attributable to the longer wavelength of the short wave infrared band, giving it a stronger penetration power than the infrared band. For later rice, it should satisfy the following conditions at the transplanting stage; LSWI + 0.17 > EVI, EVI < 0.35 and LSWI > 0.12. Similar to early rice, late rice fields should reach half of their maximum EVI within the first five 8 day composites, or the mean EVI value should be greater than 0.35 between the sixth 8 day EVI composite and eleventh 8 day EVI composite.
shows the paddy rice cultivated area in the study area in 2013, and includes both single-cropped and double-cropped rice systems. According to data from the Chinese Ministry of Agriculture, Jiangsu, Anhui, Hubei, Hunan, Jiangxi and Sichuan provinces had in 2013, paddy rice cultivated areas of approximately 2,266,000 ha, 2,214,000 ha, 2,101,000 ha, 4,085,000 ha, 3,338,000 ha and 1,991,000 ha, respectively, with a grand total rice area of 15,813,000 ha. In our study, the estimated rice cultivated areas of the aforementioned provinces are 2,310,000 ha, 2,044,000 ha, 1,932,000 ha, 3,910,000 ha, 3,438,000 ha, and 2,110,000 ha, respectively, and their corresponding errors relative to government statistics provided above are 1.9%, −8.3%, −8.7%, −4.4%, 2.9% and 5.6%, respectively. The relatively lower errors () of the above estimates would support the mapping of high temperature damaged area of paddy rice along the Yangtze River in 2013. Summary statistics of paddy rice cultivated area in the study area in 2013 are given in .
Table 1. Statistics of paddy rice cultivated area along the Yangtze River in 2013.
Figure 5. Rice cultivated area in the study area in 2013 estimated using MODIS data.
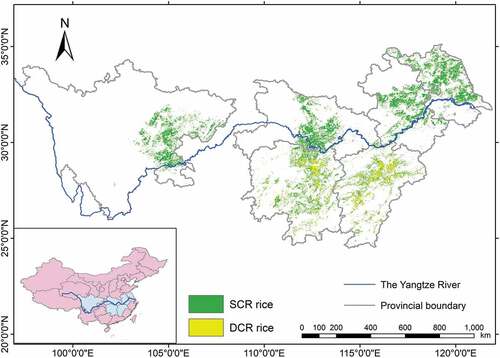
Amidst several other studies, Xiao et al. (Citation2005) and Sun et al. (Citation2009a) have mapped paddy rice cultivated area, using critical values of vegetation indices. In (Xiao et al. Citation2005), the EVI of paddy rice fields is expected to attain at least half of its maximum value within the first five 8 day composites after rice is transplanted, and using this critical value as a classification feature, they reported a reasonable agreement between MODIS-derived paddy rice area and that obtained from Landsat data at county level in southern China. Sun (Citation2009a) defined the mean EVI of paddy rice fields to be greater than 0.35 between the sixth 8 day EVI composite and the eleventh 8 day EVI composite after transplanting as critical EVI value, errors of paddy rice area mapping for a test site located in southern China were confined between 3% to 27%. In our proposed approach, only pixels that satisfy both thresholds recommended in Xiao et al. (Citation2005) and Sun (Citation2009a) were mapped as paddy rice, and the resultant map errors at provincial scales were no more than 8.7% when validated against government agricultural statistics on paddy rice area. This observation suggests that the synergistic use of classification features employed in this study substantially improves paddy rice mapping and area estimation accuracies at regional scales.
4.3. Mapping and estimation of high temperature damaged area
The high temperature damaged area of paddy rice in the study area in 2013 is calculated using Equation (6) and the result is presented in the thematic map shown in , and the corresponding statistics at provincial scales are provided in .
Table 2. Estimated high temperature damaged area of paddy rice in 2013 based on MODIS data.
Figure 6. High temperature damaged area of paddy rice in the study area in 2013.
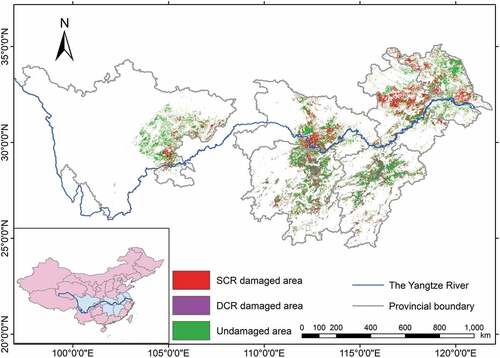
The results show that all six provinces recorded damaged areas of paddy rice following the 2013 heat wave. Anhui Province was reported to have 1,200,000 ha of damaged rice fields attributed to the high temperature anomaly of 2013 (Guo et al. Citation2017), and our estimates reported 1,297,000 ha for the same, an estimation error of 7.5%. This means that our results are acceptable. The percentage of high temperature damaged area of paddy rice over the planting area range from 24.5% to 63.5%. Anhui Province had 63.5% of its rice cultivated area being damaged by high temperatures, and a 48.8% damage is recorded for Hubei Province.
To the best of our knowledge, this study presents the first attempt to mapping high temperature damaged area of paddy rice at a regional scale using MODIS and ancillary datasets. The estimated high temperature damaged areas of paddy rice agreed well with reference data. In future, considering the growing incidence of erratic weather patterns brought by climate change and variability, remote sensing technologies would be useful in mapping, at near real-time, the impacts of anomalous high temperatures on crop development. Data obtained from such investigations would aid the estimation of agricultural yield loss and in forecasting food scarcity and prices.
5. Conclusions
Climate change and variability pose significant threats to sustainable agricultural production and food security, and rising temperatures is one of the most reported variables in this regard. Temperatures beyond the optimal agronomic requirement could result in poor crop growth and ultimately, lower yields. Paddy rice is one crop affected by high temperatures, especially during the heading and flowering stages, and previous studies have reported attendant reductions in final grain yield. Considering the importance of rice in meeting the calorie requirements of over half of the world’s human population, the current study proposed a framework to map high temperature damaged area of paddy rice by integrating daily mean air temperature and daily maximum air temperature obtained from meteorological observations and MODIS LST, and paddy rice cultivated area and its heading and flowering stages obtained from MODIS data.
Based on the proposed framework, all provinces along the Yangtze River recorded a substantial area of paddy rice damage, following the 2013 subtropical temperature high, and with a damaged area of 63.6%, Anhui Province was the hardest hit. For the entire study area, a damage extent of about 5,656,000 ha, accounting for 35.9% of total paddy rice cultivated area, was recorded. A validation of our estimated high temperature damaged area of paddy rice against government agricultural statistics proved the robustness of our proposed mapping approach, owing to errors confined below 8%.
The high temperature damaged area of paddy rice, as reported in this study, confirms that the 2013 subtropical temperature high in China, contemporaneous with the paddy rice growing season, was a significant agro-meteorological disaster along the Yangtze River. In this era of increasing climate variability and weather extremes, remote sensing datasets, such as MODIS, would provide the much needed information on crop failure to support early warning and food disaster preparedness, crop insurance policies, and in assessing the impacts of climate change on agriculture and global food security.
Acknowledgements
The authors would like to thank the National Aeronautics and Space Administration (NASA) and the China Meteorological Data Service Center (CMDC) for providing MODIS products and in-situ meteorological data, respectively.
Disclosure statement
No potential conflict of interest was reported by the authors.
Additional information
Funding
References
- Boschetti, M., L. Busetto, G. Manfron, A. Laborte, S. Asilo, S. Pazhanivelan, and A. Nelson. 2017. “PhenoRice: A Method for Automatic Extraction of Spatio-temporal Information on Rice Crops Using Satellite Data Time Series.” Remote Sensing of Environment 194: 347–365. doi:10.1016/j.rse.2017.03.029.
- Colombi, A., C. D. Michele, M. Pepe, and A. Rampini. 2007. “Estimation of Daily Mean Air Temperature from MODIS LST in Alpine Areas.” Earsel Eproceedings 6: 38–46.
- Dou, Y. J., J. Wang, P. L. Song, D. D. Zhang, J. F. Huang, and L. M. Wang. 2017. “Paddy Rice Field Mapping Using GF-1 Images with SVM Method.” Paper presented at the International Conference on Agro-Geoinformatics, Fairfax, August 7–10.
- Guo, J. M., J. J. Wang, Y. Wu, X. Y. Xie, and S. H. Shen. 2017. “Research on Monitoring and Modeling of Rice Heat Injury Based on Satellite and Meteorological Station Data: Case Study of Jiangsu and Anhui.” Research of Agricultural Modernization 38: 298–306.
- Hachem, S., C. R. Duguay, and M. Allard. 2011. “Comparison of MODIS-derived Land Surface Temperatures with Ground Surface and Air Temperature Measurements in Continuous Permafrost Terrain.” The Cryosphere 6: 51–69. doi:10.5194/tc-6-51-2012.
- Hodam, S., S. Sarkar, A. G. R. Marak, A. Bandyopadhyay, and A. Bhadra. 2017. “Spatial Interpolation of Reference Evapotranspiration in India: Comparison of IDW and Kriging Methods.” Journal of the Institution of Engineers 98: 1–14. doi:10.1007/s40030-017-0241-z.
- Huang, M., R. C. Zhang, P. Jiang, X. B. Xie, X. F. Zhou, F. B. Cao, and Y. B. Zou. 2016. “Temperature-Related Yield Constraints of Early-Rice in South China: A Cross-Location Analysis.” PLoS One 11: 1–10. doi:10.1371/journal.pone.0158601.
- Huang, R., C. Zhang, J. X. Huang, D. H. Zhu, L. M. Wang, and J. Liu. 2015. “Mapping of Daily Mean Air Temperature in Agricultural Regions Using Daytime and Nighttime Land Surface Temperatures Derived from TERRA and AQUA MODIS Data.” Remote Sensing 7: 8728–8756. doi:10.3390/rs70708728.
- Huete, A. R., K. Didan, T. Miura, E. P. Rodriguez, X. Gao, and L. G. Ferreira. 2002. “Overview of the Radiometric and Biophysical Performance of the Modis Vegetation Indices.” Remote Sensing of Environment, 83, 195–213. doi:10.1016/S0034-4257(02)00096-2.
- IPCC. 2007. Climate Change 2007: Impacts, Adaptation and Vulnerability Summary for Policymakers Contribution of Working Group II to the Fourth Assessment Report of the Intergovernmental Panel on Climate Change. Cambridge: Cambridge University Press.
- IRRI. 1993. 1993–1995 IRRI Rice Almanac. Manila: International Rice Research Institute.
- Liu, Z. H., Z. Li, P. Tang, Z. Li, W. Wu, P. Yang, L. Z. You, and H. J. Tang. 2013. “Change Analysis of Rice Area and Production in China during the past Three Decades.” Journal of Geographical Sciences 23: 1005–1018. doi:10.1007/s11442-013-1059-x.
- Mansaray, L., W. J. Huang, D. D. Zhang, J. F. Huang, and J. Li. 2017. “Mapping Rice Fields in Urban Shanghai, Southeast China, Using Sentinel-1A and Landsat 8 Datasets.” Remote Sensing 9: 257. doi:10.3390/rs9030257.
- Mansaray, L. R., F. Wang, J. Huang, L. Yang, and A. S. Kanu. 2019. “Accuracies of Support Vector Machine (SVM) and Random Forest (RF) in Rice Mapping with Sentinel-1A, Landsat-8 and Sentinel-2A Datasets.” Geocarto International 1–17. doi:10.1080/10106049.2019.1568586.
- Nieto, H., I. Sandholt, I. Aguado, E. Chuvieco, and S. Stisen. 2011. “Air Temperature Estimation with MSG-SEVIRI Data: Calibration and Validation of the TVX Algorithm for the Iberian Peninsula.” Remote Sensing of Environment 115: 107–116. doi:10.1016/j.rse.2010.08.010.
- Pichierri, M., S. Bonafoni, and R. Biondi. 2012. “Satellite Air Temperature Estimation for Monitoring the Canopy Layer Heat Island of Milan.” Remote Sensing of Environment 127: 130–138. doi:10.1016/j.rse.2012.08.025.
- Prihodko, L., and S. N. Goward. 1997. “Estimation of Air Temperature from Remotely Sensed Surface Observations.” Remote Sensing of Environment 60: 335–346. doi:10.1016/S0034-4257(96)00216-7.
- Shah, D. B., M. R. Pandya, H. J. Trivedi, and A. R. Jani. 2013. “Estimating Minimum and Maximum Air Temperature Using MODIS Data over Indo-Gangetic Plain.” Journal of Earth System Science 122: 1593–1605. doi:10.1007/s12040-013-0369-9.
- Stisen, S., I. Sandholt, A. Norgaard, R. Fensholt, and L. Eklundh. 2007. “Estimation of Diurnal Air Temperature Using MSG SEVIRI Data in West Africa.” Remote Sensing of Environment 110: 262–274. doi:10.1016/j.rse.2007.02.025.
- Sun, H. S. 2009a. Extracting Planting Area and Growth Information of Paddy Rice Using Multi-temporal MODIS Data in China. IN: Zhejiang university.
- Sun, H. S., J. F. Huang, and D. L. Peng. 2009b. “Detecting Major Growth Stages of Paddy Rice Using MODIS Data.” Journal of Remote Sensing 17: 1243–1260.
- Tashiro, T., and I. F. Wardlaw. 1989. “A Comparison of the Effect of High Temperature on Grain Development in Wheat and Rice.” Annals of Botany 64: 59–65. doi:10.1093/oxfordjournals.aob.a087808.
- Tucker, C. J., J. E. Pinzon, M. E. Brown, D. Slayback, E. W. Pak, R. Mahoney, E. F. Vermote, and N. E. Saleous. 2005. “An Extended AVHRR 8-km NDVI Dataset Compatible with MODIS and SPOT Vegetation NDVI Data.” International Journal of Remote Sensing 26: 4485–4498. doi:10.1080/01431160500168686.
- Vancutsem, C., P. Ceccato, T. Dinku, and S. J. Connor. 2010. “Evaluation of MODIS Land Surface Temperature Data to Estimate Air Temperature in Different Ecosystems over Africa.” Remote Sensing of Environment 114: 449–465. doi:10.1016/j.rse.2009.10.002.
- Wan, Z., Y. Zhang, Q. Zhang, and Z. Li. 2002. “Validation of the Land-Surface Temperature Products Retrieved from Terra Moderate Resolution Imaging Spectroradiometer Data.” Remote Sensing of Environment 83: 163–180. doi:10.1016/S0034-4257(02)00093-7.
- Wang, J., J. F. Huang, P. Gao, C. W. Wei, and L. Mansaray. 2016. “Dynamic Mapping of Rice Growth Parameters Using HJ-1 CCD Time Series Data.” Remote Sensing 8: 931. doi:10.3390/rs8110931.
- Wang, K., Z. Li, and M. Cribb. 2006. “Estimation of Evaporative Fraction from A Combination of Day and Night Land Surface Temperatures and NDVI: A New Method to Determine the Priestley-Taylor Parameter.” Remote Sensing of Environment 102: 293–305. doi:10.1016/j.rse.2006.02.007.
- Wang, X. C., J. D. Feng, R. Wang, Z. Zhou, and X. Li. 2013. “The Monitoring Analysis of Paddy Rice Growing Periods in the Western Sichuan Plain Based on SPOT-NDVI.” Chinese Agricultural Science Bulletin 29: 39–46 [In Chinese]. doi:10.11924/j.issn.1000-6850.2012-4037.
- Xiao, J. T. 2011. Rice Phenology Extraction and Ground Verification Based on MODIS Vegetation Index. IN: University of Electronic Science and technology.
- Xiao, X. M., S. Boles, J. Y. Liu, D. F. Zhuang, S. Frolking, C. S. Li, W. Salas, and B. Moore. 2005. “Mapping Paddy Rice Agriculture in Southern China Using Multi-temporal MODIS Images.” Remote Sensing of Environment 95: 480–492. doi:10.1016/j.rse.2004.12.009.
- Xiao, X. M., S. Boles, S. Frolking, C. Li, J. Y. Babu, W. Salas, and B. Moore. 2006. “Mapping Paddy Rice Agriculture in South and Southeast Asia Using Multi-temporal MODIS Images.” Remote Sensing of Environment 100: 95–113. doi:10.1016/j.rse.2005.10.004.
- Xu, Y. M., Z. H. Qin, and Y. Shen. 2011. “Estimation of near Surface Air Temperature from MODIS Data in the Yangtze River Delta.” Transactions of the CSAE 27: 63–68.
- Yan, H., J. H. Zhang, Y. Y. Hou, and Y. B. He. 2009. “Estimation of Air Temperature from MODIS Data in East China.” International Journal of Remote Sensing 30: 6261–6275. doi:10.1080/01431160902842375.
- Yang, Z., Y. Shao, and K. Li. 2017. “An Improved Scheme for Rice Phenology Estimation Based on Time-series Multispectral HJ A/B and Polarimetric RADARSAT-2 Data.” Remote Sensing of Environment 195: 184–201. doi:10.1016/j.rse.2017.04.016.
- Yu, W., Z. T. Nan, Z. W. Wang, H. Chen, T. H. Wu, and L. Zhao. 2015. “An Effective Interpolation Method for MODIS Land Surface Temperature on the Qinghai–Tibet Plateau.” IEEE Journal of Selected Topics in Applied Earth Observations and Remote Sensing 8: 4539–4550. doi:10.1109/JSTARS.2015.2464094.
- Zheng, C. C., X. Z. Wang, and J. F. Huang. 2009. “Mapping Paddy Rice Planting Area in Zhejiang Province Using Multi-temporal MODIS Images.” Journal of Zhejiang University (Agricultural & Life Sciences) 35: 98–104.
- Zhu, W. B., A. F. Lű, and S. F. Jia. 2013. “Estimation of Daily Maximum and Minimum Air Temperature Using MODIS Land Surface Temperature Products.” Remote Sensing of Environment 130: 62–73. doi:10.1016/j.rse.2012.10.034.