
ABSTRACT
Monitoring for maintenance or studies of energy efficiency in buildings, large infrastructure, industrial facilities, etc., are common nowadays. These kind of studies are developed with inspections which determine the state of the facilities that are analysed. The difficulty is increased along with the size and complexity of the facility itself, and even more when the attribute to be surveyed is not noticeable or responsive for the human eye. In recent years, a series of techniques that rely on different sensors mounted on UAVs allow detecting problems that are associated with facilities of large dimensions. Almost all of them work in the visible band (RGB), but the generation of thermal 3D models permits detecting any heat anomaly related to the functioning of these facilities. This research proposes a methodology and workflow for the generation and Metric Contrast of Thermal Models (MCTM). This methodology is metrically applied to a mining-industrial facility in which thermal conditions have great influence for a proper functioning. For this metric contrast, several distances have been measured in the field and compared to those obtained from the models. The average difference between the true magnitude and those obtained from the RGB and thermal models are 5 and 31 cm, and their standard deviations are 7 and 29 cm, respectively. The comparison between the RGB and the thermal model provides an average distance between points is 0.19 m, and for 75% of the points the distance is lesser than 0.35 m. Although the RGB model is more accurate, the precision of the thermal model is enough for the objectives set.
1. Introduction
Nowadays, large buildings, infrastructures, industrial facilities, etc., require periodic inspections that allow guaranteeing their proper functioning. They are being developed by a technician, who recognizes the area that is subjected to monitoring, and makes punctual measurements where noticeable incidences occur. The analysis of the damages or problems that can appear in any installation of this type allows adopting corrective measurements, which can be of capital importance for proper functioning, safety or habitability (Biscarini et al. Citation2020). One of the main problems that arise when developing this sort of inspections are the dimensions and accessibility of the facilities themselves. Increasing sizes and bad conditions of accessibility imply more problematic, time-consuming, expensive and hazardous inspections (Ali et al. Citation2020).
The development of ‘Unmanned Aerial Vehicles’ (UAVs) has contributed to the proliferation of multispectral aerial studies (Trefilov et al. Citation2021). At the present time, the application of UAV platforms for this type of monitoring activities in buildings with hard access is one of the most common applications within the field of photogrammetry with drones (Zefri et al. Citation2018). However, the use of cameras that are responsive to the visible wavelength (RGB) or low-cost cameras is increasing in this kind of works. This permits the generation of 3D models with reliable metrics, and therefore, qualitative and quantitative inspections that provide a more cost-effective solution for the previously described problem.
On the other hand, drones with infrared-sensitive (thermal) sensors have been used in recent years. They provide unique information about the temperature of the surface and can benefit a wide range of environmental, industrial and agricultural applications (Aragon et al. Citation2020). More recently, examples of its breakthrough in the mining sector can be presented: sensors have been applied to detect discontinuities in underground excavations (Pérez-García et al. Citation2018), cavities (Turner, MacLaughlin, and Iverson Citation2020), or fires in old coal mines (Shao et al. Citation2021). In addition to the foregoing, they can be useful in mining-industrial facilities, where heat monitoring is essential for their good functioning, and environmental degradation can happen (smoke, fog, rain, scarce-light conditions, etc.). This type of sensors can be applied with all guarantees (Mizginov and Kniaz Citation2019). Thermal information is usually qualitative, as 2D images are applied for these works (Zhao et al. Citation2019). This thermal information is obtained with non-metric sensors and, although 3D models can be generated with thermal information (thermal models), it does not generally have any geometric information linked (geometric 3D models).
Understanding the radiometric response of visible and near-infrared cameras is important to obtain quantitative spectral information (Teixeira Crusiol et al. Citation2020). In this regard, some authors apply multi-sensor devices to generate 3D models with thermal texture of buildings from infrared images (Alba et al. Citation2011). Other works produce 3D thermal models for industrial and heritage applications by merging data from remote sensing technologies, such as laser scanner and thermographic cameras (Campione et al. Citation2020), or propose low-cost graphic methods to produce 3D heat data of buildings from infrared images (Antón and José-Lázaro Citation2021).
The main objectives of this research are to establish a technique to combine the different data (Vladimir Citation2019) that are required to obtain a heat 3D model, which are provided by thermal and RGB sensors mounted on a drone, and to contrast its metric goodness. This technique can become an alternative that, in addition to being fast, cheap and useful to document any kind of facility, allows the geometric/thermal inspection of the plant, thus solving the arisen issue. It will also set a procedure to ease the development of the so-called ‘seventh dimension’ of the facility (Kapogiannis, Gaterell, and Oulasoglou Citation2015; Wang and Liu Citation2020; Zheng et al. Citation2020). That is to say, the one that allows managing the whole life cycle of the facility itself, through an early detection of different types of problems, and helps to optimize inspections, repairs, maintenance, etc. All of the above is intended to assess the order of magnitude of a problem that may occur in a plant, and define the corrective measurements that should be adopted.
In the end, a workflow is designed to take the leap between the qualitative and the quantitative, especially in the metric aspect of the thermal model, which can be applied to face the inspection of large facilities, where the temperature monitoring can be fundamental for its proper functioning. In addition to the foregoing, it will permit the automation in the inspection of this kind of buildings and/or facilities (Rakha and Gorodetsky Citation2018).
This work is structured according to the development of the research itself. Firstly, a proposal of materials and methods is made. This proposal includes the instrumental and methodologies that are required to generate the RGB and thermal models, and specifies the general and detailed photogrammetric flights. Secondly, a methodology to manage data, and the process to develop the Metric Contrast of the Thermal Model (MCTM) are set. After establishing the proposal, it is applied to an actual mining facility, which allows discussing the results, and obtaining the final conclusions.
2. Materials and methods
Nowadays, several widely developed instrumental and methodological proposals are available (Zefri et al. Citation2018). However, according to the aim of this research, the workflow requires the definition of three main lines of action:
The selection of the sensors and the platform to use, according to the application of the geometric and thermal model.
Method to design and plan the UAV flights to acquire the images and information that are required to generate the geometric and thermal 3D models.
Workflow for the generation of the thermal model and the development of the MCTM (Wakeford et al. Citation2019).
2.1. Instrumental proposal
The proposal regarding the basic instrumentation that is required for the activities aimed at obtaining a thermal 3D model and its metric contrast is explained below.
2.1.1. UAV Platform
Nowadays, two main types of UAV platforms are available to obtain images that allow a subsequent processing of the information: fixed wing and multirotor devices (Greenwood, Lynch, and Zekkos Citation2019). The methodologic proposal will justify the necessity to apply a multirotor UAV, also known as multicopter. The current variety of these kinds of drones is large. Essentially, very basic features must be satisfied, such as sufficient autonomy to fly over the facility to be modelled (more batteries can be used). They must be able to fly with RGB and thermal sensors enabled (they will be defined later), and they must include all the navigation mechanisms of this type of drones (flight controller, GPS device, inertial navigation system, and gimbal, to guarantee the stability of the sensors during the acquisition of images). It must be noted that there are many manufacturers that offer different drones that satisfy these features. The most important characteristic that should be considered when selecting a sensor, is that it provides the required information at the lower cost. This implies several challenges that must be faced to obtain a set of stable data for the mosaic (Abolt et al. Citation2018).
2.1.2. Non-metric RGB photographic camera
The non-metric/low-cost RGB photographic camera is nothing but a digital camera. In this sense, the main characteristics that must be satisfied are the same that those required for any camera: configuration, resolution, image size, format, etc. However, the focal distance must be considered in this case. The difference between a metric camera and a low-cost one lies on the value of the focal distance and other parameters, such as the radial or tangential distortions. In a metric camera, it is tight, and in a non-metric camera it is approximate (Zhang, Jian-jing and Meng-qing Citation2016; Fryskowska et al. Citation2016; Gašparovic and Gajski Citation2016). In the first case, the scale of the model is very strict, and in the second one, it is rough (although a subsequent transformation can be applied to scale the model). The main inconvenience is the cost of a metric sensor, which is much higher than a non-metric one. The market offers a huge number of manufacturers that develop these two alternatives.
2.1.3. Multispectral or thermal/low-cost infrared camera
In this case, the sensor that is sought can have a double approach: the multispectral sensor/camera, which can obtain images with different wavelengths within the electromagnetic spectrum, or a sensor that is responsive to the thermal or infrared spectrum only. The first option offers more capabilities than the second one, since it can work with very diverse wavelengths, not just those of the infrared, but it has the inconvenience of a much higher cost (Shahmoradi et al. Citation2020). In order to offer an economically competitive instrumental proposal, a thermal camera, which specifically observes in the infrared spectrum and allows obtaining the desired information in a much economical way, is adopted.
These cameras usually count with different configurations that measure temperatures through points, areas, or the delimitation of thermal ranges. Any of these settings permits obtaining the information that is required to generate the desired model. The main inconvenience of these sensors is the spatial resolution, which is substantially lower than that of RGB cameras. Panoramic focusing algorithms can be applied to obtain similar resolutions (Park et al. Citation2018).
2.1.4. Survey station or GPS devices
In addition to the navigation systems of the drone, a set of Ground Control Points (GCPs), which allow geolocation of the model and scaling through a 3D transformation (Blistan et al. Citation2019), are usually acquired. According to the accessibility of the reference system that is applied, classical surveying, such as Survey Station or Global Positioning System (GPS) devices can be used. Given the current development and dissemination of the techniques required for photogrammetry supporting, this research is not focused on it.
2.1.5. Selection of the instrumental platform
In order to optimize the flight time, it is proposed to integrate the RGB and thermal sensors on a single UAV platform. The images required to generate the thermal and geometric 3D model are obtained with just one flight. In this sense, there are not many manufacturers that integrate several sensors on a same drone, which limits the instrumental selection.
In addition to meet the aforementioned conditions, this research adopted an economically competitive platform. After a thorough analysis of all the available alternatives on the market, a DJI Mavic Enterprise Dual quadcopter multirotor drone was selected. It is a compact drone that allows registering thermal images.
This drone has been developed for professional purposes, and integrates thermal and visual cameras, which turn it into a versatile tool for inspection, safety, rescue activities, etc. The drone has a light weight and reduced dimensions, which provide an intermediate flight autonomy, robust technology in terms of sensors, and allows a stable and precise flight, even with relatively adverse climatic conditions, with wind speeds up to 50 km/h. Its main features are shown in .
Table 1. Main Features of DJI Mavic Enterprise Dual drone
The RGB camera comprised by the Mavic Enterprise Dual Drone is an M2ED visual camera, a real image sensor with 4 K resolution that captures visible light. The images that are obtained with this sensor are simultaneously and automatically recorded with the images acquired by the thermal sensor of the Mavic Enterprise Dual Drone, which is a thermal FLIR Lepton® micro-camera, with a working range between 5 and 14 microns. Nowadays, techniques for a combined calibration of the colour and long-wavelength infrared cameras that are applied to obtain multimodal data sets (Knyaz and Moshkantsev Citation2019) are available. They allow guaranteeing the specifications of the sensors, which certifies the success of the scheduled work.
Considering the storage file formats, this sensor is characterized by recording qualitative, non-quantitative, thermal values of temperature. This could be a problem when generating the thermal model itself. However, it allows developing this research without inconveniences, as the process to generate the model is the same, and the aim of this research is focused on the MCTM. The reason that supports its selection is that it is undoubtedly one of the lowest cost sensors that are currently available on the market.
2.2. Flight planning proposal
The design and protocol for field data acquisition mainly refers to the capture of the set of photograms that is required to generate both 3D models, which is usually known as flight planning. This scheduling is well established when working with exclusively cartographic purposes and is derived from the classic photogrammetric flights that were developed with conventional planes. Regarding UAV flights planning, very rigorous research works that seek its optimization are available (de Luis-Ruiz et al. Citation2020). However, there is not a cause that justifies specific programming in this case. This is the reason why the initial proposal is based on the use of commercial software.
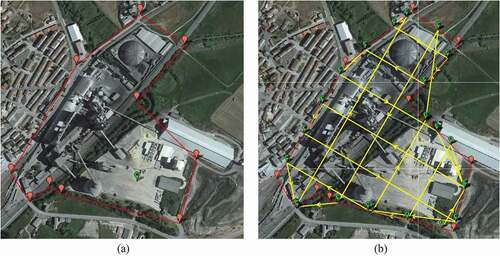
After setting the UAV platform and the RGB and thermal sensors, the main parameters that must be defined for a proper planning are the flight height, the resolution or Ground Sample Distance (GSD), the flight speed, the frontlap and sidelap, and the flight time. Nowadays, many software tools (Mission Planner, Drone Deploy, Desktop and Mobile Flight Planning, Data Pilot Planner, DJI Pilot, etc.) allow adjusting these parameters, according to a previously defined area, to obtain an optimal flight (Koch, Körner, and Fraundorfer Citation2019). Traditional photogrammetry projects usually apply unidirectional passes , while the definition of a second set of passes, which are perpendicular to the initially defined ones, is common when working with UAV platforms . This geometry is aimed at guaranteeing a higher grade of point overlapping, and avoiding the existence of hidden areas (such as the significant gap that can be observed in ), as more images of the element of interest are taken from different angles (Chaudhry, Ahmad, and Gulzar Citation2020).
Figure 1. (a) Unidirectional passes; (b) Double-grid flight.
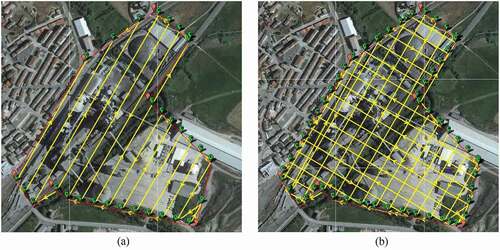
Figure 2. Defect in the model due to the lack of photogrammetric information.
Although there are other works that apply infrared sensors (Kong et al. Citation2019), this research proposes the development of two flights to solve the problems related to the geometric complexity of large industrial facilities:
The first one is an approach flight to obtain an approximated model of the whole plant. A conventional planning (dual grid), designed with any of the software tools that were previously mentioned, is proposed for it. In this case, DJI Pilot was applied.
The second one is a detailed flight on the specific area of the facility to be modelled. In this case, the planning must be developed on the approximated 3D model, which was obtained from the previous flight. It must be taken into account that current software applications are not programmed to work in 3D, which implies having to manually calculate the different parameters of the flight planning, with the traditional expressions. Hence, the distance with respect to the object was calculated to determine the GSD. The distance between images and the separation between passes were also defined to provide a suitable overlap for a proper orientation with the photogrammetric software.
This methodological proposal undoubtedly implies an overstrain in the process of data acquisition, as two non-consecutive flights, the generation of an approximate model, and the manual calculation of the second planning from it, are required. This implies a second visit to the facility, which is fundamental to guarantee a total coverage of the plant itself.
2.3. Proposal for the integration of information
While the generation of RGB 3D models by means of photogrammetric techniques is a widely disseminated procedure, with many software programsspecifically developed for this sort of works, it does not occur for thermal images. Nowadays, there is no known methodology for the management of infrared images that has permeated in a significant way. Several authors have developed studies or works within this line, and present different methodologies for the development of 3D models, although they do not obtain concluding results, and they consider structures or buildings whose modelling is easy (Hoegner et al. Citation2016). Some examples are listed next:
Mapping of thermal images in 3D models (Previtali et al. Citation2014). This methodology is the easiest one, and it implies the generation of a classic geometric 3D model, onto which thermal images are projected as textures later. This type of solution allows 3D perception, but with low quality, as it is not a real 3D model. Therefore, it cannot be considered as a useful and effective solution. Despite its simplicity compared to the rest of alternatives, it has several inconveniences, especially when working with large and complex facilities, such as the ones that are modelled in this research.
Mapping of images onto a 3D point cloud (Daffara et al. Citation2020). This methodology to process thermal 2D images by projecting them over a 3D point cloud has provided very interesting results. The RGB and thermal images are referred by GCPs that must be manually inserted to combine them with a 3D point cloud. The resulting point cloud shows colour variations that are due to the thermal information from the images. The inconvenience is the long processing time, given the manual procedure that is required for referencing. In addition to this, taking both images at the same time is difficult because of several constraints.
Modelling of thermal 2D images (Maset et al. Citation2017). This methodology only proposes processing thermal images to generate point clouds and 3D models. From properly designed flights, the thermal images and their processing are developed with methods for a robust estimation of the plans that comprise the building from the point cloud, by setting a perpendicular restriction (Dino et al. Citation2020).
Some investigations suggest the fusion of clouds of visible and thermal points to generate a high-resolution cloud of thermal points (Dahaghin, Samadzadegan, and Javan Citation2019). To this effect, the camera is calibrated to obtain the parameters for its internal orientation. In the next step, the two point clouds are georeferenced with GCPs, and subsequently, they are filtered to generate the thermal 3D model with the spatial accuracy of the visible point cloud.
Fusion of RGB and thermal images (Yang, Tung-Ching, and Lin Citation2018). This methodological proposal requires both sensors. That is to say, RGB and thermal cameras for the acquisition of frames of the facility with great frontlap. From the images in the visible spectrum and the infrared range, thermal mosaics of four bands are generated (Yang and Lee Citation2019), which will be superimposed by using suitable algorithms, and will allow its subsequent processing for the generation of a 3D model from a thermal point cloud.
Although this last option is not free of problems which are derived from the different scales of temperature in the images (in this regard, capturing the image parallel to the surface, or establishing a range of maximum and minimum temperatures are advisable measures), it is the one that offers the best results by far. In addition to this, it requires simple procedures that are usually included in commercial software programs. In the end, it is no more than the fusion or combination of the data that are provided by the thermal camera with a spatial model (Lewińska and Maciuk Citation2020).
Given the fact that both RGB and thermal images have the same relative position and orientation, they are combined in a single image that comprises spatial and thermographic data. In this regard, provides an example of combination of RGB and thermal images. The image is processed by using the Structure for Motion (SfM) technique. This process of image fusion or combination is similar in most commercial software programs (Pix4D, Metashape, PhotoModeler, etc.). The differences between them lie on the commands, functions or intermediate stages, and the level of interaction between the user and the configuration of the model. It should be also noted that there are techniques to improve the resolution and contrast of thermal 2D images (Raimundo et al. Citation2021), although the steps that are generally required by the software can be schematized as it follows: image dumping, orientation and georeferencing and, finally, generation of the point cloud and texture assignation.
Figure 3. Example of combined RGB and thermal images.
2.4. Model validation
Once the 3D geometric and thermal models have been obtained, it seems coherent to submit them to a validation process. Nowadays, there are several strategies that are not only able to detect and reconstruct models from dense point clouds but also measure the quality of these models in terms of shape and positional accuracy (Truong-Hong and Laefer Citation2015).
In the first instance, the validation of both models is proposed through the comparison of distances observed in the field using topographic methods and instruments, and these same distances measured on the models generated, both RGB and Thermal. The distances applied for comparison must be characterized by being uniformly distributed throughout the models, as well as being arranged in the three spatial components: planimetric, altimetric, and three-dimensional, so as to ensure that distances are contrasted throughout the whole model, and in all components of the three-dimensional space. Finally, it is recommended that the distances have clearly defined start and end points, both in reality and in the models, in order to avoid confusion in the determination of the distances themselves. Depending on the number of distances observed in the field which, as it is obvious, cannot be many due to the effort that this task implies, a statistical treatment of the results can be carried out to obtain the mean, variance and standard deviation or mean squared error, as significant values for the metric contrast.
In second instance, a contrast that allows comparison of both point clouds is proposed for the metric validation of the thermal model. Nowadays, there are many software programs that permit developing this type of analysis, which calculates the minimum distance between each point of the target point cloud (thermal), with respect to the reference point cloud (RGB). The thermal contrast is not considered here, as this issue has been well approached in other works (Zheng et al. Citation2020) and can be considered as solved nowadays. The MCTM is the main object of this research.
2.5. Workflow of this research
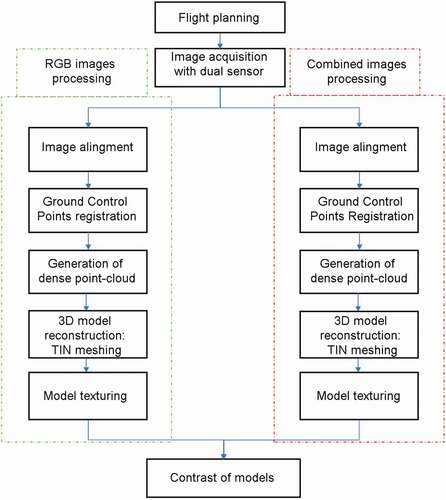
After formalizing the instrumental proposal, which is characterized by being based on the use of low-cost devices, the flight planning must be formalized. In any case, the development of two flights is recommended. The first one will provide an approximate model of the facility, and a second one, with a higher level of detail, will fully define it. Once the images have been acquired, combined and RGB images are processed according to the workflow that is shown in . It considers two itineraries, according to the set of images used for the generation of the model: RGB images only, or their combination with thermal images. This will provide two different models (RGB and thermal) of the same facility.
Figure 4. Workflow.
3. Results
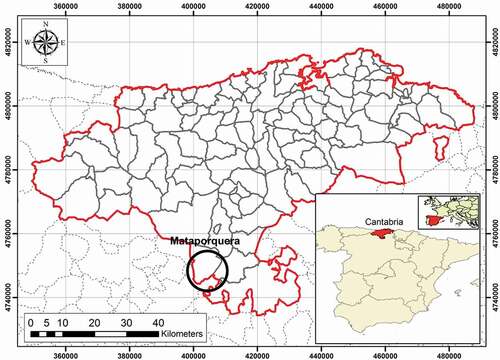
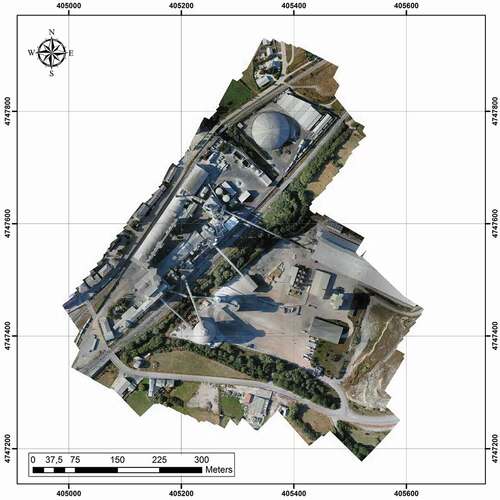
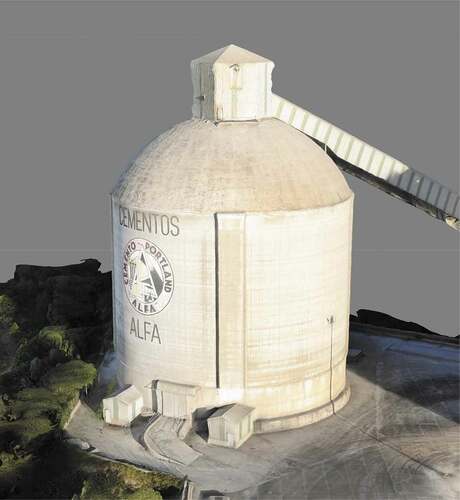
The instrumental and methodological proposal has been tested in a large mining/industrial facility. More specifically, in a cement plant that belongs to Grupo Cementos Portland Valderribas and is located in Mataporquera (Cantabria, Spain. ). As in all cement facilities, there are three main elements in which the temperature is a fundamental parameter, and must be monitored all the time: furnace, chimney and storage silo. This is the reason why it is the ideal facility to be controlled by the application of the techniques that are proposed in this research.
Figure 5. Location of Mataporquera (Cantabria, Spain).
3.1. Approach flight
A first approach flight was planned to capture RGB and thermal information, as described in the section devoted to the methodological proposal. It must be noted that the design of the flight was developed in an automatic way with commercial software. Perpendicular passes were programmed to obtain a relatively acceptable grid. shows the total area to be flown, the direction of the passes and the dimensions of the grid. Since the approach flight is not required to obtain thermal information, only RGB data were acquired.
Figure 6. Planning of the approach flight over the industrial facility. (a) Perimeter; (b) flight.
Given the dimensions of the plant, 16 GCPs were applied to geolocate and scale the geometric 3D model. As the flown area was approximately 13 ha, it implies one GCP for every 0.8 ha. The distribution of the GCPs through the modelled area was designed with the criteria of homogeneity, with perimeter and some central points, in order to minimize the error in the orientation of the model. The coordinates of these points where defined by means of spatial positioning techniques (GPS), according to the UTM-ETRS89 system of reference, which is official in Spain. In addition to this, and given the height of the plant chimneys (97 m), the flight was developed at the maximum limit that is allowed by the Spanish legislation: 120 m. The parameters of the flight are listed in .
Table 2. Representative parameters of the flight design
The RGB images obtained from this first flight were conventionally treated with the process of photograph orientation, dense point cloud and high-quality mesh or model. On this purpose, Metashape Professional version 1.7.2 was applied. The computer that was used had an Intel Core i7 processor, Nvidia570X graphic card and RAM memory of 32 GB. It must be highlighted that, given the low resolution of the images due to the high flight altitude, their treatment was extraordinarily difficult. It implied many problems to identify the GCPs. After solving this obstacle, the process provided the outputs that are traditionally offered by this software, such as more or less dense point clouds (110 million points, ), the solid model (), the wireframe model, orthomosaic (), etc.
Figure 7. (a) Dense point cloud; (b) solid model.
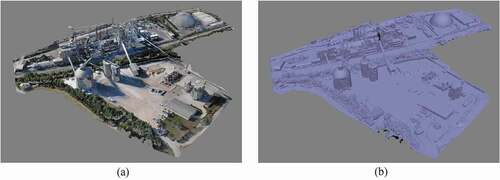
Figure 8. Texturized and shadowed model.
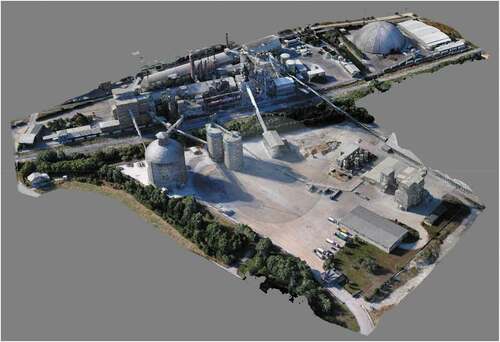
Figure 9. Orthophotography/ orthomosaic of the facility (RGB) .
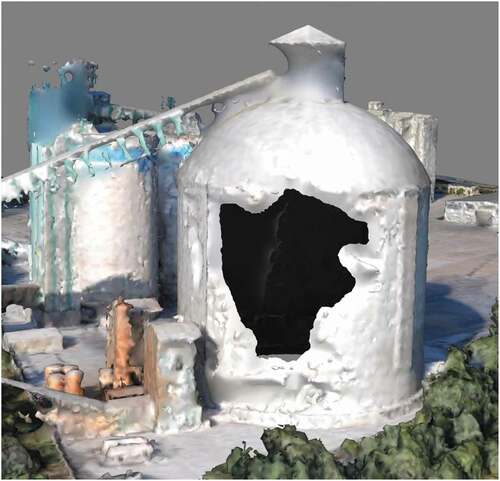
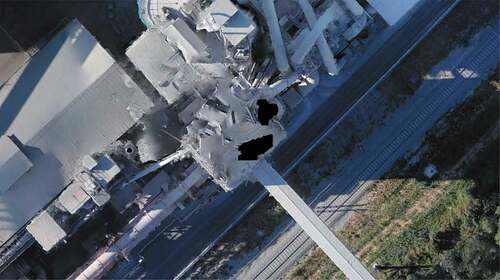
As it was previously justified and it can be seen in these figures, the generated mesh shows gaps and deformations in some areas due to the difficulties found by the software to identify homologous points in areas that were hidden or lacked overlapping. This problem is increased when modelling highly detailed facilities. The worst case was found in the clinker silo (), although the one that is shown in should not be ignored either.
Figure 10. Detail of a non-modelled area.
3.2. Detailed flight
As explained in the methodological proposal, a detailed flight over the clinker silo was scheduled. This was due to three main causes. The first one was to demonstrate that non-covered areas can be solved with detailed flights. The second one was related to the large dimensions of the silo, and the third reason was that, within the silo, clinker is kept. This material can access the silo at a temperature of 160°C and, therefore, the facility must be thermally monitored.
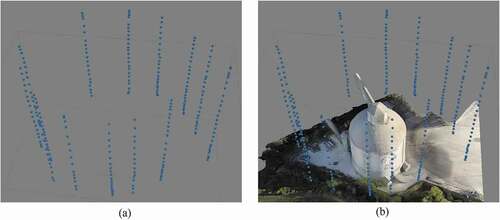
The flight planning manually applied the common expressions for the proposed instrumental (RGB and thermal sensors), and relied on the approximate 3D model. Firstly, a perimeter flight around the clinker silo was done. It comprised a series of downward vertical passes from 108 m to 24 m. Oblique images were taken every 2 m while the drone descended, with a gimbal angle of 45°. As the structure is cylindrical, locating the device at a certain position with respect to the silo is difficult. Due to this, the development of several passes with different positions was sought, in order to estimate a proper overlapping with respect to the previous pass. shows the general parameters of the flight.
Table 3. Representative parameters of the oblique flight
273 images were obtained from this flight, both thermal and RGB. The observation scheme is shown in , which has very little in common with classic photogrammetric flights.
Figure 11. (a) Drone locations when the photographs were taken. (b) Locations with respect to the facility.
A point cloud with approximately 4.5 million points , the detailed 3D model () and all the derived products were obtained as a result of the flight.
Figure 12. (a) Dense cloud; (b) solid model; (c) shadowed model of the silo (RGB).
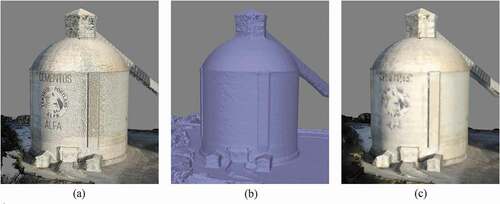
Figure 13. Texturized model of the silo (RGB).
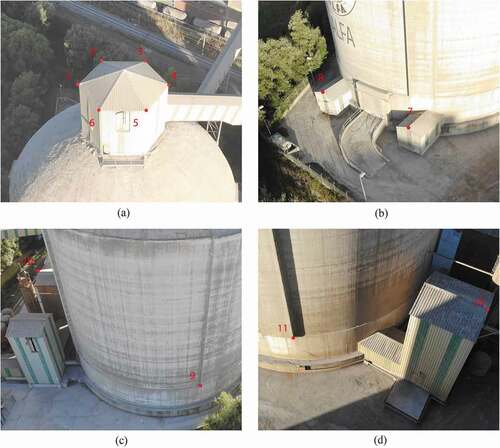
It should be also mentioned that no new GCPs were applied for the attainment of this model. GCPs whose coordinates were obtained from the approximate model were used. This process allows using as many points as required, while avoids having to develop complex topographical observations to obtain their coordinates. In this particular case, 11 points were used (), which represents one point for every 375 m2 of modelled area.
Figure 14. Location of some GCPs on the silo. (a) Points 1 to 6; (b) 7 and 8; (c) 9; (d) Points 10 and 11.
The combined images obtained with the dual sensor were managed in an analogous way to that proposed for the development of the RGB model of the silo. The only difference lies on the higher grade of complexity associated with the identification of homologous rays and the orientation of the thermal images, given their lower resolution. In this case, the point cloud is less dense (1 million points). However, it should be noted that the software was able to orientate the whole set of the implemented images. This was not possible for some of the processed RGB models. The result of this processing is shown in , which includes the dense point cloud, the solid model and the shadowed model and (texturized model of the silo).
Figure 15. (a) Dense Point cloud; (b) solid model; (c) shadowed model of the silo (thermal).
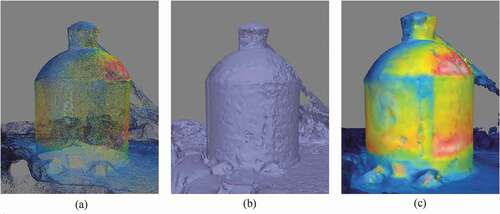
Figure 16. Texturized model of the silo (RGB) .
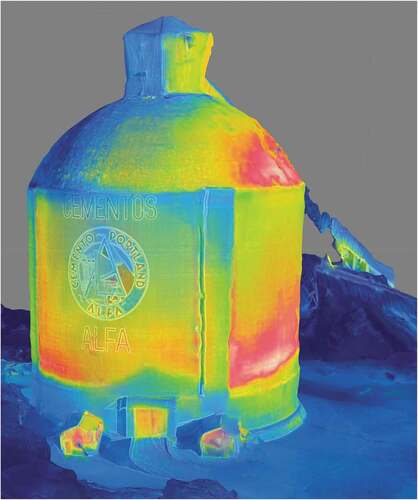
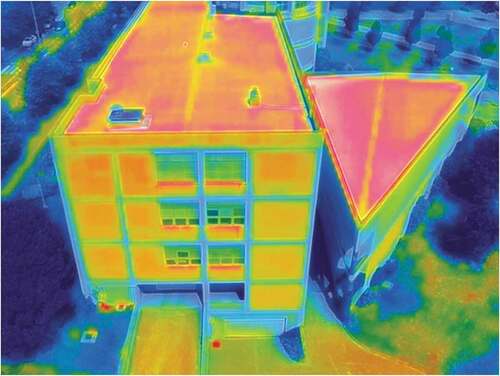
The thermal 3D model of the silo counts with a geometry that is totally identifiable at first sight and permits obtaining further conclusions than these provided by the thermal texture. The red pigmentation is associated with the highest temperatures and, as it is common, they can be found at the top, due to the incidence of the solar radiation. On the other hand, blue represents the areas with lower temperatures. The cylindrical part of the structure is the most interesting. Its top is shown in yellow, and therefore, it is colder than the bottom, which is represented in deep red. This matches with the functional use for which the silo is designed: clinker is introduced at 160°C, and when the photographs were taken, it was filled to 25% of its total capacity.
3.3. Results validation
The Metric Contrast of the Thermal Model (MCTM) alludes to the metric validation of the model generated from combined images in point cloud format. The aim of this contrast is to validate this type of models as useful tools, and to assess that their accuracy is enough for several applications.
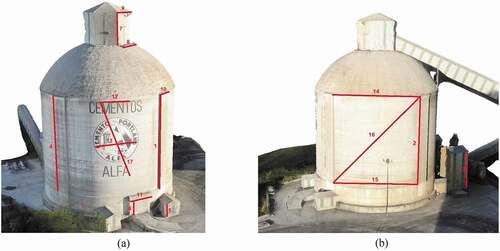
As stated in the methodological proposal, the validation of the models was carried out by comparing a total of 17 distances measured in the field with a Leica TS02 Topographic Station, distributed homogeneously along the structure of the modelled silo. The same distances were measured on the RGB and thermal models generated. shows the distribution of distances throughout the model.
Figure 17. Distances measured for the contrast. (a) Distances 1, 4, 6 to 13 and 17. (b) Distances 2, 3 and 14 to 16.
The results of the observations that were developed both in situ and in the RGB and thermal models are shown in .
Table 4. Results of distance observations
Analysing the results of the observations and by means of simple statistical treatment, it is determined that the average difference between the true magnitude and those measured in the RGB and thermal models are 5 and 31 cm, and their standard deviations are 7 and 29 cm, respectively. This determines the precision of both models, and their corresponding validation in terms of the required accuracies.
Given that the RGB model is more accurate than the thermal one, it now seems coherent to compare the RGB model with the thermal one by means of a mechanism that is statistically more consistent, as formulated in the methodological proposal. The comparison is developed below.
Both models have been compared by means of CloudCompare: The Cloud/Cloud distance comparison tool determines the minimum distance between each point of the thermal cloud with respect to the one obtained from RGB images, which is adopted as reference. Therefore, it allows assessing the coincidence between models. The graphic results of these distances can be seen in .
Figure 18. Results of the comparison between both point clouds.
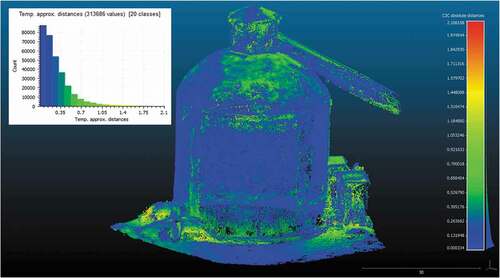
Numerical results () show an average distance between both models of 0.19 m. Most of the points are located at a distance of less than 0.35 m. 75% of the points are below this value. As it can be seen in the histogram that is included in , which includes a histogram to enhance the interpretation of the data, the number of points that are more than 1 m away from the RGB model is minimal (2.096%). Data indicate the existence of points at a distance of 2.17 m. Although this implies a large deviation between both models, they are very specific points, whose deviation may be caused by the sensor itself and, especially, can be due to the fact that those points belong to the surroundings of the silo itself, where the modelling of nature causes this noise. A more detailed point cloud cleaning could possibly have prevented this.
Table 5. Numerical results of the comparison between point clouds
4. Discussion
This work presents a new methodological proposal that permits the generation and the metric contrast of thermal 3D models obtained with sensors mounted on UAV (MCTM). This kind of model allows for inspection, control and maintenance of large industrial facilities, where the classic visual inspection developed by a technician cannot be compared with the performance and results of this new alternative. The MCTM permits validating the metric goodness of the thermal model and, therefore, its use as a suitable tool to dimension with sufficient guarantees any incidence that could be detected in the facility.
The instrumental proposal implies the selection of low-cost built-in sensors on UAV platforms. As the metrics of the obtained models can be improved on the basis of check-points (CPs), expensive metric sensors can be substituted. In addition to this, if the sensors are built-in, they permit optimizing the time of observation, which in the end reduces the costs due to these aspects.
The methodological proposal relies on two main approaches. The first one is focused on the description of a procedure that allows capturing suitable information for the generation of detailed 3D models. This requires the development of a general flight, and a detailed one. The latter must be planned in 3D and there is no specific software for that purpose nowadays. Therefore, the planning must be manually calculated. The second methodological aspect is based on the process of image capturing and management. In this regard, as a result of this research, the combination of RGB and thermal images is presented as the most suitable technique. This requires the application of two sensors, which may even be integrated in a single device, thus providing information that can be processed in a practically automatic way by commercial software, and obtaining RGB and thermal 3D models, along with all the derived outputs, such as point clouds, wireframe mesh, orthomosaics, etc.
In the view of the events that occurred during the development of this research, there are four aspects that must be evaluated to improve future works in this field. The first one refers to the selection of low-cost sensors. Nowadays, there are many manufacturers and models. In this sense, and given that the aim of this research is focused on the geometric control of the thermal models, the works are developed with a very economic sensor that only allows recording qualitative values of the temperature, so that the thermal model is merely descriptive and not quantitative. Quantitative thermal models are more adequate for the thermal modelling of this kind of facilities. Despite the deep review that has been developed, the evolution of the instrumental can change their capabilities.
The second one is related to the dependence on the software or informatic tools that are applied. This is a factor that can have large variability, although the behaviour of all these software programs is almost the same. They can be considered as actual ‘black boxes,’ which are limited to the generation of final outputs, lacking partial or intermediate results.
The third factor is related to the meteorological conditions during the acquisition of the images. As it is obvious, adverse climatic conditions (rain, strong winds, etc.) impede flying, but the moment of the flight must be chosen so that the solar radiation and its potential affection allow for the contrast of that which is to be modelled. This requires an analysis that permits setting the theoretical conditions for an optimal flight and wait for them to occur, but this stand-by is not always feasible. In that case, algorithms that allow estimating and correcting the solar radiation according to the place and time of the flight can be applied. For this work, the flight was developed early in the morning, so that the pollution due to solar radiation was minimal.
Finally, and fourthly, the superposition of point clouds allows obtaining results regarding the average distance between both point clouds, and the percentage of points that are below a certain value of precision. This justifies the proposal that, like other works of research do (Sabato, Puliti, and Niezrecki Citation2020), seeks accuracy in the generation of 3D virtual representations of an object from thermal images obtained with a low-cost infrared camera, but with a more concrete procedure that is focused on achieving specific results.
5. Conclusions
As a general conclusion, it can be stated that an instrumental and methodological proposal that allows generating and contrasting the metric goodness of thermal 3D models obtained with infrared sensors mounted on UAV platforms is available after this research. These models can be applied for the inspection of large facilities. This implies a new technique that eases processes and reduces economic costs in the development of this type of monitoring. It should be noted that these models allow the attainment of qualitative thermal data and quantitative metric information, which permits dimensioning large structures, and satisfies the aim of this research, as it opens the market of energy auditing to this type of sensors.
Other more specific, and therefore partial conclusions, are listed next:
Considering the instrumental, multirotor UAVs are considered as the most suitable platform to capture data for the generation of thermal 3D models nowadays. Regarding sensors, the use of low-cost dual sensors (RGB and thermal) is recommended, as they optimize the flight (a single flight provides the two types of information). In addition to this, a good photogrammetric support provides good geolocations and escalations, which positions them as an economically competitive alternative.
Plant modelling requires 3D flight planning, which must be developed with an approximate model. Given the current lack of commercial software, or an initial absence of the approximate 3D information of the facility itself for a proper design, this research proposes the development of a previous general flight to obtain an approximate model to apply for an adequate flight planning.
Days with meteorological conditions that allow flying (without rain, with moderate winds, etc.) should be selected. Temperature contrast must be sought, but extreme values that saturate thermal images should be avoided.
The methodology proposed for the generation of models from thermal images implies the fusion of the later with RGB images. Both thermal and RGB images have the same position and relative orientation, which allows joining spatial and thermographic data. The image is processed by applying the Structure for Motion (SfM) technique, which is usually implemented in most commercial software programs. This proposal is undoubtedly the one that offers better results.
Considering the results of this research, the average difference between the true distance and those measured in the RGB and thermal models are 5 and 31 cm, with standard deviations of 7 and 29 cm. In addition to the foregoing, it can be stated that low-cost sensors are able to reach average distances between RGB and thermal models of 0.19 m, and 75% of the points are less than 0.35 m apart.
Ultimately, the proposal that results from this research allows the generation of thermal 3D models with low-cost sensors and the adequate methodology. These models are suitable for the performance of tasks involving structural inspection of buildings where certain thermal affection can alter the proper functioning of the facility.
Acknowledgements
The authors wish to express their gratitude to the Enterprise Cementos Alfa, S.A., which is part of Grupo Cementos Portland Valderribas, for providing access to the facilities for the development of this research, and to ACCISA, S.A. and the Department of Innovation, Industry, Transports and Commerce of the Government of the Autonomous Community Cantabria for supporting this work.
Disclosure statement
No potential conflict of interest was reported by the author(s).
Data availability statement
The data presented in this study are openly available in the repository of the University of Cantabria, at: https://disco.unican.es/public/?file=52d20cf8. The following password is required: drone.
Additional information
Funding
References
- Abolt, C., T. Caldwell, B. Wolaver, and H. Pai. 2018. “Unmanned Aerial Vehicle-Based Monitoring of Groundwater Inputs to Surface Waters Using an Economical Thermal Infrared Camera.” Optical Engineering 57 (5): 053113. doi:https://doi.org/10.1117/1.OE.57.5.053113.
- Alba, M. I., L. Barazzetti, M. Scaioni, E. Rosina, and M. Mattia Previtali. 2011. “Mapping Infrared Data on Terrestrial Laser Scanning 3D Models of Buildings.” Remote Sensing 3 (9): 1847–1870. doi:https://doi.org/10.3390/rs3091847.
- Ali, R., J. Zeng, M. Kavgic, and Y.-J. Cha. 2020. “Heat Loss Detection Using Thermal Imaging by a Small UAV Prototype.” In Smart Cities and Energy Systems, Proceedings of SPIE Smart Structures and Nondestructive Evaluation, edited by K. Gath, and N. G. Meyendorf, 9. Bellingham: International Society for Optical Engineering . doi:https://doi.org/10.1117/12.2557902.
- Antón, D., and A.-M. José-Lázaro. 2021. “Engineering Graphics for Thermal Assessment: 3D Thermal Data Visualisation Based on Infrared Thermography, GIS and 3D Point Cloud Processing Software.” Symmetry 13 (2): 335. doi:https://doi.org/10.3390/sym13020335.
- Aragon, B., K. Johansen, S. Parkes, Y. Malbeteau, S. Al‐Mashharawi, C. F. Talal Al‐Amoudi, D. T. Andrade, A. Lucieer, M. F. McCabe, and M. F. McCabe. 2020. “A Calibration Procedure for Field and UAV‐Based Uncooled Thermal Infrared Instruments.” Sensors 20 (11): 3316. doi:https://doi.org/10.3390/s20113316.
- Biscarini, C., I. Catapano, N. Cavalagli, G. Ludeno, F. A. Pepe, and F. Filippo Ubertini. 2020. “UAV Photogrammetry, Infrared Thermography and GPR for Enhancing Structural and Material Degradation Evaluation of the Roman Masonry Bridge of Ponte Lucano in Italy.” NDT&E International 115: 102287. doi:https://doi.org/10.1016/j.ndteint.2020.102287.
- Blistan, P., Ľ. Kovanič, M. Patera, and H. Tomáš. 2019. “Evaluation Quality Parameters of DEM Generated with Low-Cost UAS Photogrammetry and Structure-from-Motion (Sfm) Approach for Topographic Surveying of Small Areas.” Acta Montanistica Slovaca 24 (3): 198–212.
- Campione, I., F. Lucchi, N. Santopuoli, and L. Seccia. 2020. “3D Thermal Imaging System with Decoupled Acquisition for Industrial and Cultural Heritage Applications.” Applied Sciences 10 (3): 828. doi:https://doi.org/10.3390/app10030828.
- Chaudhry, M. H., A. Ahmad, and Q. Gulzar. 2020. “Impact of UAV Surveying Parameters on Mixed Urban Landuse Surface Modelling.” ISPRS International Journal of Geo-Information 9 (11): 656. doi:https://doi.org/10.3390/ijgi9110656.
- Crusiol, T., L. Guilherme, M. R. Nanni, R. H. Furlanetto, and E. Cezar. 2020. “Reflectance Calibration of UAV-based Visible and Near-infrared Digital Images Acquired under Variant Altitude and Illumination Conditions.” Remote Sensing Applications: Society and Environment 18: 100312. doi:https://doi.org/10.1016/j.rsase.2020.100312.
- Daffara, C., R. Muradore, N. Piccinelli, N. Gaburro, T. de Rubeis, and D. Ambrosini. 2020. “A Cost-Effective System for Aerial 3D Thermography of Buildings.” Journal of Imaging 6 (8): 76. doi:https://doi.org/10.3390/JIMAGING6080076.
- Dahaghin, M., F. Samadzadegan, and F. D. Javan. 2019. ““3D Thermal Mapping of Building Roofs Based on Fusion of Thermal and Visible Point Clouds in UAV Imagery.” International Archives of Photogrammetry, Remote Sensing and Spatial Information Sciences – ISPRS Archives 42 (4–W18): 241–246. doi:https://doi.org/10.5194/isprs-archives-XLII-4-W18-271-2019.
- de Luis-Ruiz, J.M. , J. Sedano-Cibrián, R. Pereda-García, R. Pérez-Álvarez, and Malagón-Picón, B. 2020. “Optimization of Photogrammetric Flights with UAVs for the Metric Virtualization of Archaeological Sites. Application to Juliobriga (Cantabria, Spain).” Applied Sciences 11 (3): 1204. doi:https://doi.org/10.3390/app11031204.
- Dino, I. G., A. E. Sari, O. K. Iseri, S. Akin, E. Kalfaoglu, B. Erdogan, S. Kalkan, and A. A. Alatan. 2020. “Image-Based Construction of Building Energy Models Using Computer Vision.” Automation in Construction 116: 103231. doi:https://doi.org/10.1016/j.autcon.2020.103231.
- Fryskowska, A., M. Kedzierski, A. Grochala, and A. Braula. 2016. “Calibration of Low Cost RGB and NIR UAV Cameras.” International Archives of Photogrammetry, Remote Sensing and Spatial Information Sciences – ISPRS Archives 41 (B1): 817–821. doi:https://doi.org/10.5194/isprsarchives-XLI-B1-817-2016.
- Gašparovic, M., and D. Gajski. 2016. “Two-Step Camera Calibration Method Developed for Micro UAV’s.” International Archives of Photogrammetry, Remote Sensing and Spatial Information Sciences – ISPRS Archives 41 (B1): 829–833. doi:https://doi.org/10.5194/isprsarchives-XLI-B1-829-2016.
- Greenwood, W. W., J. P. Lynch, and D. Zekkos. 2019. “Applications of UAVs in Civil Infrastructure.” Journal of Infrastructure Systems 25 (2): 04019002. doi:https://doi.org/10.1061/(asce)is.1943-555x.0000464.
- Hoegner, L., S. Tuttas, X. Yusheng, Y. Konrad Eder, and U. Stilla. 2016. “Evaluation of Methods for Coregistration and Fusion of RPAS-Based 3D Point Clouds and Thermal Infrared Images.” International Archives of Photogrammetry, Remote Sensing and Spatial Information Sciences – ISPRS Archives 41 (B3): 241–246. doi:https://doi.org/10.5194/isprs-archives-XLI-B3-241-2016.
- Kapogiannis, G., M. Gaterell, and E. Oulasoglou. 2015. “Identifying Uncertainties toward Sustainable Projects.” Procedia Engineering 118: 1977–1085. doi:https://doi.org/10.1016/j.proeng.2015.08.551.
- Knyaz, V. A., and P. V. Moshkantsev. 2019. “Joint Geometric Calibration of Color and Thermal Cameras for Synchronized Multimodal Dataset Creating.” International Archives of Photogrammetry, Remote Sensing and Spatial Information Sciences – ISPRS Archives 42 (2/W18): 79–84. doi:https://doi.org/10.5194/isprs-archives-XLII-2-W18-79-2019.
- Koch, T., M. Körner, and F. Fraundorfer. 2019. “Automatic and Semantically-Aware 3D UAV Flight Planning for Image-Based 3D Reconstruction.” Remote Sensing 11 (13): 1–29. doi:https://doi.org/10.3390/rs11131550.
- Kong, X., X. Zhipeng, S. Wei, S. Ding, L. Chen, Q. Yang, and W. Yan. 2019. “Infrared Vision Based Automatic Navigation and Inspection Strategy for Photovoltaic Power Plant Using UAVs.”. In Proceedings of the 31st Chinese Control and Decision Conference, Danvers: Instituteof Electrical and Electronics Engineers. 347–352. doi: https://doi.org/10.1109/CCDC.2019.8832673.
- Lewińska, P., and K. Maciuk. 2020. “Thermal and Spatial Data Integration for Recreating Rebuilding Stages of Wooden and Masonry Buildings.” The Photogrammetric Record 35 (171): 402–425. doi:https://doi.org/10.1111/phor.12332.
- Maset, E., A. Fusiello, F. Fabio Crisolla, R. Toldo, and D. Zorzetto. 2017. “Photogrammetric 3D Building Reconstruction from Thermal Images.” ISPRS Annals of the Photogrammetry, Remote Sensing and Spatial Information Sciences 4 (2W3): 25–32. doi:https://doi.org/10.5194/isprs-annals-IV-2-W3-25-2017.
- Mizginov, V. A., and V. V. Kniaz. 2019. “Evaluating the Accuracy of 3D Object Reconstruction from Thermal Images.” International Archives of Photogrammetry, Remote Sensing and Spatial Information Sciences – ISPRS Archives 42 (2/W18): 129–134. doi:https://doi.org/10.5194/isprs-archives-XLII-2-W18-129-2019.
- Park, S. W., S. K. Choi, J. W. Choi, and S. K. Lee. 2018. “Accuracy Assessment of Sharpening Algorithms of Thermal Infrared Image Based on UAV.” Journal of the Korean Society of Surveying, Geodesy, Photogrammetry and Cartography 36 (6): 555–564. doi:https://doi.org/10.7848/ksgpc.2018.36.6.555.
- Pérez-García, J. L., M. Sánchez-Gómez, J. M. Gómez-López, T. Guerra, D. Gil, and T. Fernández. 2018. “Georeferenced Thermal Infrared Images from UAV Surveys as a Potential Tool to Detect and Characterize Shallow Cave Ducts.” Engineering Geology 246: 277–287. doi:https://doi.org/10.1016/j.enggeo.2018.09.014.
- Previtali, M., L. Barazzetti, R. Brumana, B. Cuca, D. Oreni, F. Roncoroni, and M. Scaioni. 2014. “Automatic Façade Modelling Using Point Cloud Data for Energy Efficient Retrofitting.” Applied Geomatics 6 (2): 95–113. doi:https://doi.org/10.1007/s12518-014-0129-9.
- Raimundo, J., S. L.-C. Medina, J. F. Prieto, and J. A. de Mata. 2021. “Super Resolution Infrared Thermal Imaging Using Pansharpening Algorithms: Quantitative Assessment and Application to UAV Thermal Imaging.” Sensors 21 (4): 1265. doi:https://doi.org/10.3390/s21041265.
- Rakha, T., and A. Gorodetsky. 2018. “Review of Unmanned Aerial System (UAS) Applications in the Built Environment: Towards Automated Building Inspection Procedures Using Drones.” Automation in Construction 93: 252–264. doi:https://doi.org/10.1016/j.autcon.2018.05.002.
- Sabato, A., M. Puliti, and C. Niezrecki. 2020. “Combined Infrared Imaging and Structure from Motion Approach for Building Thermal Energy Efficiency and Damage Assessment”. In Proceedings of SPIE Smart Structures and Nondestructive Evaluation 2020, edited by K. Gath and N. G. Meyendorf. Bellingham: International Society for Optical Engineering. doi: https://doi.org/10.1117/12.2558796
- Shahmoradi, J., E. Talebi, P. Roghanchi, and M. Hassanalian. 2020. “A Comprehensive Review of Applications of Drone Technology in the Mining Industry.” Drones 4 (3): 34. doi:https://doi.org/10.3390/drones4030034.
- Shao, Z., L. Yizhou, R. Deng, D. Wang, and X. Zhong. 2021. “Three-dimensional-imaging Thermal Surfaces of Coal Fires Based on UAV Thermal Infrared Data.” International Journal of Remote Sensing 42 (2): 672–692. doi:https://doi.org/10.1080/01431161.2020.1823044.
- Trefilov, P., M. Mamchenko, M. Romanova, and I. Ischuk. 2021. “Improving Methods of Objects Detection Using Infrared Sensors Onboard the UAV.” Smart Innovation, Systems and Technologie 187: 105–114. doi:https://doi.org/10.1007/978-981-15-5580-0_8.
- Truong-Hong, L., and D. F. Laefer. 2015. “Quantitative Evaluation Strategies for Urban Model Generation from Remote Sensing Data.” Computers & Graphics 49: 82–91. doi:https://doi.org/10.1016/j.cag.2015.03.001.
- Turner, R. M., M. M. MacLaughlin, and S. R. Iverson. 2020. “Identifying and Mapping Potentially Adverse Discontinuities in Underground Excavations Using Thermal and Multispectral UAV Imagery.” Engineering Geology 266: 105470. doi:https://doi.org/10.1016/j.enggeo.2019.105470.
- Vladimir, K. 2019. “Multimodal Data Fusion for Object Recognition.” In Multimodal Sensing: Technologies and Applications, Proceedings of SPIE Optical Metrology, edited by S. Ettore, 6. Bellingham: International Society for Optical Engineering . doi:https://doi.org/10.1117/12.2526067.
- Wakeford, Z. E., M. J. Magda Chmielewska, J. A. H. Hole, D. A. Jerram, and D. A. Jerram. 2019. “Combining Thermal Imaging with Photogrammetry of an Active Volcano Using UAV: An Example from Stromboli, Italy.” The Photogrammetric Record 34 (168): 445–466. doi:https://doi.org/10.1111/phor.12301.
- Wang, Z., and J. Liu. 2020. “A Seven-Dimensional Building Information Model for the Improvement of Construction Efficiency.” Advances in Civil Engineering ID: 8842475. doi:https://doi.org/10.1155/2020/8842475.
- Yang, M.-D., S. Tung-Ching, and H.-Y. Lin. 2018. “Fusion of Infrared Thermal Image and Visible Image for 3D Thermal Model Reconstruction Using Smartphone Sensors.” Sensors 18 (7): 2003. doi:https://doi.org/10.3390/s18072003.
- Yang, Y., and X. Lee. 2019. “Four Band Thermal Mosaicking: A New Method to Process Infrared Thermal Imagery of Urban Landscapes from UAV Flights.” Remote Sensing 11 (11): 1365. doi:https://doi.org/10.3390/rs11111365.
- Zefri, Y., A. Elkettani, I. Sebari, and S. A. Lamallam. 2018. “Thermal Infrared and Visual Inspection of Photovoltaic Installations by UAV Photogrammetry—Application Case: Morocco.” Drones 2 (4): 41. doi:https://doi.org/10.3390/drones2040041.
- Zhang, Q., S. Jian-jing, and S. Meng-qing. 2016. “The Outdoor Rapid Calibration Technique and Realization of Nonmetric Digital Camera Based on the Method of Multi-image DLT and Resection.” International Archives of Photogrammetry, Remote Sensing and Spatial Information Sciences – ISPRS Archives 41 (B1): 265–269. doi:https://doi.org/10.5194/isprs-archives-XLI-B1-265-2016.
- Zhao, X., H. Jiang, Y. Luo, N. Huang, and N. Yilan. “Analysis of the Thermal Environment in Pedestrian Space Using 3D Thermography Generated with Unmanned Aerial Vehicles and Infrared Cameras. In IGARSS 2019.” Proceedings of the IEEE International Geoscience and Remote Sensing Symposium, Yokohama, Japan, July 28 2 August 2019. 4328–4331. doi: https://doi.org/10.1109/IGARSS.2019.8898994.
- Zheng, H., X. Zhong, J. Yan, L. Zhao, and X. Wang. 2020. “A Thermal Performance Detection Method for Building Envelope Based on 3D Model Generated by UAV Thermal Imagery.” Energies 13 (24): 6677. doi:https://doi.org/10.3390/en13246677.