
 ?Mathematical formulae have been encoded as MathML and are displayed in this HTML version using MathJax in order to improve their display. Uncheck the box to turn MathJax off. This feature requires Javascript. Click on a formula to zoom.
ABSTRACT
As climate change and oceanic warming have an increasing impact on coastal waves, accurate observation of satellite significant wave height (SWH) in coastal regions is becoming more important. In addition to the validation of satellite SWHs in the global ocean, the SWHs should also be validated in coastal regions for their diverse applications. In this study, the accuracy and error characteristics of altimeter SWH data, Jason-3 Geophysical Data Records Version D and Sentinel-3A/B Level-2 marine scientific products, were investigated using SWH measurements from 18 buoy stations in the coastal region of the Korean Peninsula from 2017 to 2019. Results showed that the Jason-3 and Sentinel-3A/B SWHs exhibited root mean square errors (RMSE) and bias errors of 0.59–1.60 m and 0.03–0.42 m, respectively. Cross-validation between Jason-3 and Sentinel-3A/B exhibited a consistency comparable to that of the global ocean. The spatial distribution of comparison between altimeter SWH and wave model data was similar to that obtained using altimeter SWH and in situ measurements. Validation of altimeter SWH from the buoy stations yielded the highest error in the southwestern coastal region of the Korean Peninsula, with high tidal currents in the Yellow Sea. The stronger the tidal current speed, the more amplified the satellite SWH errors. The SWH differences exhibited a high dependence on the tidal index, including the elements of tidal current speed, water depth, and tide height. A relationship was found between the tidal index and the altimeter SWH differences from the in situ measurements. Based on this relation, formulas were proposed to reduce satellite SWH errors due to tidal currents in the coastal regions of the Korean Peninsula. For the matchups with tidal index less than 2, RMSE and bias errors of each satellite sensor were improved by up to 14.25% (0.28 m) and 94.40% (0.84 m), respectively.
1. Introduction
Observation of physical ocean variables, such as sea surface temperature, salinity, sea level, and wave height, is very important for obtaining information regarding port construction, operational safety, and fisheries; and understanding the mechanisms of environment variability in the coastal region. In particular, significant wave height (SWH) is important in maritime fields, such as shipping, offshore operation, and coastal protection (Flather Citation2000; Narayan et al. Citation2016). The SWH is also involved in air–sea interactions and vertical mixing of the ocean surface layer (Jiang, Street and Klotz Citation1990; Babanin Citation2006; Dai et al. Citation2010; Huang and Qiao Citation2010; Pleskachevsky et al. Citation2011). In the coastal region, oceanic phenomena have shorter temporal scales and smaller spatial scales than those in the open ocean due to shallow water depth, complex coastline, and river discharge (Durand et al. Citation2019). In addition, the ocean waves originating from far-offshore regions have propagated towards the coastal region and affected the coastal environment. Although the SWH varied diversely in the local and regional areas, an increasing trend has been observed in extreme SWH over the past three decades (Young, Zieger and Babanin Citation2011). In the Northwest Pacific, SWH exhibited a distinct tendency to increase in coastal regions (Woo and Park Citation2017). Therefore, the need for SWH observations and their validation in coastal regions should be emphasized.
Satellite SWHs have been observed using instruments such as altimeters, Synthetic Aperture Radar (SAR), and, recently, Surface Waves Investigation and Monitoring (SWIM) (e.g. Ardhuin et al. Citation2019; Hauser et al. Citation2021). In addition to such microwave observations, optical remote sensing imagery has also made it possible to observe ocean waves (Kudryavtsev et al. Citation2017; Ardhuin et al. Citation2019). The altimeter detects the power of a reflected signal after a transmitted signal interacts at the sea level. The SWH is then calculated from the leading edge slope of the altimeter return waveform (Brown Citation1977; Hayne Citation1980). The SAR with high spatial resolution can provide two-dimensional ocean wave spectra to retrieve various wave parameters including SWH. Wave parameters from the SAR image were retrieved by estimating a two-dimensional wave spectrum or applying an empirical method (Chapron, Johnsen and Garello Citation2001; Schulz-Stellenfleth, Konig and Lehner Citation2007; Pleskachevsky et al. Citation2019).
Since the launch of the Geodetic Satellite (GEOSAT) in 1985, SWHs have been almost continuously observed using satellite altimeters for more than 30 years. During the recent decade, several satellite altimeters were launched: Joint Altimetry Satellite Oceanography Network-3 (Jason-3) in 2016 (Picot et al. Citation2018), Sentinel-3A and Sentinel-3B in 2016 and 2018 (Donlon et al. Citation2012), Cryosat-2 in 2010 (Wingham et al. Citation2006), Satellite with Argos and Altika (SARAL) in 2013 (Verron et al. Citation2015), and Haiyang (HY)-2A and HY-2B in 2011 and 2018, respectively (Jiang, Lin and Wei Citation2019). Altimeter SWHs have been consistently verified through in situ measurements from moored buoys in the global ocean and have yielded an accuracy of approximately 0.3 m (Ray and Beckley Citation2003; Queffeulou Citation2004; Durrant, Greenslade and Simmonds Citation2009; Zieger, Vinoth and Young Citation2009; Abdalla, Janssen and Bidlot Citation2010; Sepulveda, Queffeulou and Ardhuin Citation2015; Abdalla et al. Citation2018; Yang and Zhang Citation2019; Wan et al. Citation2020; Yang et al. Citation2020).
In addition, validation studies on the altimeter SWHs in regional seas have been conducted (Ebuchi and Kawamura Citation1994; Gower Citation1996; Hwang et al. Citation1998; Kumar et al. Citation2015; Kong et al. Citation2016; Kudryavtseva and Soomere Citation2016; Nencioli and Quartly Citation2019). The SWHs observed using the Topex/Poseidon altimeter showed a bias of approximately 0.3 m and a root-mean-square error (RMSE) of approximately 0.5 m following the in situ measurements obtained at buoy stations of the Japan Meteorological Agency (JMA) in the Northwest Pacific and its marginal sea (Ebuchi and Kawamura Citation1994). The SWH data from the Topex/Poseidon altimeter were also validated using moored buoys in the eastern Pacific Ocean and the Gulf of Mexico. The RMSE of Topex/Poseidon-observed SWH was approximately 0.3 m in the eastern Pacific Ocean (Gower Citation1996) and approximately 0.2 m in the Gulf of Mexico (Hwang et al. Citation1998). The SWH values of SARAL/AltiKa showed more accurate results with a bias of 0.02 m and an RMSE of 0.15 m using the measurement data of buoy stations in the North Indian Ocean from March 2013 to March 2015 (Kumar et al. Citation2015). Multi-mission altimeter SWH data were validated in the offshore areas of China and the Baltic Sea (Kong et al. Citation2016; Kudryavtseva and Soomere Citation2016). The SWH data of the nine satellite altimeter missions from 1991 to 2014 showed an RMSE of approximately 0.3 m in the offshore area of the Yellow Sea and the East China Sea (Kong et al. Citation2016), and the SWH data of 9 satellites observed from 1985 to 2015 showed RMS differences of 0.23–0.37 m in the Baltic Sea (Kudryavtseva and Soomere Citation2016). In the coastal region of southwest England, the RMSE of Sentinel-3A was 0.46 ± 0.14 m in Synthetic Aperture Radar (SAR) mode and 0.84 ± 0.45 m in the Pseudo Low Resolution Mode (PLRM) (Nencioli and Quartly Citation2019). Detailed information is given in .
Table 1. Accuracy of the altimeter significant wave height (SWH) for the in situ measurements in previous studies
As Jason-3 and Sentinel-3A/B have been recently launched to observe sea level, SWH, and wind speed, it is necessary to assess the accuracy and error characteristics of SWHs in regional seas as well as in the global ocean. As shown in , the coastal area of the Korean Peninsula has a relatively monotonous coastline of the East/Japan Sea (EJS hereafter), and a complicated coastline and many small islands in the Yellow Sea and southern region of the Korean Peninsula. The average depth of the EJS is more than 1000 m, while the average depth of the Yellow Sea is less than 100 m (Choi, Kim and Eum Citation2002; Chang et al. Citation2004). In particular, the Yellow Sea has exceptionally high tidal range and strong tidal current (Choi Citation1980). Therefore, these different characteristics of the seas around the Korean Peninsula may result in different error characteristics of the satellite SWHs (You Citation2009). The SWH in this region exhibits seasonal variability due to the influence of strong northwesterly winds in the winter and weak southeasterly winds in the summer (). A notable SWH feature is observed in the winter when the swell-like SWH occurs on the eastern coast of the Korean Peninsula due to high wind speeds from the continental side. Extratropical storms, which developed strongly in the Asian continent near the Korean Peninsula, generated high sea waves on the east coast of the Korean Peninsula (Goda and An Citation1973; Jeong, Oh and Lee Citation2007; Oh et al. Citation2010). Although the climatological mean of SWHs is relatively low, approximately ≤1.5 m, in the summer, SWHs higher than 5 m have sometimes been observed in the summer season due to the influence of typhoons. Therefore, satellite altimeters may play an important role in SWH observation in the seas around the Korean Peninsula. The extensive use of satellite-derived SWHs in coastal regions necessitates the validation of satellite data and investigation of their error characteristics. As shown in , there are many buoy stations along the coastlines of the Korean Peninsula. Therefore, it is possible to assess the altimeter SWH using sufficient in situ measurements from the coastal region. An evaluation of Sentinel-3A SWH in the coastal region was performed in a previous study (Nencioli and Quartly Citation2019), but in the coastal region around the Korean Peninsula, such studies on Sentinel-3A/B and Jason-3 have not been performed.
In this study, we focused on assessing the accuracies of the SWH data of Jason-3 and Sentinel-3A/B and understanding the characteristics of the differences between satellite SWHs and in situ measurements in the coastal region of the Korean Peninsula. The procedure towards achieving the research objectives was as follows: 1) a matchup database of the altimeter SWH data and wave height measurements from buoy stations was produced; 2) Jason-3 and Sentinel-3A/B SWHs were compared based on in situ measurements; 3) error characteristics of satellite SWH were analysed; 4) Jason-3 SWH and Sentinel-3A/B SWH in the Northwest Pacific were intercompared; and 5) corrections to improve the accuracy of the satellite SWH in the seas around the Korean Peninsula have were discussed.
Figure 1. (a) Bathymetry (m) and ground tracks of (b) Jason-3, (c) Sentinel-3A, and (d) Sentinel-3B in the seas around the Korean Peninsula. Yellow, green, and purple dots and black text represent the location and symbol of marine meteorological buoy stations of Korea Meteorological Administration.
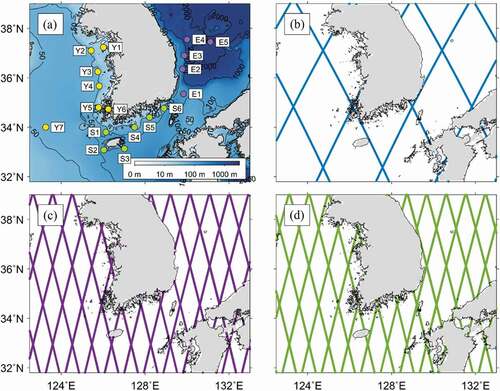
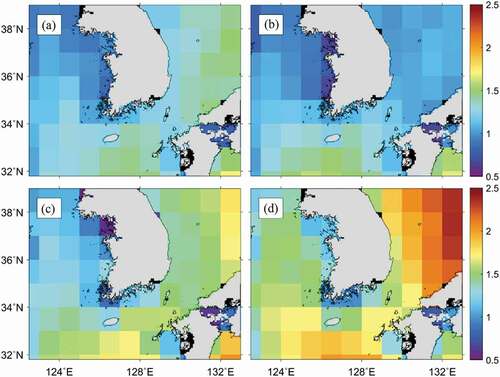
Figure 2. Spatial distribution of significant wave heights (SWHs) (m) in the seas around the Korean Peninsula in (a) spring (March, April, and May), (b) summer (June, July, and August), (c) autumn (September, October, and November), and (d) winter (December, January, and February) using multi-mission monthly gridded satellite altimeter SWH data (1°×1° spatial resolution) from European Space Agency Climate Change Initiative for Sea State project for the period from 1992 to 2018 (Piollé, Dodet and Quilfen Citation2020).
2. Data and methods
2.1. Satellite altimeter data
2.1.1. Jason-3 data
As a follow-on satellite to the Topex/Poseidon (1992–2006), Jason-1 (2001–2013), and Ocean Surface Topography Mission (OSTM)/Jason-2 (2008–2019) missions, Jason-3 was launched on 17 January 2016, through international collaborations among the European Organization for the Exploitation of Meteorological Satellites (EUMETSAT), National Aeronautics and Space Administration (NASA), National Oceanic and Atmospheric Administration (NOAA), and Center National d’Études Spatiales (CNES). The objective of this mission is to monitor the climate and support numerical forecasts by observing the sea surface height, SWH, and wind speed. The Poseidon-3B, the main instrument on the Jason-3, is a dual-frequency (C-band: 5.3 GHz and Ku-band: 13.575 GHz) radar altimeter (). Jason-3 has the same orbit as Topex/Poseidon, Jason-1, and Jason-2, with a repeat period of 9.9156 days and an orbit inclination of 66°. It operates in a high-altitude orbit at 1336 km to reduce atmospheric drag and orbit fluctuations caused by variations in the Earth’s gravitational field or tides. Jason-3 operates in a conventional altimeter pulse-limited mode known as the low-resolution mode (LRM). In this study, Jason-3 Geophysical Data Records Version D (GDR-D) data were used for the period from January 2017 to December 2019, distributed by the Archiving, Validation, and Interpretation of Satellite Oceanographic Data (AVISO; http://ftp-access.aviso.altimetry.fr). The SWHs retracted from Ku-band data of Jason-3 altimeter were quality controlled using ‘quality flag for 1 Hz altimeter data: Ku band SWH’ in the GDR-D database.
Table 2. Information on satellite altimeters Joint Altimetry Satellite Oceanography Network-3 and Sentinel-3A/B, including launch date, band, frequency/bandwidth, acquisition mode, repeat period, altitude, inclination, and agency
2.1.2. Sentinel-3A/B data
Sentinel-3A and Sentinel-3B, launched on 16 February 2016, and 25 April 2018, respectively, have a near-polar and sun-synchronous orbit with an altitude of 814.5 km, an inclination of 98.65°, and a 27-d repeat period (). Among the instruments mounted on Sentinel-3A/B, the SAR altimeter (SRAL) can monitor SWH in addition to surface height and wind speed. The SRAL is a delay-Doppler altimeter, which uses the same technique as the SAR imager, but utilizes the Doppler effect in the along-track direction. Therefore, the spatial resolution in the along-track direction is improved to about 300 m, which is a higher resolution than traditional altimeters. In addition, the signal-to-noise ratio was improved by multi-look processing. These improvements enable more accurate measurements in coastal regions, sea-ice areas, and inland waters (Raney Citation1998; EUMETSAT Citation2017). The SRAL instrument can operate in two measurement modes: SAR mode and PLRM. The SAR mode using delay-Doppler processing is the default mode. In PLRM mode, the Doppler effect is neglected, and the power of all pulses is averaged. The continuity of the previous dataset can be maintained by processing similar to that used with traditional altimeters (EUMETSAT Citation2017). Although Cryosat-2 is the first satellite to carry the SAR altimeter, it has been observed only in the cryosphere, coastal regions, and selected oceanic regions and lakes in the SAR mode. However, Sentinel-3 SRAL operates across the entire ocean in the SAR mode. To compare the SWH between the SAR mode and PLRM in the coastal region of the Korean Peninsula, Level-2 marine scientific products (SR_2_WAT) from 2017 to 2019, obtained from the EUMETSAT Data Center (https://www.eumetsat.int/eumetsat-data-centre), were used in this study. The SWH data were retrieved using SAR Altimetry Mode Studies and Applications (SAMOSA) model (Ray et al. Citation2015). The Sentinel-3A/B SWH data in the SAR mode and the PLRM were quality controlled by selecting processes as ‘quality flag for the ocean significant wave height: 1 Hz Ku band’ and ‘quality flag for the ocean significant wave height: 1 Hz Plrm Ku band’ in the Level-2 marine scientific products, respectively (ACRI-ST IPF Team Citation2017).
2.2. In situ measurements
To validate the altimeter SWH data in the coastal region of the Korean Peninsula, in situ SWH measurements from marine meteorological buoy stations operated by the Korea Meteorological Administration (KMA) were used, as shown in . A total of 23 buoys were in operation at the time; however, 18 buoys were selected by considering the study period from 2017 to 2019. The number of buoy stations for the validation of SWH data was seven in the Yellow Sea (Y1–Y7), six in the southern region (S1–S6), and five in the EJS (E1–E5). The water depths where buoys are located range from a minimum of 25 m (Sinan; Y6) to a maximum of 2,200 m (Ulleungdo; E5). The Sinan buoy (Y6) is located closest to the coastline (1.52 km), while the Seohae206 buoy (Y7) is located farthest from the land by 168.90 km. The buoy stations of the KMA have observed various atmospheric and oceanic variables, such as wave parameters (wave height, wave direction, and wave period), water temperature, wind speed, wind direction, air pressure, humidity, and air temperature. In this study, SWH measurements at 1-h intervals were used to evaluate the accuracy of the altimeter SWH data. In situ SWH measurements were calculated by spectral analysis of 1,024 sampling data measured at 1-s intervals for 17 min and 4 s. For SWH, the measurement range is 0–15 m, precision is 0.1 m, and the uncertainty of the measurement is within 0.5 m or 10% (https://www.kma.go.kr/kma/). Details of the buoy stations are presented in .
Table 3. Information on buoy stations of the Korea Meteorological Administration including symbol, buoy id, station name, latitude, longitude, water depth, and distance from the coast
2.3. Wave model data
To compare the altimeter SWH data with wave model data in the seas around the Korean Peninsula, the numerical model data of the operational global ocean analysis and forecast system of Météo-France, based on the wave model Météo-France (MFWAM), were selected (Ardhuin et al. Citation2010). The MFWAM is a third-generation wave model and uses a new dissipation term developed by Ardhuin et al. (Citation2010). The spatial and temporal resolution of the model were 0.083° × 0.083° and 3 h, respectively. Altimeter SWH data have been assimilated into the wave model. For the comparison, data for the period of January 2019 to December 2019 were obtained from the Copernicus Marine Service (https://resources.marine.copernicus.eu/).
2.4. Matchup procedure
A matchup procedure was performed to compare the in situ measurements with the satellite SWH data of Jason-3 and Sentinel-3A/B. Since the spatial limit and temporal interval in the matchup procedure are 50 km and 30 min, respectively, the multiple points of the altimeter track can be collocated for each buoy station. In previous studies, the matchup database was constructed by taking the mean value of the altimeter SWHs (Gower Citation1996; Queffeulou Citation2004; Zieger, Vinoth and Young Citation2009), or the altimeter SWH data at the nearest point from the buoy station (Nencioli and Quartly Citation2019; Yang, Zhang and Wang Citation2019; Wang et al. Citation2020), as the representative value of the altimeter SWH data. In this study, the latter method was used to maintain the characteristics of satellite-observed data. This dataset includes the matchups within a 25 km spatial limit. We also focused on the effect of the matchup distance on altimeter SWH errors. Therefore, all collocated data on satellite SWHs were selected for a pixel satisfying the spatial limit of 50 km and temporal interval within 30 min.
To compare the SWH observed by satellite altimeters in the open ocean, cross-validations between Jason-3 and Sentinel-3A/B were also performed in the Northwest Pacific (115–150°E, 20–50°N). The crossover points between Jason-3 and Sentinel-3A/B were produced using the information on the satellite ground track. A collocation database was produced by selecting the satellite data closest to the crossover point. Because Jason-3 and Sentinel-3A/B have different repeat periods, collocation data has not been generated at all crossover points. Considering this, a temporal interval of 1 h was determined sufficient for a matchup database. In the comparison of the altimeter SWHs with the wave model data, the altimeter point nearest the model grid was selected, and a 1.5 h interval was determined by consideration of the 3-h temporal resolution of the model.
3. Results
3.1. Accuracy of altimeter SWH and spatial distribution of errors
3.1.1. Comparison of altimeter SWH using in situ measurements
shows the comparison results of in situ measurements of KMA buoys and satellite SWHs from Jason-3 and Sentinel-3A/B with SAR mode and PLRM. In case of Jason-3 as shown in , a total of 1,129 matchups produced a bias error of 0.10 m and RMSE of 0.59 m, with similar accuracy in the ocean (Yang et al. Citation2020). The scatter index (SI) and correlation coefficients were 0.51 and 0.78, respectively, indicating that Jason-3 SWH data were in good agreement with the in situ measurements.
The validation results of Sentinel-3A SWHs showed different distributions of errors from those of Jason-3 in both the SAR mode and PLRM (). The number of matchups was 1,227, which is similar to that of Jason-3. However, for the SAR mode and PLRM, the Sentinel-3 SWHs had obvious positive biases of 0.19 m and 0.42 m and high RMSEs of 1.07 m and 1.60 m, respectively. Overall, when the SWHs were high, they were in good agreement with the in situ measurements. On the other hand, as the SWHs were low, the SWHs of Sentinel-3A were overestimated. In addition, Sentinel-3A SWHs showed high SIs (1.08 for SAR mode, 1.61 for PLRM) and low correlation coefficients (0.52 for SAR mode, 0.30 for PLRM). These results implied that Sentinel-3A SWH tended to be overestimated with high scatter at low SWH conditions in the coastal region of the Korean Peninsula. This tendency has been reported in previous studies (Queffeulou Citation2004; Park et al. Citation2013; Schlembach et al. Citation2020); however, the magnitude of the errors is remarkably high.
In the case of Sentinel-3B, only 357 matchups were obtained owing to the relatively short period after its launch in 2018 (). The matchups were produced at relatively low SWHs of less than 3 m, whereas Sentinel-3B covered SWHs amounting to 6 m. The result of the SWH data observed in SAR mode showed a bias of 0.03 m and RMSE and standard deviation (STD) of 0.69 m with respect to in situ measurements. The Sentinel-3B SWH observed in PLRM showed a positive bias of 0.20 m and RMSE and STD of 0.89 m and 0.87 m, respectively. The SI was 0.64 in the SAR mode and 0.83 in PLRM. Correlation coefficients of the two modes were 0.74 and 0.61, respectively. In contrast to Sentinel-3A, such a high overestimation did not occur for both SAR mode and PLRM of Sentinel-3B at low SWHs. SWHs observed by Sentinel-3A/B in the coastal regions of the Korean Peninsula showed significantly lower accuracy than those in the open ocean, with an RMSE of less than 0.3 m (Yang and Zhang Citation2019; Yang et al. Citation2020). The SWHs retrieved in the SAR mode had higher accuracy in both Sentinel-3A and 3B than those retrieved from PLRM data, as shown in . At low SWHs of less than 2 m, the SWHs retrieved from PLRM tended to be overestimated with RMSEs of approximately 0.44 m and 0.22 m for Sentinel-3A and Sentinel-3B, respectively. As a result of altimeter SWH validation with a spatial limit of 25 km, statistical parameters indicating higher accuracy were calculated and compared to those with a spatial limit of 50 km ((g–l)). However, the number of matchups was reduced by 45.3% for Jason-3, 75.2% for Sentinel-3A, and 33.6% for Sentinel-3B. The number of buoy stations included in the matchup database also decreased by 6.3–54.5%.
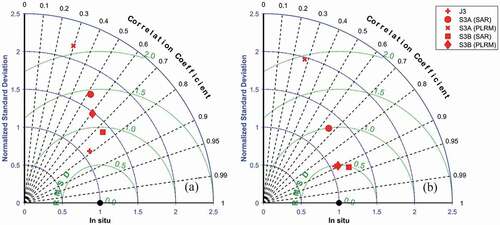
shows a Taylor diagram comprising the STD, RMSE, and correlation coefficients of the five cases (Jason-3, Sentinel-3A SAR mode and PLRM, and Sentinel-3B SAR mode and PLRM). For comparison, the STDs and RMSEs were normalized using STDs of in situ SWHs for the spatial limits of 50 km and 25 km. As shown in , Jason-3 demonstrated the most outstanding capability for measuring SWHs (r = 0.78, normalized STD = 1.10 m, normalized RMSE = 0.70 m). A similar distribution was also presented when a spatial limit of 25 km was applied (). The Taylor diagram suggests that the accuracies of the satellite SWHs are as follows: Jason-3, Sentinel-3B SAR mode, Sentinel-3B PLRM, Sentinel-3A SAR mode, and Sentinel-3A PLRM.
Figure 3. Comparison between significant wave height (SWH) (m) observed by (a) Jason-3, (b) Sentinel-3A Synthetic Aperture Radar (SAR) mode, (c) Sentinel-3A Pseudo Low Resolution Mode (PLRM), (d) Sentinel-3B SAR mode, (e) Sentinel-3B PLRM, and (f) all altimeters and in situ SWH (m) from buoy stations of Korea Meteorological Administration with spatial limit of 50 km. (g)–(l) Results for a spatial limit of 25 km. Number of matchups (N), bias, root mean square error (RMSE), standard deviation (STD), scatter index (SI), and correlation coefficient (r) are given in each plot.
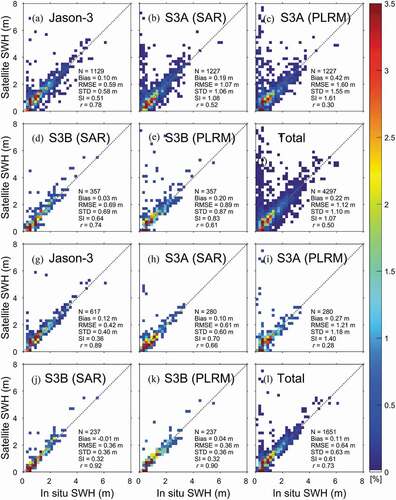
Figure 4. Taylor diagram showing the statistics of altimeter significant wave heights with in situ measurements from buoy stations with a spatial limits of (a) 50 km and (b) 25 km.
3.1.2. Spatial distribution of SWH errors
presents the spatial distribution of the RMSE of the SWH differences between the satellite-observed values and in situ measurements at the wave buoy stations, as shown in . The details of the errors are presented in . The matchups of Jason-3 with a spatial limit of 50 km, obtained at 11 buoy stations, produced RMSEs ranging from 0.19 to 0.96 m, with the highest RMSE being recorded at station Y5 closest to the land and the lowest RMSE at far offshore station (Y7) (). In the case of the Sentinel-3A SAR mode, the SWHs yielded high RMSE (>1.2 m), especially at the western coastal stations (Y5 and Y6) and three buoy stations in the southern coastal region of the Korean Peninsula (S3–S5). In contrast, the eastern coastal and offshore stations showed a relatively low RMSE of less than 0.65 m (). The highest RMSE was found at station Y6 (2.74 m) on the southwestern coast, which is remarkably different from the smallest errors at stations S6 and E2 (0.33 m). The SWHs of Sentinel-3A PLRM presented higher RMSEs at most buoy stations than those identified in the SAR mode (). Similar to the SAR mode, the highest RMSEs were observed at southwestern stations Y5 (3.96 m) and Y6 (4.48 m).
Table 4. Minimum and maximum SWH (m) from in situ measurements in the matchup database and number of matchups (N), average collocation distance (D) (km), bias, root mean square error (RMSE), and standard deviation (STD) of altimeter SWH at each buoy station of Korea Meteorological Administration. The results for 25 km resolution are displayed in lower rows
Sentinel-3B SWH obtained in SAR mode showed RMSEs of less than 0.7 m at all buoy stations except station Y5 (2.29 m). The spatial distribution of RMSE of SWH retrieved in PLRM was similar to that of SWH retrieved in SAR mode, but the RMSE values were slightly higher by 0.81 m (). Regardless of the satellite and observation mode, the overall features revealed the highest spatial errors at the southwestern coastal stations (Y5 and Y6). The bathymetry near these stations is shallow and complicated with many islands. Spatial distributions of the RMSE of the altimeter SWH using matchups with a spatial limit of 25 km were similar to that using matchups with a spatial limit of 50 km ((f–j)).
Figure 5. Spatial distribution of root mean square error (m) of significant wave height observed by (a) Jason-3, (b) Sentinel-3A Synthetic Aperture Radar (SAR) mode, (c) Sentinel-3A Pseudo Low Resolution Mode (PLRM), (d) Sentinel-3B SAR mode, and (e) Sentinel-3B PLRM at the location of the buoy station with spatial limit of 50 km. (f)–(j) Results for a spatial limit of 25 km.
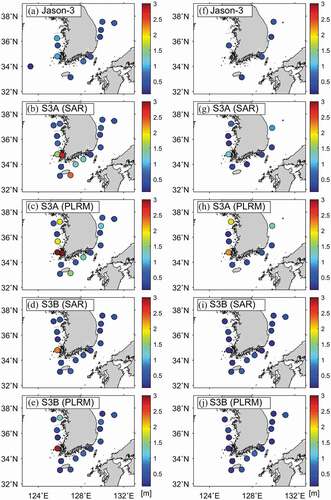
Figure 6. Spatial distribution of bias (m) of significant wave height observed by (a) Jason-3, (b) Sentinel-3A Synthetic Aperture Radar (SAR) mode, (c) Sentinel-3A Pseudo Low Resolution Mode (PLRM), (d) Sentinel-3B SAR mode, and (e) Sentinel-3B PLRM at the location of the buoy station with spatial limit of 50 km. (f)–(j) Results for a spatial limit of 25 km.
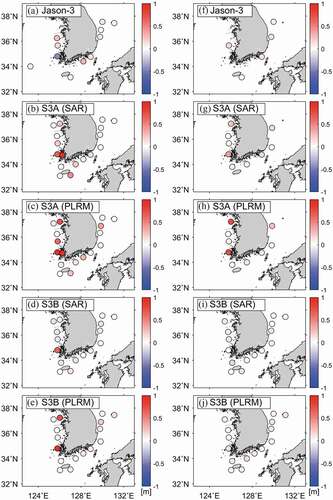
As shown in and, the bias errors of Jason-3 SWH from in situ measurements ranged from −0.43 to 0.30 m. The highest amplitude of the bias errors was detected at station Y5 (−0.43 m), and the lowest amplitude of bias was found at station E5 (0.04 m). The bias in the case of Jason-3, excluding station Y5, ranged from 0.04 m to 0.30 m, showing relatively low values in most coastal regions. For Sentinel-3A, the maximum and minimum amplitude of bias were 1.86 m (Y6) and −0.01 m (S1) in the SAR mode, respectively (), and 3.10 m (Y6) and 0 m (S2) in the PLRM, respectively (). Sentinel-3B SWH data retrieved in SAR mode showed a bias in the range from −0.10 m to 0.65 m against in situ measurements (). As can be seen in , the bias of Sentinel-3B SWHs retrieved from PLRM data ranged from −0.08 m to 1.78 m. Like other satellites, Sentinel-3B also had the highest amplitudes of bias at station Y5 with SAR mode of 0.65 m and PLRM of 1.78 m (). The overall distribution indicated that extremely positive and negative bias errors appeared in the southwestern and western coastal stations of the Korean Peninsula, regardless of satellite and mode. The bias errors of Jason-3, Sentinel-3A SAR mode, and PLRM were marginally smaller when the 25 km spatial limit was applied than when the 50 km spatial limit was applied. Further, a similar distribution was observed in all sea areas ((f–h)). As shown in demonstrate that the bias error of Sentinel-3B also had a similar overall spatial distribution, except at Y5 station, where there was a substantial decrease.
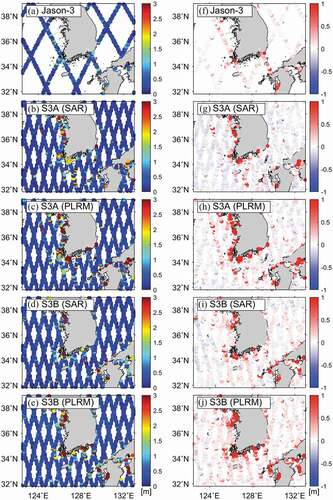
A matchup database between the wave model and the altimeter was also produced to compare the altimeter SWH errors in the coastal and offshore seas around the Korean Peninsula (). There were more significant differences in the coastal region than in the offshore region. In the case of Jason-3, it was difficult to find noticeable differences between the coastal region and the offshore region due to the sparse ground track. In contrast, the difference was evident for the case of Sentinel-3A/B. In the offshore regions more than 100 km from the coast, the average RMSE was less than 1 m, and the bias errors ranged from −0.5 m to 0.5 m. However, comparison of the altimeter SWH data and the simulated wave model data showed high RMSEs and bias errors in the coastal region of the Korean Peninsula, particularly in the western and southern coasts. As shown in , the spatial distribution of the altimeter SWH errors for the wave model in the coastal region was similar to that of buoy measurements.
Figure 7. Spatial distribution of the root mean square error (m) of the significant wave height observed by (a) Jason-3, (b) Sentinel-3A Synthetic Aperture Radar (SAR) mode, (c) Sentinel-3A Pseudo Low Resolution Mode (PLRM), (d) Sentinel-3B SAR mode, and (e) Sentinel-3B PLRM for SWH of the wave model. (f)–(j) are the same, with (a)–(e) for bias (m).
3.2. Cross validation in the Northwest Pacific
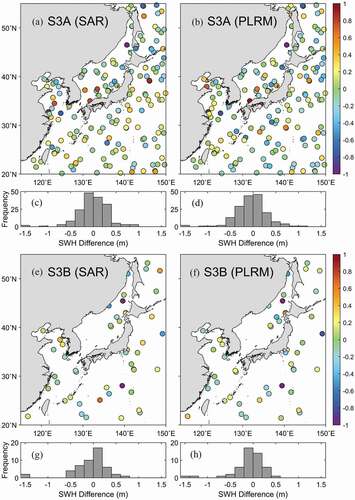
As mentioned earlier, Jason-3 showed higher accuracy than any other satellite with different modes. Considering this, cross-validation was performed to compare the SWH data of Sentinel-3A/B using Jason-3 data as a reference. shows the difference between the SWH in Sentinel-3A/B and Jason-3 at the crossover points in the Northwest Pacific within a 1-h temporal interval. The SWHs of Sentinel-3A were in good agreement with those of Jason-3 in the open ocean of the Northwest Pacific, whereas the differences were amplified in certain portions of the marginal seas (). The maximum differences in the Jason-3 SWHs amounted to 0.93 m in SAR mode and 1.18 m in PLRM near the coast of Japan (134.41°E, 34.41°N). The crossover point with highly negative values appeared in the coastal region of China (121.68°E, 32.77°N), with differences of −3.24 m and −3.26 m in SAR mode and PLRM, respectively. As shown in , approximately 90% of SWH differences of Sentinel-3A for the Jason-3 ranged between −0.5 m and 0.5 m. Positive differences accounted for 50.3% and 46.2% in the SAR mode and PLRM, respectively.
Since Sentinel-3B has been operating since 2018, there have been relatively few matchup data (). The maximum difference values were 0.67 m in the SAR mode (134.09°E, 25.09°N) and 0.49 m in PLRM (140.34°E, 42.96°N). The minimum values of difference were observed in the Northwest Pacific (139.61°E, 45.45°N) in both the SAR mode (−1.82 m) and PLRM (−1.89 m). In the SAR mode, the difference values within ±0.5 m accounted for 87.8%, and the positive differences accounted for approximately 53.1% (). In the PLRM, most of the differences were within ±0.5 m. However, unlike the SAR mode, the negative values occupied a larger proportion of 57.1% ().
Figure 8. Spatial distribution of difference (m) of significant wave height (SWH) observed using (a) Sentinel-3A Synthetic Aperture Radar (SAR) mode, (b) Sentinel-3A Pseudo Low Resolution Mode (PLRM) to Jason-3 SWH, and (c)–(d) their histograms. (e)–(h) are the same with (a)–(d) for Sentinel-3B.
A total of 171 matchup data were obtained for the cross-validation procedure between the Sentinel-3A SWH data and Jason-3 SWH data (). The bias of Sentinel-3A data from Jason-3 data were −0.02 m (SAR mode) and −0.06 m (PLRM), respectively. The RMSE and STD of Sentinel-3A SWH were 0.41 m and 0.41 m in SAR mode and 0.43 m and 0.42 m in PLRM. This result seems to be comparatively higher than the RMSE of 0.2 m from the previous result in the global ocean (Yang, Zhang and Wang Citation2019). The SI of Sentinel-3A SWH cross matchups was 0.22 (SAR mode) and 0.23 (PLRM), and the correlation coefficients were 0.95 and 0.94, respectively. The Sentinel-3B SWH, 49 matchups being obtained, showed good agreement with the Jason-3 SWH (). Sentinel-3B SWHs had negative biases of −0.07 m (SAR mode) and −0.09 m (PLRM) compared to the Jason-3 SWH. The RMSEs of the Sentinel-3B SWH were 0.42 m (SAR mode) and 0.40 m (PLRM), and the STDs were 0.42 m (SAR mode) and 0.39 m (PLRM), respectively. The SI was approximately 0.2, and the correlation coefficient was 0.96 for both SAR mode and PLRM.
Figure 9. Comparison between significant wave height (SWH) (m) observed using (a) Sentinel-3A Synthetic Aperture Radar (SAR) mode, (b) Sentinel-3A Pseudo Low Resolution Mode (PLRM), (c) Sentinel-3B SAR mode, and (d) Sentinel-3B PLRM and SWH (m) observed by Jason-3 in the Northwest Pacific. Number of matchups (N), bias, root mean square error (RMSE), standard deviation (STD), scatter index (SI), and correlation coefficient (r) are given in each plot.
3.3. Characteristics of altimeter SWH errors
3.3.1. Overestimation
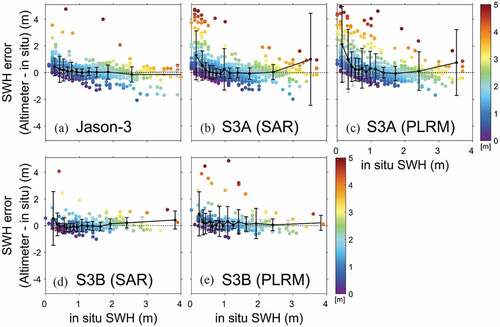
The differences between altimeter SWHs and in situ measurements were analysed to understand the error characteristics of satellite SWHs. Regardless of the satellites, altimeter SWH tended to be overestimated under conditions of low SWHs (). Both altimeter SWH dada and buoy SWH data may contain instrumental errors. It was reported that the SWH values of several wave sensors attached to the buoy stations contained a difference of 0.25 m for waves with an average height of 2.5 m (Jensen et al. Citation2015; Ardhuin et al. Citation2019). The buoy measurements also have some intrinsic observation errors of 5–10%, which is amplified for higher wave heights (Earle and Bush Citation1982; Ardhuin et al. Citation2019). In addition, the overestimation of altimeter SWHs at low SWHs is a common issue and has been previously reported in the global ocean as well as in local seas (Queffeulou Citation2004; Durrant, Greenslade and Simmonds Citation2009; Park et al. Citation2013; Zhang, Wu and Chen Citation2015; Kong et al. Citation2016). The overestimation in this study was much higher than the general errors, including the instrumental noises, which suggests another possibility of degradation of the accuracy of the altimeter SWH data. Although the tendency was relatively low in the cases of Jason-3 and Sentinel-3B (), remarkable positive differences were detected for Sentinel-3A ().
Jason-3 SWH differences, as denoted in error bars of , presented slightly positive mean value of 0.20 (0.16) m and STD of 0.71 (0.46) m, with respect to in situ SWHs less than 1 m. Hereinafter, the values in parenthesis represent the results obtained using the spatial limit of 25 km. When the in situ SWH exceeded 1 m, the Jason-3 SWHs were in good agreement with the in situ measurements. As shown in , Sentinel-3A SWHs retrieved in the SAR mode and the PLRM showed distinctive positive bias errors of 0.28 (0.12) m and 0.61 (0.41) m, and RMSE of 1.08 (0.70) m and 1.84 (1.39) m, respectively, when in situ SWH was less than 1 m. In the SWH range of 1–2 m, the binned averages of the differences were close to zero, but positive bias errors (>0.27 m) were observed in SWHs over 2 m for matchups with a spatial limit of 50 km (). In the case of Sentinel-3B, the differences were significantly reduced (). Nevertheless, weak overestimations of the Sentinel-3B maintained a low SWH condition of less than 1 m. Except for the range where the SWHs were less than approximately 1 m, the RMSE of the altimeter SWHs also tended to slightly increase as the in situ measurements increased, which was similar to the result in the open ocean (Yang and Zhang Citation2019).
The buoy stations used for in situ measurements in this study were located within 100 km of the coast, except for buoy station Y7 (Seohae206). In addition, as shown in , the Yellow Sea and southern region of the Korean Peninsula have many islands, and the topography of these seas is quite complex. Therefore, the influence of outliers caused by land contamination can also be one of the factors of remarkable overestimation at low SWH along with the limitation of the SWH retrieval algorithm (Durrant, Greenslade and Simmonds Citation2009; Kong et al. Citation2016). The land contamination issue is discussed in detail in the subsequent section.
Figure 10. Significant wave height (SWH) errors (m) of (a) Jason-3, (b) Sentinel-3A Synthetic Aperture Radar (SAR) mode, (c) Sentinel-3A Pseudo Low Resolution Mode (PLRM), (d) Sentinel-3B SAR mode, and (e) Sentinel-3B PLRM as function of in situ SWH (m) from buoy stations. Black (gray) dots and bars represent the mean and standard deviation of SWH errors for each interval using matchups with 50 km (25 km) spatial limit. The color represents altimeter SWH (m).
3.3.2. Effect of distance from the coastline
Altimeter SWHs can be contaminated near coastlines due to the effects of land contamination. shows examples of altimeter SWH errors for in situ SWH at the satellite observation points. Buoy stations located close to the coast were selected to confirm the altimeter SWH data affected by land. As shown in , the tracks of Jason-3 nearest to the station Y5, located in a place with very complex topography due to many islands, were Tracks 051 and 214. Jason-3 SWH errors ranged from −2.07 to 4.76 m. SWH errors of several metres or more were considered as outliers associated with land contamination. In addition, as seen in , the negative SWH errors were dominant at 82.76% in Track 051 and 78.26% in Track 214. In the case of Sentinel-3A, three tracks existed within 50 km of station Y4 (Tracks 003, 066, and 331). The SWH errors in Track 003, which is located closest to the coast, showed the most pronounced outliers (>1 m) compared to other tracks (39.39% in Track 003, 0% in Track 066, and 3.23% in Track 331) (). The SWH errors of Sentinel-3B also had a higher proportion of land-contaminated outliers on Track 003 in closer proximity to the coast compared to Track 123, which is located in farther proximity from the coast ().
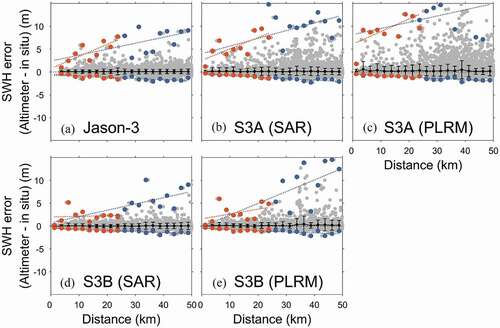
To quantitatively investigate the land effect, SWH differences within a distance of 100 km from the coast were selected. The bias of Jason-3 SWH tended to be negative (−0.40 m) with respect to the coastal distance with amplified STD of up to 0.59 m (). Conversely, the mean errors decreased to close to zero at distances exceeding 20 km, and the STD was nearly uniform with a mean value of approximately 0.3 m. In this study area, the adjacent ground tracks of Jason-3 were approximately 250 km; therefore, the collocated SWHs within the spatial limit of 50 km were obtained primarily from only one track stacked at a particular value. Furthermore, no matchup data were observed within 3 km from the coast because they were removed by quality flags. Nevertheless, the SWH errors of Jason-3 tended to increase weakly towards the coastal region.
In the case of Sentinel-3A, SWHs tended to be overestimated towards the coastline, as shown in . For both the SAR mode and PLRM data, SWH errors were amplified significantly with slopes of −0.16 (−0.11) m km−1 and −0.38 (−0.27) m km−1, respectively, with respect to coastal distances below 10 km. However, the overall Sentinel-3A SWHs were in good agreement with in situ SWHs in the offshore and far-offshore regions more than 10 km. Mean errors of the SWHs of Sentinel-3B SAR mode, ranging from −0.06 (−0.19) m to 0.47 (0.22) m, did not show a strong dependence on the coastal distance; however, the STD variability showed an amplification tendency towards the coast (). On the other hand, the error of SWH in PLRM using a 50 km spatial limit tended to increase in the region within 20 km of the coastal area (). Overall, the results suggested that the satellite altimeters presented relatively good accuracy in the offshore region with overestimation in the coastal regions.
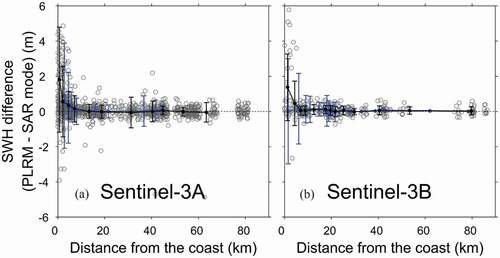
To investigate the error characteristics of Sentinel-3A/B SWH retrieved in SAR mode and PLRM, the difference between SWH SAR mode and PLRM (PLRM - SAR mode) was estimated with respect to the distance from the coastline (). In both Sentinel-3A and 3B, the difference amplified closer to the shore. Within 20 km, the averages of the SWH differences between the SAR mode and PLRM were 0.48 (0.25) m and 0.32 (0.08) m for Sentinel-3A and 3B, respectively. However, in the far-offshore region, the differences were negligible, implying that the PLRM-observed SWHs are similar to the SAR modes of Sentinel-3A/B. These results were consistent with those of a previous study of Sentinel-3A SWH validation conducted offshore in Southwest England (Nencioli and Quartly Citation2019).
Figure 11. (a) Significant wave height (SWH) errors at matchup points between Jason-3 for station Y5 and (b) histogram of SWH errors by track; (c) and (d) are the same with (a) and (b) for Sentinel-3A PLRM and Y4 station; (e) and (f) are the same with (a) and (b) for Sentinel-3B PLRM and Y1 station.
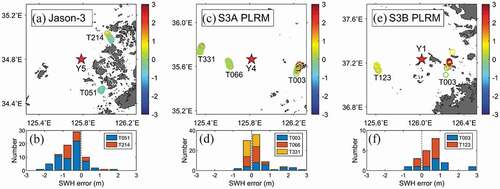
Figure 12. Significant wave height (SWH) errors (m) of (a) Jason-3, (b) Sentinel-3A Synthetic Aperture Radar (SAR) mode, (c) Sentinel-3A Pseudo Low Resolution Mode (PLRM), (d) Sentinel-3B SAR mode, and (e) Sentinel-3B PLRM as a function of distance from the coast (km). Black (blue) dots and bars represent the mean and standard deviation of SWH errors for each interval using matchups with 50 km (25 km) spatial limit.
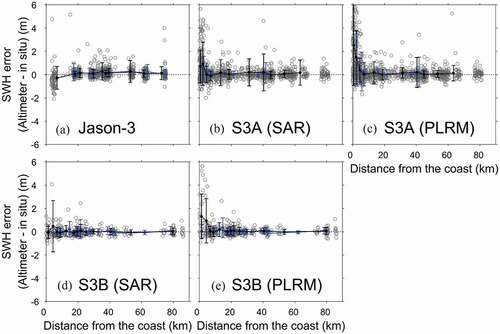
Figure 13. Significant wave height (SWH) difference (m) between Synthetic Aperture Radar (SAR) mode and Pseudo Low Resolution Mode (PLRM) of (a) Sentinel-3A and (b) Sentinel-3B as a function of distance from the coast (km). Black (blue) dots and bars represent the mean and standard deviation of SWH errors for each interval using matchups with 50 km (25 km) spatial limit.
3.3.3. Distance between matchup points
The matchup procedure was conducted by collocating the SWH data by taking all the points within 50 km. To understand the error characteristics according to the distance of the collocated point between satellite ground observation and the buoy station, the SWH errors were displayed as a function of the matchup distance (). The averages of the Jason-3 SWH error for each bin were close to 0 regardless of the matchup distance (). However, the maximum and minimum errors within each bin were amplified with linear dependences of 0.13 (0.26) m km−1 (upper line) and −0.03 (−0.04) m km−1 (lower line). As shown in (b–d), the tendency of scattering of the maximum errors was more pronounced in Sentinel-3A/B. This is more clearly observed in the maximum value, rather than the minimum value. Sentinel-3A SWH maximum errors intensified with slopes of 0.17 (0.24) m km−1 (SAR mode) and 0.14 (0.27) m km−1 (PLRM), whereas the minimum values had a small slope of −0.03 (−0.05) m km−1 (SAR mode) and −0.03 (−0.03) m km−1 (PLRM) as the matchup distance increased (). As the matchup distance increased, Sentinel-3A SWHs showed greater errors (>3 m). Similarly, the maximum values of Sentinel-3B SWH errors were also increased in both SAR mode (0.14 (0.01) m km−1) and PLRM (0.26 (0.11) m km−1) (). This implies that extreme errors tend to increase in accordance with the matchup distance.
Figure 14. Significant wave height (SWH) errors (m) of (a) Jason-3, (b) Sentinel-3A Synthetic Aperture Radar (SAR) mode, (c) Sentinel-3A Pseudo Low Resolution Mode (PLRM), (d) Sentinel-3B SAR mode, and (e) Sentinel-3B PLRM as a function of distance (km) between satellite and buoy station, where blue (orange) dots and blue (orange) dashed lines represent maximum and minimum SWH errors for each interval and a linear least square fit using matchups with 50 km (25 km) spatial limit. Black dots and bars represent the mean and standard deviation of SWH errors for each interval.
3.3.4. Effect of tidal current
As shown earlier, the southwestern and western coastal regions of the Korean Peninsula are known to have complex coastlines and strong tidal currents (Lie Citation1989). As the wave interacts with the tidal current, the wave height tends to be modulated (Vincent Citation1979; Masson Citation1996; Wang and Sheng Citation2018; Lewis et al. Citation2019). Modulation of the wave height by wave–tidal current interaction can reduce the homogeneity of the wave height in the matchup area. In addition, strong tidal currents can affect the roughness of the sea surface over complicated shallow bathymetry.
Figure 15. Absolute errors (m) of significant wave height (SWH) of (a) Jason-3, (b) Sentinel-3A Synthetic Aperture Radar (SAR) mode, (c) Sentinel-3A Pseudo Low Resolution Mode (PLRM), (d) Sentinel-3B SAR mode, and (e) Sentinel-3B PLRM as a function of tidal current speed (m s −1). (f)–(j) are the same as (a)–(e), but with SWH errors as a function of tidal index. Black (blue) dots and bars represent the mean and standard deviation of SWH errors for each interval using matchups with 50 km (25 km) spatial limit.
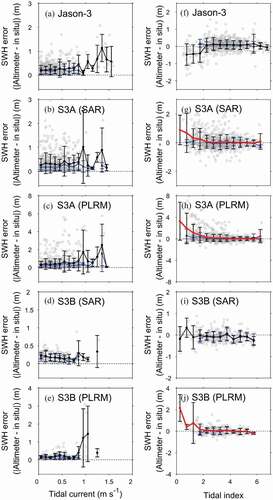
To test this hypothesis, absolute errors of altimeter SWH as a function of the tidal current in the Yellow Sea (Y1–Y7) and southern region (S1–S6) of the Korean Peninsula are presented in (a–e). Tidal current data were obtained from the Korea Hydrographic and Oceanographic Agency (http://www.khoa.go.kr/). Jason-3 SWH errors tended to increase as the tidal current became stronger (). When the tidal current was within 1 m s−1, the mean and STD of absolute error were approximately 0.23 m and 0.21 m, respectively. In contrast, when the tidal current increased by 1 m s−1, the mean and STD of absolute error increased to 0.68 m and 0.53 m, respectively. The tidal current effect was also shown in the SWH errors of Sentinel-3A/B ((b–e)). This error characteristic was more prominent in the PLRM than in the SAR mode. Similar to Jason-3, the SWH errors of Sentinel-3A/B PLRM were also intensified by the strong tidal currents (>1 m s−1). These results suggest that the tidal current may be a potential factor that can yield satellite SWH errors in seas with strong tidal currents, such as the coast of the Korean Peninsula. In collocation data obtained by applying a spatial limit of 25 km, the tidal current rarely exceeds 1 m s−1, making it difficult to understand the effect of tidal current on the altimeter SWH error.
(f–j) shows the altimeter SWH errors as a function of the tidal index (log10 (H/U3) proposed by Simpson and Hunter (Citation1974), where H is water depth including tidal height and U is the speed of tidal current. As with the previous results, the stronger the tidal current and the shallower the water depth, the greater the altimeter SWH errors. In the case of Sentinel-3A, it was evident that the SWH error increased as the tidal index decreased regardless of the retrieval mode. The SWH differences were further amplified by showing an exponential relation to the tidal index in PLRM mode than in SAR mode (). This demonstrates the combined effect of tidal currents and shallow bathymetry on the differences between altimeter SWHs and in situ buoy data.
3.3.5. Wave direction
There are many factors that affect the validation results of altimeter SWH, such as the difference in satellite instruments, homogeneity of the wave height within the matchup distance, and accuracy of in situ measurements (Nencioli and Quartly Citation2019; Quartly and Kurekin Citation2020; Schlembach et al. Citation2020). As suggested by a previous study (Nencioli and Quartly Citation2019), the homogeneity of the wavefield in the altimeter footprint or matchup points between the satellite and buoy station is required to conduct the validation study by investigating the spatial distribution of the wave direction in the coastal region of the Korean Peninsula.
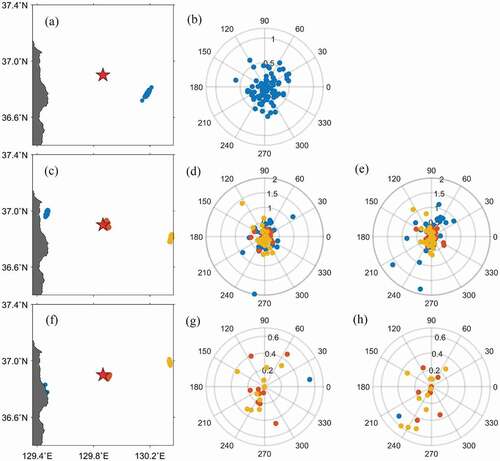
The E3 (Uljin) buoy station located in the EJS with a deep-water depth and monotonous coastline was selected rather than the Yellow Sea and southern region of the Korean Peninsula, which has a strong tidal current or complex topography. shows the absolute difference between the SWH of a satellite altimeter and E3 buoy station with respect to the wave direction observed from the buoy station by dividing the matchup points of the satellite altimeter by track. As reported in a previous study (Nencioli and Quartly Citation2019), the tendency of SWH difference with respect to wave direction was not found even with the exception of the track near the coast affected by the land. Since seas around the Korean Peninsula are affected by the East Asian Monsoon (Chen et al. Citation2002; Park et al. Citation2005), wind waves can propagate from various directions. This three-year study was limited in observing the dependence of the difference between the SWH of satellite altimeters and buoy stations in the wave direction with seasonal variability. This necessitates the study of the effect of wave direction on the validation of altimeter SWH in coastal regions with sufficient long-term data.
Figure 16. (a) Spatial distribution of matchup points between Jason-3 (blue dots) and E3 (red star) station and (b) absolute errors of Jason-3 SWH as function of wave direction measured from E3 station. (c) spatial distribution of matchup points between Sentinel-3A (S3A) (blue, red, and yellow dots) and E3 station (red star) and absolute errors of (d) S3A SAR mode SWH and (e) S3A PLRM SWH as function of wave direction. (f)–(h) are the same with (c)–(e) for Sentinel-3B.
4. Discussion
This study showed that altimeter SWH errors were amplified in coastal regions within 20 km. As the distance from the coast decreases, signals within the ground footprint can possibly be influenced by land contamination (Gommenginger et al. Citation2011; Yang et al. Citation2012). Therefore, the land contamination of signals in coastal regions is a major factor that degrades the accuracy of altimeter SWH (Nencioli and Quartly Citation2019; Quartly and Kurekin Citation2020). In addition, it was confirmed that the accuracy of the altimeter SWH data was affected by the tidal current in the seas around the Korean Peninsula, especially in the western and southern coastal regions. This was evident for Sentinel-3A/B and for the tidal index (). Therefore, the errors of Sentinel-3A/B SWH for the tidal index (TI) were fitted using the following exponential equations (). As shown in , matchups with a spatial limit of 50 km were used to utilize a wide range of tidal indices.
where H is the water depth including tidal height, U is the speed of tidal current, and and
represent corrected SWHs from the SAR mode (
) and the PLRM (
), respectively.
The altimeter SWHs in the coastal region of the Korean Peninsula can be corrected using the estimated equations. Overall, the improvement in accuracy of Sentinel-3A/B SWH data in PLRM was evident when compared with that in SAR mode. As shown in , in SAR mode, bias errors were slightly improved from 0.27 m to 0.20 m (Sentinel-3A) and from 0.04 m to −0.02 m (Sentinel-3B). However, in PLRM, they were significantly decreased from 0.56 m to 0.29 m (Sentinel-3A) and from 0.26 m to −0.01 m (Sentinel-3B). Before correction, RMSE showed a range of 0.80–1.88 m. However, after correction, it showed a range of 0.80–1.77 m (). The SI and correlation coefficient also decreased by 0.12 and increased by 0.08, respectively (). When we focused on small values of tidal index (<2), the RMSE and bias errors were remarkably improved by up to 14.25% (Sentinel-3B PLRM) and 94.40% (Sentinel-3B PLRM), as shown in . Even the SAR mode of Sentinel-3B yielded improved the bias error, amounting to 70.17%. These results suggest that the accuracy of the altimeter SWHs can be improved at coastal regions with strong tidal currents as well as shallow bathymetry. The RMSEs of approximately 1 m indicate that it is impossible to use Sentinel-3A/B SWH data for ocean monitoring as well as research in the coastal region of the Korean Peninsula. It is expected that these correction formulas proposed in this study could reduce the altimeter SWH differences by expanding the applications of the satellite SWHs.
Figure 17. Significant wave height (SWH) errors of Sentinel-3A/B in (a) Synthetic Aperture Radar (SAR) mode and (b) Pseudo Low Resolution Mode (PLRM) as a function of tidal index in the western and southern region of the Korean Peninsula. Red lines are exponential fit to altimeter SWH errors. (c) Bias, (d) root mean square error, (e) scatter index, and (f) correlation coefficient for comparison of altimeter SWH accuracy before and after correction.
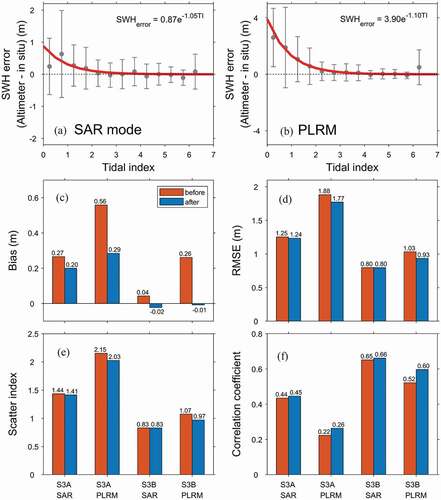
Table 5. RMSE and bias errors of each satellite SWH data (Sentinel-3A SAR, Sentinel-3A PLRM, Sentinel-3B SAR, Sentinel-3B PLRM) before and after applying the correction formula of tidal index (<2), including tidal current, water depth, and tidal variations
Several algorithms have been developed to improve the accuracy of altimeter SWH data in coastal regions (Passaro et al. Citation2014; Wang and Ichikawa Citation2017; Peng and Deng Citation2018). These studies mainly attempted to improve the accuracy of altimeter observation by developing a new retracking algorithm. Studies have also been conducted to evaluate the newly developed retracking algorithm and to determine the most suitable algorithm (Schlembach et al. Citation2020). The performance of the retracking algorithm may vary depending on the properties of the coast, sea state, and buoy selection in the matchup procedure (Quartly and Kurekin Citation2020; Schlembach et al. Citation2020). Therefore, a study proposing the most suitable SWH retrieval algorithm for the coast of the Korean Peninsula and investigating the effects of sea state and buoy selection is required in future. In addition, the development of an algorithm is required for the acquisition of accurate SWH data in coastal regions where tidal currents are strong.
5. Conclusion
In this study, we assessed the accuracy of altimeter SWHs as one of the important coastal environmental variables and an essential variable in understanding climate change in the coastal regions around the Korean Peninsula. The accuracy of these altimeter SWHs has been sufficiently investigated in the global ocean; however, the accuracy of SWHs in each coastal region requires further study. The accuracy of the altimeter wave heights depends on diverse elements, such as local wind condition and marine-atmospheric conditions in local seas. Therefore, in situ data should be obtained to conduct verification studies as many as possible in the local seas. Marine buoy stations have been steadily operated for decades in the coastal seas around the Korean Peninsula. The wave measurement data of the KMA buoys can contribute to the assessment of the accuracy of satellite SWHs in coastal regions. Therefore, this study was performed to understand the accuracy and error characteristics of satellite SWHs. Jason-3 altimeter data were used as the representative satellites. In addition, Sentinel-3A and 3B, which carry the SRAL with a narrow footprint, approximately 300 m along-track resolution, and high signal-to-noise ratio, were selected for the validation of the SWHs with respect to in situ measurements. Among the satellite SWH data that satisfy the spatial and temporal criteria of 50 km and 30 min, the data at the point closest to the buoy station were compared with the in situ SWH.
During 2017 to 2019, Jason-3 SWH presented a bias of 0.10 m and an RMSE of 0.59 m for in situ measurements. The bias of Sentinel-3A SWH was 0.19 m and 0.42 m and the RMSE was 1.07 m and 1.60 m in the SAR mode and PLRM, respectively. The bias of Sentinel-3B SWH was 0.03 m and 0.20 m and RMSE was 0.69 m and 0.89 m in SAR mode and PLRM, respectively. Through analysis of the spatial distribution of RMSE and bias at each buoy station, higher SWH errors were observed in the Yellow Sea than in other seas. Cross-validation was also performed to compare SWH between Jason-3 and Sentinel-3A/B in the open ocean of the Northwest Pacific. In the open ocean, Jason-3 SWH and Sentinel-3A/B SWH showed good agreement with each other, showing RMSE of less than 0.42 m. To investigate the error characteristics of satellite SWH, the difference between altimeter SWH and in situ measurements was analysed with respect to in situ SWH, distance from the coast, and matchup distance. For in situ SWH, the satellite SWHs were commonly overestimated at low wave heights. The satellite SWH errors were amplified as the distance from the coast decreased, and this error characteristic was also observed in the difference between the SWH in PLRM and SWH in the SAR mode of Sentinel-3A/B. This result showed the possibility that the SAR altimeter could observe SWH with high accuracy in complex regions, such as the coast of the Korean Peninsula. The error of altimeter SWH was scattered as the matchup distance increased. Among the seas around the Korean Peninsula, the Yellow Sea exhibits particularly strong currents. In this study, the error of the altimeter SWH was also analysed for the speed of the tidal current and tidal index, and it was suggested that the tidal current could have an effect on the accuracy of altimeter SWH data in the western and southern coastal region of the Korean Peninsula. In order to correct the altimeter SWH errors caused by tidal current and bathymetry, this study proposed that the Sentinel-3A/B SWH errors could be improved by applying the exponential equation for each satellite altimeter. After the correction, the accuracy of SWH in the PLRM was more improved than the SAR mode. Nevertheless, in order to obtain accurate altimeter SWH data, a robust retrieval algorithm, and quality control procedure should be developed by considering the effects by other factors.
Altimeter SWH in the coastal region has tendency to be less accurate than that in the open ocean. In particular, in the case of the coastal region around the Korean Peninsula, the error of the altimeter SWH was further amplified due to the complex topography and various marine phenomena such as tidal currents. The results of the error characteristics of this study are expected to contribute to the development of an algorithm for accurate altimeter SWH retrieval without data loss in coastal regions. This study addresses the importance of SAR mode of Sentinel-3A/B in the wave height observation in the coastal region. Continuous observations of conventional mode as well as SAR mode should be required to understand the spatial and temporal variability of SWHs in the seas around the Korean Peninsula.
Acknowledgements
This work was supported by the National Research Foundation of Korea (NRF), grant funded by the Korean government (MSIT) (No. 2020R1A2C2009464).
Disclosure statement
No potential conflict of interest was reported by the author(s).
Additional information
Funding
Reference
- Abdalla, S., P. A. Janssen, and J.-R. Bidlot. 2010. “Jason-2 OGDR Wind and Wave Products: Monitoring, Validation and Assimilation.” Marine Geodesy 33 (sup1): 239–255. doi:https://doi.org/10.1080/01490419.2010.487798.
- Abdalla, S., S. Dinardo, J. Benveniste, and P. A. Janssen. 2018. “Assessment of CryoSat-2 SAR Mode Wind and Wave Data.” Advances in Space Research 62 (6): 1421–1433. doi:https://doi.org/10.1016/j.asr.2018.01.044.
- ACRI-ST IPF Team. 2017. “Product Data Format Specification - SRAL/MWR Level 2 Marine Products.” Accessed 29 October 2021. https://www.eumetsat.int/media/44137
- Ardhuin, F., E. Rogers, A. V. Babanin, J. F. Filipot, R. Magne, A. Roland, A. van der Westhuysen et al. 2010. ”Semiempirical Dissipation Source Functions for Ocean Waves. Part I: Definition, Calibration, and Validation.” Journal of Physical Oceanography 40 (9): 1917–1941. doi:https://doi.org/10.1175/2010jpo4324.1.
- Ardhuin, F., J. E. Stopa, B. Chapron, F. Collard, R. Husson, R. E. Jensen, J. Johannessen, A. Mouche, M. Passaro, and G. D. Quartly. 2019. “Observing Sea States.” Frontiers in Marine Science 6: 124. doi:https://doi.org/10.3389/fmars.2019.00124.
- Babanin, A. 2006. “On a Wave‐induced Turbulence and a Wave‐mixed Upper Ocean Layer.” Geophysical Research Letters 33 (20). doi:https://doi.org/10.1029/2006GL027308.
- Brown, G. S. 1977. “The Average Impulse Response of a Rough Surface and Its Applications.” IEEE Transactions on Antennas and Propagation 25 (1): 67–74. doi:https://doi.org/10.1109/Tap.1977.1141536.
- Chang, K. I., W. J. Teague, S. J. Lyu, H. T. Perkins, D. K. Lee, D. R. Watts, Y. B. Kim, D. A. Mitchell, C. M. Lee, and K. Kim. 2004. “Circulation and Currents in the Southwestern East/japan Sea: Overview and Review.” Progress in Oceanography 61 (2–4): 105–156. doi:https://doi.org/10.1016/j.pocean.2004.06.005.
- Chapron, B., H. Johnsen, and R. Garello. 2001. “Wave and Wind Retrieval from SAR Images of the Ocean.” Annals of Telecommunications-Annales Des Telecommunications 56 (11–12): 682–699. doi:https://doi.org/10.1007/BF02995562.
- Chen, G., B. Chapron, R. Ezraty, and D. Vandemark. 2002. “A Global View of Swell and Wind Sea Climate in the Ocean by Satellite Altimeter and Scatterometer.” Journal of Atmospheric and Oceanic Technology 19 (11): 1849–1859. doi:https://doi.org/10.1175/1520-0426(2002)019<1849:AGVOSA>2.0.CO;2.
- Choi, B. H. 1980. A Tidal Model of the Yellow Sea and the Eastern China Sea. Ansan: Korea Ocean Research and Development Institute.
- Choi, B. H., K. O. Kim, and H. M. Eum. 2002. “Digital Bathymetric Topographic Data for Neighboring Seas of Korea.” Journal of Korean Society of Coastal and Ocean Engineers 14 (1): 41–50.
- Dai, D., F. Qiao, W. Sulisz, L. Han, and A. Babanin. 2010. “An Experiment on the Nonbreaking Surface-Wave-Induced Vertical Mixing.” Journal of Physical Oceanography 40 (9): 2180–2188. doi:https://doi.org/10.1175/2010JPO4378.1.
- Donlon, C., B. Berruti, A. Buongiorno, M.-H. Ferreira, P. Féménias, J. Frerick, P. Goryl, U. Klein, H. Laur, and C. Mavrocordatos. 2012. “The Global Monitoring for Environment and Security (GMES) Sentinel-3 Mission.” Remote Sensing of Environment 120: 37–57. doi:https://doi.org/10.1016/j.rse.2011.07.024.
- Durand, F., C. G. Piecuch, M. Becker, F. Papa, S. V. Raju, J. U. Khan, and R. M. Ponte. 2019. “Impact of Continental Freshwater Runoff on Coastal Sea Level.” Surveys in Geophysics 40 (6): 1437–1466. doi:https://doi.org/10.1007/s10712-019-09536-w.
- Durrant, T. H., D. J. Greenslade, and I. Simmonds. 2009. “Validation of Jason-1 and Envisat Remotely Sensed Wave Heights.” Journal of Atmospheric and Oceanic Technology 26 (1): 123–134. doi:https://doi.org/10.1175/2008JTECHO598.1.
- Earle, M. D. and K. A. Bush. 1982. “Strapped-Down Accelerometer Effects on NDBO Wave Measurements.” In Proc. MTS/IEEE Oceans 1982 Conference, 838–848, New York.
- Ebuchi, N. and H. Kawamura. 1994. “Validation of Wind Speeds and Significant Wave Heights Observed by the TOPEX Altimeter Around Japan.” Journal of Oceanography 50 (4): 479–487. doi:https://doi.org/10.1007/BF02234969.
- EUMETSAT. 2017. “Sentinel-3 SRAL Marine User Handbook.” Accessed 8 July 2021. https://earth.esa.int/eogateway/documents/20142/1564943/Sentinel-3-SRAL-Marine-User-Handbook.pdf
- Flather, R. A. 2000. “Existing Operational Oceanography.” Coastal Engineering 41 (1–3): 13–40. doi:https://doi.org/10.1016/S0378-3839(00)00025-9.
- Goda, Y. and E. An. 1973. “On Wave Characteristics Along the East Coast of Korea and Some Remarks on Breakwater Design.” Journal of Korean Society of Civil Engineers 21 (1): 78–89.
- Gommenginger, C., P. Thibaut, L. Fenoglio-Marc, G. Quartly, X. Deng, J. Gómez-Enri, P. Challenor, and Y. Gao. 2011. “Retracking Altimeter Waveforms Near the Coasts Vignudelli, S., Kostianoy, A. G., Cipollini3, P., and Benveniste, J.” In Coastal Altimetry, pp. 61–101. Berlin, Heidelberg: Springer.
- Gower, J. 1996. “Intercalibration of Wave and Wind Data from TOPEX/POSEIDON and Moored Buoys off the West Coast of Canada.” Journal of Geophysical Research: Oceans 101 (C2): 3817–3829. doi:https://doi.org/10.1029/95JC03281.
- Hauser, D., C. Tourain, L. Hermozo, D. Alraddawi, L. Aouf, B. Chapron, A. Dalphinet et al. 2021. ”New Observations from the SWIM Radar on-Board CFOSAT: Instrument Validation and Ocean Wave Measurement Assessment.” IEEE Transactions on Geoscience and Remote Sensing 59 (1): 5–26. doi:https://doi.org/10.1109/Tgrs.2020.2994372.
- Hayne, G. S. 1980. “Radar Altimeter Mean Return Waveforms from Near-Normal-Incidence Ocean Surface Scattering.” IEEE Transactions on Antennas and Propagation 28 (5): 687–692. doi:https://doi.org/10.1109/Tap.1980.1142398.
- Huang, C. J., and F. Qiao. 2010. “Wave‐turbulence Interaction and Its Induced Mixing in the Upper Ocean.” Journal of Geophysical Research: Oceans 115 (C4 C04026).
- Hwang, P. A., W. J. Teague, G. A. Jacobs, and D. W. Wang. 1998. “A Statistical Comparison of Wind Speed, Wave Height, and Wave Period Derived from Satellite Altimeters and Ocean Buoys in the Gulf of Mexico Region.” Journal of Geophysical Research: Oceans 103 (C5): 10451–10468. doi:https://doi.org/10.1029/98JC00197.
- Jensen, R. E., V. R. Swail, R. H. Bouchard, R. E. Riley, T. J. Hesser, M. Blaseckie, and C. MacIsaac. 2015. “Field Laboratory for Ocean Sea State Investigation and Experimentation: FLOSSIE: Intra-Measurement Evaluation of 6N Wave Buoy Systems.” Paper presented at the 14th International Workshop on Wave Hindcasting and Forecasting and Fifth Coastal Hazard Symposium, Florida, November 8–13.
- Jeong, W.-M., S.-H. Oh, and D.-Y. Lee. 2007. “Abnormally High Waves on the East Coast.” Journal of Korean Society of Coastal and Ocean Engineers 19 (4): 295–302.
- Jiang, C., M. Lin, and H. Wei. 2019. “A Study of the Technology Used to Distinguish Sea Ice and Seawater on the Haiyang-2A/B (HY-2A/B) Altimeter Data.” Remote Sensing 11 (12): 1490. doi:https://doi.org/10.3390/rs11121490.
- Jiang, J. Y., R. L. Street, and S. P. Klotz. 1990. “A Study of Wave‐turbulence Interaction by Use of a Nonlinear Water Wave Decomposition Technique.” Journal of Geophysical Research: Oceans 95 (C9): 16037–16054. doi:https://doi.org/10.1029/JC095iC09p16037.
- Kong, Y., X. Zhang, L. Sheng, and B. Chen. 2016. “Validation and Application of Multi-Source Altimeter Wave Data in China’s Offshore Areas.” Acta Oceanologica Sinica 35 (11): 86–96. doi:https://doi.org/10.1007/s13131-016-0951-5.
- Kudryavtsev, V., M. Yurovskaya, B. Chapron, F. Collard, and C. Donlon. 2017. “Sun Glitter Imagery of Ocean Surface Waves. Part 1: Directional Spectrum Retrieval and Validation.” Journal of Geophysical Research: Oceans 122 (2): 1369–1383. doi:https://doi.org/10.1002/2016jc012425.
- Kudryavtseva, N. A. and T. Soomere. 2016. “Validation of the Multi-Mission Altimeter Wave Height Data for the Baltic Sea Region.” Estonian Journal of Earth Sciences 65 (3): 161–175. doi:https://doi.org/10.3176/earth.2016.13.
- Kumar, U. M., D. Swain, S. Sasamal, N. N. Reddy, and T. Ramanjappa. 2015. “Validation of Saral/altika Significant Wave Height and Wind Speed Observations Over the North Indian Ocean.” Journal of Atmospheric and Solar-Terrestrial Physics 135: 174–180. doi:https://doi.org/10.1016/j.jastp.2015.11.003.
- Lewis, M. J., T. Palmer, R. Hashemi, P. Robins, A. Saulter, J. Brown, H. Lewis, and S. Neill. 2019. “Wave-Tide Interaction Modulates Nearshore Wave Height.” Ocean Dynamics 69 (3): 367–384. doi:https://doi.org/10.1007/s10236-018-01245-z.
- Lie, H.-J. 1989. “Tidal Fronts in the Southeastern Hwanghae (Yellow Sea).” Continental Shelf Research 9 (6): 527–546. doi:https://doi.org/10.1016/0278-4343(89)90019-8.
- Masson, D. 1996. “A Case Study of Wave–current Interaction in a Strong Tidal Current.” Journal of Physical Oceanography 26 (3): 359–372. doi:https://doi.org/10.1175/1520-0485(1996)026<0359:ACSOWI>2.0.CO;2.
- Narayan, S., M. W. Beck, B. G. Reguero, I. J. Losada, B. van Wesenbeeck, N. Pontee, J. N. Sanchirico, J. C. Ingram, G. M. Lange, and K. A. Burks-Copes. 2016. “The Effectiveness, Costs and Coastal Protection Benefits of Natural and Nature-Based Defences.” Plos One 11 (5): e0154735. doi:https://doi.org/10.1371/journal.pone.0154735.
- Nencioli, F. and G. D. Quartly. 2019. “Evaluation of Sentinel-3A Wave Height Observations Near the Coast of Southwest England.” Remote Sensing 11 (24): 2998. doi:https://doi.org/10.3390/rs11242998.
- Oh, S.-H., W.-M. Jeong, D.-Y. Lee, and S.-I. Kim. 2010. “Analysis of the Reason for Occurrence of Large-Height Swell-Like Waves in the East Coast of Korea.” Journal of Korean Society of Coastal and Ocean Engineers 22 (2): 101–111.
- Park, K. A., J. Y. Chung, K. Kim, and P. C. Cornillon. 2005. “Wind and Bathymetric Forcing of the Annual Sea Surface Temperature Signal in the East (Japan) Sea.” Geophysical Research Letters 32 (5). doi:https://doi.org/10.1029/2004GL022197.
- Park, K., H.-J. Woo, E.-Y. Lee, S. Hong, and K.-L. Kim. 2013. “Validation of Significant Wave Height from Satellite Altimeter in the Seas Around Korea and Error Characteristics.” Korean Journal of Remote Sensing 29 (6): 631–644. doi:https://doi.org/10.7780/kjrs.2013.29.6.6.
- Passaro, M., P. Cipollini, S. Vignudelli, G. D. Quartly, and H. M. Snaith. 2014. “ALES: A Multi-Mission Adaptive Subwaveform Retracker for Coastal and Open Ocean Altimetry.” Remote Sensing of Environment 145: 173–189. doi:https://doi.org/10.1016/j.rse.2014.02.008.
- Peng, F. and X. Deng. 2018. “A New Retracking Technique for Brown Peaky Altimetric Waveforms.” Marine Geodesy 41 (2): 99–125. doi:https://doi.org/10.1080/01490419.2017.1381656.
- Picot, N., C. Marechal, A. Couhert, S. Desai, R. Scharroo, and A. Egido. 2018. “Jason-3 Products Handbook.” Accessed 8 July 2021. https://www.ospo.noaa.gov/Products/documents/hdbk_j3.pdf
- Piollé, J.-F., G. Dodet, and Y. Quilfen. 2020. ”“ESA Sea State Climate Change Initiative (Sea_state_cci): Global Remote Sensing Merged Multi-Mission Monthly Gridded Significant Wave Height, L4 Product, Version 1.1”.” Centre for Environmental Data Analysis. doi:https://doi.org/http://dx.doi.org/10.5285/47140d618dcc40309e1edbca7e773478. Accessed 30 January 2020.
- Pleskachevsky, A., M. Dobrynin, A. V. Babanin, H. Gunther, and E. Stanev. 2011. “Turbulent Mixing Due to Surface Waves Indicated by Remote Sensing of Suspended Particulate Matter and Its Implementation into Coupled Modeling of Waves, Turbulence, and Circulation.” Journal of Physical Oceanography 41 (4): 708–724. doi:https://doi.org/10.1175/2010jpo4328.1.
- Pleskachevsky, A., S. Jacobsen, B. Tings, and E. Schwarz. 2019. “Estimation of Sea State from Sentinel-1 Synthetic Aperture Radar Imagery for Maritime Situation Awareness.” International Journal of Remote Sensing 40 (11): 4104–4142. doi:https://doi.org/10.1080/01431161.2018.1558377.
- Quartly, G. D. and A. A. Kurekin. 2020. “Sensitivity of Altimeter Wave Height Assessment to Data Selection.” Remote Sensing 12 (16): 2608. doi:https://doi.org/10.3390/rs12162608.
- Queffeulou, P. 2004. “Long-Term Validation of Wave Height Measurements from Altimeters.” Marine Geodesy 27 (3–4): 495–510. doi:https://doi.org/10.1080/01490410490883478.
- Raney, R. K. 1998. “The Delay/Doppler Radar Altimeter.” IEEE Transactions on Geoscience and Remote Sensing 36 (5): 1578–1588. doi:https://doi.org/10.1109/36.718861.
- Ray, C., C. Martin-Puig, M. P. Clarizia, G. Ruffini, S. Dinardo, C. Gommenginger, and J. Benveniste. 2015. “SAR Altimeter Backscattered Waveform Model.” IEEE Transactions on Geoscience and Remote Sensing 53 (2): 911–919. doi:https://doi.org/10.1109/Tgrs.2014.2330423.
- Ray, R. D. and B. Beckley. 2003. “Simultaneous Ocean Wave Measurements by the Jason and Topex Satellites, with Buoy and Model Comparisons Special Issue: Jason-1 Calibration/validation.” Marine Geodesy 26 (3–4): 367–382. doi:https://doi.org/10.1080/714044527.
- Schlembach, F., M. Passaro, G. D. Quartly, A. Kurekin, F. Nencioli, G. Dodet, J.-F. Piollé, F. Ardhuin, J. Bidlot, and C. Schwatke. 2020. “Round Robin Assessment of Radar Altimeter Low Resolution Mode and Delay-Doppler Retracking Algorithms for Significant Wave Height.” Remote Sensing 12 (8): 1254. doi:https://doi.org/10.3390/rs12081254.
- Schulz-Stellenfleth, J., T. Konig, and S. Lehner. 2007. “An Empirical Approach for the Retrieval of Integral Ocean Wave Parameters from Synthetic Aperture Radar Data.” Journal of Geophysical Research-Oceans 112 (C3): C3. doi:https://doi.org/10.1029/2006jc003970.
- Sepulveda, H. H., P. Queffeulou, and F. Ardhuin. 2015. “Assessment of Saral/altika Wave Height Measurements Relative to Buoy, Jason-2, and Cryosat-2 Data.” Marine Geodesy 38 (sup1): 449–465. doi:https://doi.org/10.1080/01490419.2014.1000470.
- Simpson, J. H. and J. R. Hunter. 1974. “Fronts in the Irish Sea.” Nature 250 (5465): 404–406. doi:https://doi.org/10.1038/250404a0.
- Verron, J., P. Sengenes, J. Lambin, J. Noubel, N. Steunou, A. Guillot, N. Picot et al. 2015. ”The Saral/altika Altimetry Satellite Mission.” Marine Geodesy 38 (sup1): 2–21. doi:https://doi.org/10.1080/01490419.2014.1000471.
- Vincent, C. E. 1979. “Interaction of Wind-Generated Sea Waves with Tidal Currents.” Journal of Physical Oceanography 9 (4): 748–755. doi:https://doi.org/10.1175/1520-0485(1979)009<0748:Tiowgs>2.0.Co;2.
- Wan, Y., R. J. Zhang, X. D. Pan, C. Q. Fan, and Y. S. Dai. 2020. “Evaluation of the Significant Wave Height Data Quality for the Sentinel-3 Synthetic Aperture Radar Altimeter.” Remote Sensing 12 (18): 3107. doi:https://doi.org/10.3390/rs12183107.
- Wang, J. K., L. Aouf, X. Q. Wang, B. X. Li, and J. J. Wang. 2020. “Remote Cross-Calibration of Wave Buoys Based on Significant Wave Height Observations of Altimeters in the Northern Hemisphere.” Remote Sensing 12 (20). doi:https://doi.org/10.3390/rs12203447.
- Wang, P. C. and J. Y. Sheng. 2018. “Tidal Modulation of Surface Gravity Waves in the Gulf of Maine.” Journal of Physical Oceanography 48 (10): 2305–2323. doi:https://doi.org/10.1175/Jpo-D-17-0250.1.
- Wang, X. F. and K. Ichikawa. 2017. “Coastal Waveform Retracking for Jason-2 Altimeter Data Based on Along-Track Echograms Around the Tsushima Islands in Japan.” Remote Sensing 9 (7). doi:https://doi.org/10.3390/rs9070762.
- Wingham, D. J., C. R. Francis, S. Baker, C. Bouzinac, D. Brockley, R. Cullen, P. de Chateau-Thierry et al. 2006. ”CryoSat: A Mission to Determine the Fluctuations in Earth’s Land and Marine Ice Fields.” Advances in Space Research 37 (4): 841–871. doi:https://doi.org/10.1016/j.asr.2005.07.027.
- Woo, H. J. and K. A. Park. 2017. “Long-Term Trend of Satellite-Observed Significant Wave Height and Impact on Ecosystem in the East/japan Sea.” Deep Sea Research Part II: Topical Studies in Oceanography 143: 1–14. doi:https://doi.org/10.1016/j.dsr2.2016.09.003.
- Yang, J. G. and J. Zhang. 2019. “Validation of Sentinel-3A/B Satellite Altimetry Wave Heights with Buoy and Jason-3 Data.” Sensors 19 (13). doi:https://doi.org/10.3390/s19132914.
- Yang, J. G., J. Zhang, and C. Y. Wang. 2019. “Sentinel-3A SRAL Global Statistical Assessment and Cross-Calibration with Jason-3.” Remote Sensing 11 (13). doi:https://doi.org/10.3390/rs11131573.
- Yang, J. G., J. Zhang, Y. J. Jia, C. Q. Fan, and W. Cui. 2020. “Validation of Sentinel-3A/B and Jason-3 Altimeter Wind Speeds and Significant Wave Heights Using Buoy and ASCAT Data.” Remote Sensing 12 (13). doi:https://doi.org/10.3390/rs12132079.
- Yang, L., M. S. Lin, Q. H. Liu, and D. L. Pan. 2012. “A Coastal Altimetry Retracking Strategy Based on Waveform Classification and Sub-Waveform Extraction.” International Journal of Remote Sensing 33 (24): 7806–7819. doi:https://doi.org/10.1080/01431161.2012.701350.
- You, S. H. 2009. “Marine Meteorological Characteristics in 2006-2007 Year Near the Korean Peninsular: Wind Waves.” Atmosphere 19 (1): 93–106.
- Young, I. R., S. Zieger, and A. V. Babanin. 2011. “Global Trends in Wind Speed and Wave Height.” Science 332 (6028): 451–455. doi:https://doi.org/10.1126/science.1197219.
- Zhang, H. F., Q. Wu, and G. Chen. 2015. “Validation of HY-2A Remotely Sensed Wave Heights Against Buoy Data and Jason-2 Altimeter Measurements.” Journal of Atmospheric and Oceanic Technology 32 (6): 1270–1280. doi:https://doi.org/10.1175/Jtech-D-14-00194.1.
- Zieger, S., J. Vinoth, and I. R. Young. 2009. “Joint Calibration of Multiplatform Altimeter Measurements of Wind Speed and Wave Height Over the Past 20 Years.” Journal of Atmospheric and Oceanic Technology 26 (12): 2549–2564. doi:https://doi.org/10.1175/2009jtecha1303.1.