
 ?Mathematical formulae have been encoded as MathML and are displayed in this HTML version using MathJax in order to improve their display. Uncheck the box to turn MathJax off. This feature requires Javascript. Click on a formula to zoom.
ABSTRACT
Spectral indices derived from satellite optical remote sensing data have typically been used for fire severity estimation, although other remote sensing systems such as Light Detection and Ranging (LiDAR) are increasingly applied. Despite a multitude of remotely sensed fire severity estimation methods, comparisons of method performance are few. Insights into the merits and limitations of remotely sensed fire severity methods help develop appropriate spatial tools for the management of fire-affected areas. We evaluated the performance of seven passive (optical) and active (LiDAR) remotely sensed fire severity estimation methods in classifying and explaining variation in a field-estimated modified Composite Burn Index (MCBI) for a recent large wildfire in south-eastern Australia. Our evaluation included three commonly applied indices; the differenced Normalized Burn Ratio (dNBR), Relative dNBR (RdNBR) and Relative Burn Ratio (RBR). We compared these NBR indices against two recently proposed fire severity estimation methods that have not previously been evaluated with CBI field data – the Vegetation Structure Perpendicular Index (VSPI) spectral index and the LiDAR point cloud-derived Profile Area Change (PAC), along with experimental relativized forms of these indices (RVSPI and RPAC, respectively). The RVSPI (κ = 0.47) demonstrated similar overall classification accuracy (N classes = 4) to the PAC (κ = 0.48), however both indices had lower classification accuracy than the dNBR (κ = 0.59), RdNBR (κ = 0.59) and RBR (κ = 0.61). The VSPI and PAC were unable to accurately represent non-structural changes caused by lower severity fire. Application of these optical and LiDAR indices should consider their discussed limitations in relation to the objectives of their application.
1. Introduction
Fire severity describes the degree of immediate post-fire effects on the remaining local vegetation and landscape (Lentile et al. Citation2006; Tolhurst and McCarthy Citation2016), and is distinct from burn severity, which commonly describes longer-term fire effects (Key Citation2006; Morgan et al. Citation2014). Accurate quantification of fire severity is essential for assessing fire effects on ecological processes and natural resources (Keeley, Fotheringham and Baer-Keeley Citation2005; Smith et al. Citation2011), understanding spatial patterns of fire behaviour and suppressibility (Bradstock et al. Citation2010; Ndalila, Williamson and Bowman Citation2018), and informing post-fire management interventions (Brewer et al. Citation2005). Recent research on fire regime characteristics emphasizes the importance of accurately quantifying the complete range of possible fire severities, from low severity fire that consumes only surface fuel to high severity fire that consumes the uppermost stratum of vegetation assemblages (Chafer Citation2008; Bradstock Citation2009; Stambaugh, Hammer and Godfrey Citation2015).
Attributes used to describe fire severity include tree mortality (Chappell and Agee Citation1996), canopy scorch and consumption (Doerr et al. Citation2006), and change in vegetation cover and soil condition (Turner et al. Citation1994; Rogan and Yool Citation2001). However, such attributes may not be directly discernible to remote sensors (Roy, Boschetti and Trigg Citation2006; Gale et al. Citation2021). Understanding the correlation of remotely sensed fire severity with field estimates is required to parameterize and assess the accuracy of these methods (Cocke, Fulé and Crouse Citation2005; Epting, Verbyla and Sorbel Citation2005). To these aims, the Composite Burn Index (CBI) (Key and Benson Citation2005) field sampling protocol, and its modified version GeoCBI (De Santis and Chuvieco Citation2009), were developed to bridge the gap between optical remote sensing and fine-scale fire effects. The CBI combines ratings of fire effects concerning soil and various vegetation strata to derive plot-level fire severity index values and is widely used to parameterize, classify, and evaluate remotely sensed estimates (Miller and Thode Citation2007; Soverel, Perrakis and Coops Citation2010; Parks, Dillon and Miller Citation2014; Yin et al. Citation2020).
Various remote sensing methods have been developed to estimate fire severity at a landscape scale, and these methods use a diversity of remote sensing systems. Satellite-based optical remote sensors are commonly applied (Key and Benson Citation2005; Miller and Thode Citation2007; Parks, Dillon and Miller Citation2014; Massetti et al. Citation2019; Yin et al. Citation2020), although other systems are also increasingly used, including Light Detection and Ranging (LiDAR) (Hu et al. Citation2019), Synthetic Aperture Radar (SAR) (Tanase et al. Citation2010; Addison and Oommen Citation2018) and passive microwave observations (Chen et al. Citation2018).
Optical fire severity indices commonly express the change in Normalized Burn Ratio (NBR) (Keeley Citation2009; Lutz et al. Citation2011), either as an absolute change in the form of the differenced NBR (dNBR) (Key and Benson Citation2005) or as a change relative to the pre-fire vegetation condition, such as the Relative dNBR (RdNBR) (Miller and Thode Citation2007) and Relative Burn Ratio (RBR) (Parks, Dillon and Miller Citation2014). The dNBR, RdNBR and RBR are fire severity indices that are frequently applied in operational and research settings (Eidenshink et al. Citation2007; Clark and McKinley Citation2011) and commonly form benchmarks to assess performances of newly developed methods (Addison and Oommen Citation2018; Hu et al. Citation2019; Yin et al. Citation2020). Nonetheless, there is no clear consensus on the overall improvement in index performance resulting from index relativization (Hall et al. Citation2008; Soverel, Perrakis and Coops Citation2010; Tanase, Kennedy and Aponte Citation2015; Yin et al. Citation2020).
In addition to commonly used optical indices, the Vegetation Structure Perpendicular Index (VSPI) (Massetti et al. Citation2019) is a novel optical remote sensing method suggested for estimating fire severity and post-fire recovery in Australian forests. The VSPI is calculated as the perpendicular distance of post-fire pixels in shortwave infrared (SWIR) spectral space, relative to a pre-fire linear regression between two SWIR bands. Representation of SWIR reflectance in this orthogonal design attempts to address issues associated with fire severity estimation from near-infrared (NIR) reflectance, particularly the influence of green vegetation tissues and a poor relationship with woody fuel (Roy, Boschetti and Trigg Citation2006). The VSPI has not been evaluated using CBI field reference data, which would be valuable for understanding its suitability for fire severity and related post-fire recovery applications.
Airborne LiDAR data have become increasingly available and demonstrate promise for characterizing forest disturbance due to their discrimination of the full vertical forest profile (Alonzo et al. Citation2017; McCarley et al. Citation2017b; Meng et al. Citation2018). The Profile Area Change (PAC) (Hu et al. Citation2019) is a novel airborne LiDAR remote sensing index that estimates structural change between pre- and post-fire LiDAR acquisitions. The PAC quantifies the difference in plotted area between pre- and post-fire cumulative LiDAR Height Above Ground (HAG) percentile profiles. By representing change to the full vertical forest profile, the PAC may be advantageous over optical methods of fire severity estimation, which are prone to canopy obscuration (Tanase, Kennedy and Aponte Citation2015; Hu et al. Citation2019). The PAC has demonstrated a strong correlation to change in forest basal area and Leaf Area Index (LAI) (Hu et al. Citation2019). However, the index has not been evaluated using CBI field reference data.
Despite the growing number of remotely sensed fire severity estimation methods (Chuvieco et al. Citation2020), evaluations of the comparative performance of these methods are scarce (Chafer Citation2008; Tanase, Kennedy and Aponte Citation2015; Tran et al. Citation2018). Insights into the performance of fire severity estimation methods in a variety of forest types are important to determining their merits and limitations and opportunities for further development (Cansler and McKenzie Citation2012). Here, we investigated the performance of the commonly used dNBR, RdNBR, and RBR indices, and the recently proposed VSPI and PAC, using Modified CBI (MCBI) field reference data collected following a large wildfire in south-eastern Australia. We additionally tested our own experimental relative forms of the VSPI and PAC (RVSPI and RPAC, respectively) to inform the suitability of transferrable elements of their designs, for fire severity estimation. Further, by comparison of several absolute and relative fire severity indices, we assess the merits and limitations of index relativization for estimating fire severity in a heterogeneously vegetated area.
2. Methods
2.1. Study area
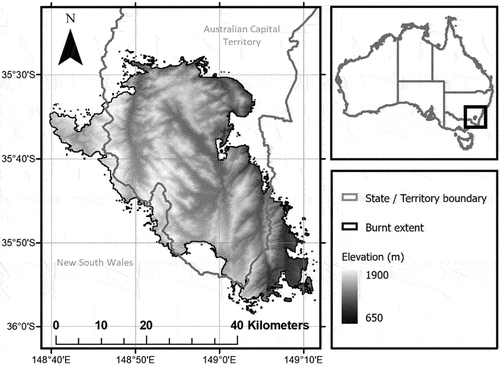
The 2019/20 fire season affected an estimated 5.4 million ha across multiple fires in New South Wales (NSW) and the Australian Capital Territory (ACT) (NSW Department of Planning, Industry and Environment Citation2020). One of these fires, the Orroral Valley Fire (), was used to evaluate the performance of seven remotely sensed fire severity indices. The Orroral Valley Fire burned from late January to mid-February 2020. It affected an estimated 86,562 ha, including a diversity of forest types that burnt under varying fire weather conditions and resulted in a mosaic of fire severity (ACT Environment, Planning and Sustainable Development Directory Citation2020). The Orroral Valley Fire was preceded by intense drought that caused substantial decreases in pre-fire vegetation greenness and moisture. Drought effects were unevenly distributed over the study area due to local climate and terrain effects.
Figure 1. Location of the fire-affected area and associated terrain. the Orroral Valley Fire is designated as the burnt area within the ACT. the majority of the fire area burned from 27 January to 17 February 2020.
2.2. Field data and calculation of the Modified Composite Burn Index
Fire severity field data were collected for the Orroral Valley Fire from 21 to 24 February 2020. The sampling period followed heavy rainfall in early February that reduced fire activity. Data collection shortly after fire minimized the potential influence of post-fire regrowth on field estimates. A total of 291 sampling points were distributed throughout the burn area. These points were randomly located to ensure that the number of sampled fire severity categories approximately reflected their true abundance (Congalton and Green Citation2019).
The CBI field sampling protocol (Key and Benson Citation2005) estimates various fire effects relating to the surface, near-surface (<1 m), understorey (1–5 m), intermediate overstorey, and tall overstorey strata. Safe, on-ground measurement of all CBI indicators was not possible given the short time since fire, large burnt extent, steep terrain, and restricted road access. The CBI strata classification and associated estimates were therefore simplified to accommodate close-proximity aerial estimation via helicopter-based sampling. During sampling, near-surface and understorey strata, and intermediate and tall overstorey strata, were combined to define understorey and canopy strata, respectively. At each sampling point, aerial cover percentage estimates of surface fuel consumption, understorey fuel scorch, canopy scorch, and canopy consumption were recorded for an approximate 25 m radius centred on the sampling point location. These indicators are used in the CBI scoring method with associated thresholds corresponding to stratum scores scaled from 0 (unburnt) to 3 (high severity) (Key and Benson Citation2005). These suggested thresholds were used to rate fire severity for each stratum, and total CBI values were derived by averaging strata scores, as described in Key and Benson (Citation2005). The CBI field sampling protocol may be modified to accommodate sampling limitations or study area characteristics (Hoy et al. Citation2008; Han et al. Citation2021; Giddey, Baard and Kraaij Citation2022). Given our adjustments to the original CBI field sampling protocol, which were required to accommodate safe aerial estimation, we refer to our fire severity field estimates as Modified CBI (MCBI) scores.
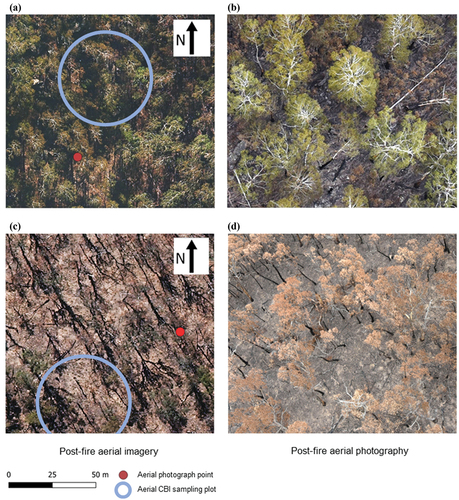
Several geolocated photographs were taken at each sampling point at the time of the helicopter survey, and 10 cm resolution Unmanned Aerial Vehicle (UAV) imagery of the region was acquired in May 2020. Fire severity field estimates were checked for visual agreement with the geolocated aerial photographs and UAV imagery to minimize locational and data collection errors (). Sampling points that exhibited disagreement in fire severity estimates between these data sources were determined to have potential locational error and therefore rejected. From a total of 291 MCBI observations made in the field, 35 were rejected, leaving 256 for evaluation of the fire severity indices.
Figure 2. Example of quality control assessment of two aerial Modified CBI estimates. (a – b) shows a location where visual assessment of fire severity aligns between (a) the 10 cm UAV imagery, (b) adjacent close-range aerial geolocated photograph, and the respective recorded MCBI score (MCBI = 1.33), with all sources indicating lower severity understorey fire. (c – d) shows a location where the assessments do not align between (c) the UAV imagery which indicates green and partially intact canopy, (d) aerial photography which indicates a scorched canopy, and the respective MCBI score (MCBI = 2.50). in the latter case, fine-scale heterogeneity in fire severity caused assessment differences.
2.3. Derivation of optical fire severity indices
Pre- and post-fire Sentinel 2A/B MultiSpectral Instrument (MSI) images were acquired from the Copernicus Open Access Hub (https://scihub.copernicus.eu). Level 2A (L2A) reflectance products for the T55HFA Universal Transverse Mercator (UTM) system tile were sourced, representing scene-classified, radiometrically and terrain-corrected Bottom of Atmosphere (BOA) surface reflectance derived from the Sen2Cor algorithm (Main-Knorn et al. Citation2017). Gridded NBR data were derived (EquationEq. 1(1)
(1) ) for the study area at 20 m resolution using cloud-free Sentinel 2A/B images acquired on 25 January 2020 and 15 March 2020, respectively. Invalid reflectance pixels, caused by topographic effects, cloud cover and other effects, were indicated by Sentinel-2 L2A scene classifications and excluded from fire severity estimates.
The dNBR was calculated as the change in NBR between pre- and post-fire acquisitions following Key and Benson (Citation2005) (EquationEquation (2)(2)
(2) ). The dNBR offset, which incorporates the background change of NBR between image acquisitions in unburnt areas, was not employed for the Orroral Valley Fire due to concern for errors introduced by an offset area being potentially atypical of the broader heterogenous fire-affected area.
Relative versions of the dNBR, in the form of the RdNBR (EquationEquation (3)(3)
(3) ) and RBR (EquationEquation (4)
(4)
(4) ) were calculated following Miller and Thode (Citation2007) and Parks, Dillon and Miller (Citation2014), respectively.
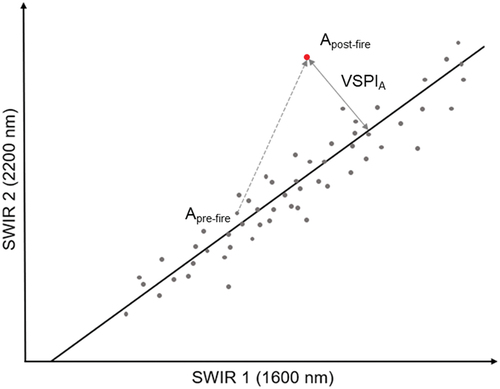
The VSPI pre-fire vegetation line is a linear regression between SWIR reflectance bands centred at 1600 nm (SWIR1) and 2200 nm (SWIR2), taking the form y = mx + b, where m and b are the slope and intercept, respectively (Massetti et al. Citation2019) (). The VSPI vegetation line is assumed to exhibit limited temporal variability and was therefore originally calculated as the average regression across multiple reflectance data acquisitions spanning several years (Massetti et al. Citation2019). For a given pixel (A), VSPI is calculated as the perpendicular displacement of a post-fire SWIR reflectance pair (xA, yA) relative to the pre-fire vegetation line (EquationEquation (5)(5)
(5) ).
Figure 3. Conceptual illustration of the VSPI (Massetti et al. Citation2019). A given pre-fire SWIR reflectance pair (Apre-fire, coloured grey) is displaced in spectral space along the dashed vector to post-fire point (Apost-fire, coloured red), with the perpendicular distance (VSPIA) to the pre-fire vegetation line representing fire severity.
To appropriately evaluate the potential for an orthogonal SWIR index to estimate fire severity, we examined the suitability and generality of methodological aspects of the VSPI. The results of these investigations prompted development of an experimental Relative VSPI (RVSPI). Methods and results of the preliminary analyses are presented in Supplementary Materials 1 and 2. To summarize, preliminary analyses demonstrated strong temporal variation in the VSPI vegetation line slope and intercept parameters (Supplementary Material 1). This variation was significantly explained (p < 0.01) by drought effects, as represented by anomalies of remotely sensed Live Fuel Moisture Content (LFMC) (Figure SM1.3). A time-series averaged vegetation line was therefore not considered appropriate for our definition and field estimation of fire severity, which relates only to fire-caused change. We also examined the correlation between VSPI and pre-fire SWIR reflectance values used in its computation (Supplementary Material 2). Previous evaluations of spectral indices indicate potential estimation bias that has been attributed to unrealistic correlations between indices and pre-fire reflectance values (Miller and Thode Citation2007; Parks, Dillon and Miller Citation2014). We found a moderate positive correlation between VSPI and pre-fire SWIR reflectance, which was dissimilar to no correlation between MCBI and pre-fire SWIR (Figure SM2.1). Given this preliminary finding, we developed a relative version of the VSPI, RVSPI (EquationEquation (6)(6)
(6) ), which removes the correlation between VSPI and pre-fire SWIR reflectance. A single pre-fire image acquired on 25 January 2020, closest to the outbreak of the study fire, was used to calculate a single-acquisition VSPI – referred to as VSPI(S). To form the RVSPI, the VSPI(S) was relativized by the sum of pre-fire SWIR reflectance pairs, via methods similar to Miller and Thode (Citation2007), whereby index values are scaled to the same order of magnitude as the original VSPI:
2.4. Derivation of LiDAR fire severity indices
LiDAR fire severity estimates were derived from bi-temporal airborne point cloud data acquired for the ACT during periods 18 May 2015 to 29 July 2016 (pre-fire) and 13 April 2020 to 15 May 2020 (post-fire). Airborne LiDAR data were collected over large areas, for a variety of purposes, and without preconceived intention of fire severity estimation. The two LiDAR acquisitions differed slightly in their characteristics (). Raw waveform LiDAR data were converted into discrete returns and classified by the data providers to LAS version 1.4. A Digital Elevation Model (DEM) was derived from the 2020 LiDAR acquisition using a Triangular Irregular Network of ground-classified LiDAR returns.
Table 1. Airborne LiDAR data quality information
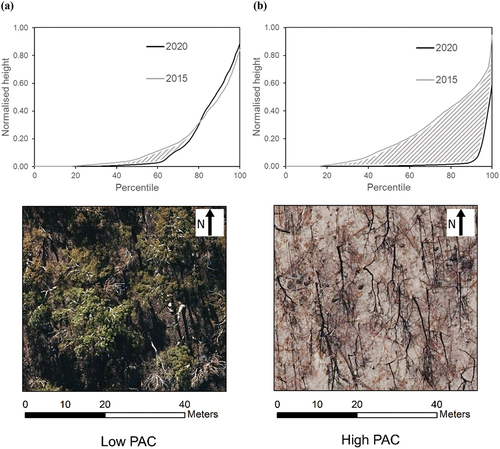
The Profile Area Change (PAC) method of bi-temporal LiDAR fire severity estimation (Hu et al. Citation2019) quantifies the difference between pre- and post-fire LiDAR return Height Above Ground (HAG) Profile Areas (PAs) (). The PAC was derived at 25 m gridded resolution for the Orroral Valley Fire study area. Following initial grid indexation of returns from 2015 to 2020 LiDAR acquisitions, HAG was calculated for each vegetation and ground classified LiDAR return relative to the nearest 1 m resolution 2020 DEM pixel. The 2020-acquired DEM was preferred for HAG calculation due to higher acquisition point densities and locational accuracies (). Preliminary testing indicated non-systematic inconsistencies in the ground heights determined by the 2015 and 2020 LiDAR datasets. For each 25 m indexed area, the 2015 LiDAR HAGs were normalized to the 2020 LiDAR HAGs by adding the median height difference between ground-classified returns of the datasets. LiDAR HAGs were normalized by the maximum return height and plotted against their respective cumulative height percentiles (P) (), and 2015 and 2020 PAs were calculated as the sum of equally spaced percentiles that formed the x-axis. The PAC was derived for a given pixel (xm, ym) as the difference between pre- and post-fire profile areas (EquationEquation (7)(7)
(7) ). Approximation of PA through summation of equally spaced percentiles that formed the x-axis was preferred relative to use of an integral of a fitted curve given difficulties in fitting accurate curves to the complex relationships between P and HAG.
Figure 4. Demonstration of PAC (Hu et al. Citation2019) for (a) lower severity and (b) higher severity areas of the Orroral Valley Fire study area. Plots (top) illustrate 2015 and 2020 LiDAR PA curves with the PAC represented by the shaded areas. Aerial images (bottom) show corresponding post-fire areas.
We argue, for general reasons common to change-derived fire severity indices, that pre-fire PA may be influential in determining the magnitude of PAC resulting from fire by, for example, limiting PAC in sparse vegetation. We therefore proposed an experimental Relative PAC (RPAC) which considers the pre-fire PA, as denominator to EquationEquation (8)(8)
(8) , via methods similar to Miller and Thode (Citation2007).
2.5. Comparison of remotely sensed fire severity indices to MCBI data
The relative performances of the seven remotely sensed fire severity indices (Sections 2.3 and 2.4) were evaluated by comparing their accuracies in classifying MCBI and their overall statistical correlations to MCBI. For each fire severity index, linear, exponential, and piecewise regression models were fitted to the MCBI data for the Orroral Valley Fire. Model selection for fire severity classification threshold calculation can be informed by comparing coefficients of determination and Akaike Information Criteria (AIC) (Miller and Thode Citation2007; Soverel, Perrakis and Coops Citation2010). However, due to concerns of the effect of piecewise linear regression breakpoints, classification accuracies were calculated for each regression model fitted to each index, using threshold values corresponding to MCBI categories calculated from regression model parameters. Classification accuracy was indicated by Cohen’s kappa coefficient (κ), which is a measure of agreement between two assessment methods that incorporates the level of possible agreement by chance and is considered more robust than simple measures of overall agreement (Vieira, Kaymak and Sousa Citation2010; Tang et al. Citation2015). For each fire severity index, classification accuracy was determined as the maximum κ across the three tested regression models. The CBI thresholds of Miller and Thode (Citation2007), as adapted from Key and Benson (Citation2005), were used to categorize MCBI into four fire severity categories, defined as: unchanged (MCBI <0.1), low (0.1 ≤ MCBI <1.25), moderate (1.25 ≤ MCBI <2.25), and high (MCBI ≥2.25) (N classes = 4). Further, the performances of remotely sensed fire severity indices in identifying areas of high severity fire (MCBI ≥2.25, N classes = 2) were compared using the same classification accuracy assessment methods.
Statistical correlations between MCBI and fire severity indices were compared using both Pearson correlation and Spearman rank correlation coefficients. Spearman rank correlation indicates the strength of a monotonic but not necessarily linear relationship between two variables (Schober, Boer and Schwarte Citation2018). Remotely sensed fire severity indices can demonstrate non-linear relationships to field-estimated CBI (Soverel, Perrakis and Coops Citation2010). However, a strong non-linear correlation may not always indicate good index performance, but rather, for instance, a lack of sensitivity of an index to a particular range of fire severities. Pearson correlation indicates the strength of linear correlation between two variables (Schober, Boer and Schwarte Citation2018). Although linear correlation between remotely sensed fire severity indices and MCBI will generally indicate good index performance, a well-performing index that is sensitive to the full range of fire severity could possibly be better described as having a non-linear relationship to MCBI. Pearson correlation and Spearman rank correlation coefficients and their 95% confidence intervals were calculated using the software ‘R’ and associated ‘DescTools’ package (Signorell et al. Citation2018).
3. Results
The commonly applied NBR-based fire severity spectral indices – dNBR, RdNBR, and RBR – provided better performance in classifying MCBI (N classes = 4) relative to the VSPI, PAC, and their relativized forms RVSPI and RPAC (). NBR-based indices also had significantly higher correlations to MCBI (). Of all remote sensing indices that were evaluated, the RBR demonstrated the highest classification accuracy (κ = 0.61), strongest correlations to MCBI (ρ = 0.92, r = 0.88), and highest explained variance of MCBI (R2 = 0.82). While the dNBR, RdNBR and RBR demonstrated best performance with class thresholds derived from exponential regression, the VSPI, RVSPI, PAC and RPAC demonstrated discontinuous relationships with MCBI and performed best with thresholds derived from piecewise linear regression (). A single breakpoint was applied to piecewise linear regressions due to concerns of model overfitting. However, as indicated by the substantial differences between the two linear regressions applied per piecewise linear model (), the VSPI, RVSPI, PAC and RPAC demonstrated poor sensitivity to lower severity fire (MCBI <2.25). This caused low classification accuracy of unburnt, low, and moderate severity classes for VSPI, RVSI, PAC and RPAC (Supplementary Material 3).
Figure 5. Comparison of correlations between modified CBI and remotely sensed fire severity estimates, indicated by Pearson’s r and Spearman’s ρ coefficients. Points represent modelled coefficients ±95% confidence intervals.
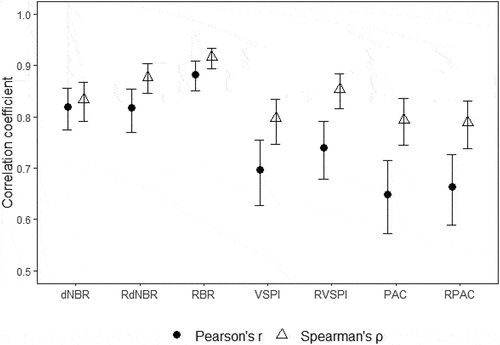
Figure 6. Regression of Modified CBI for the Orroral Valley Fire study area with remotely sensed VSPI, RVSPI, PAC and RPAC via piecewise linear regression, and dNBR, RBR and RdNBR via exponential regression. Displayed regression models are the best-performing models in classification accuracy analyses. Plotted lines represent modelled conditional means ± standard error.
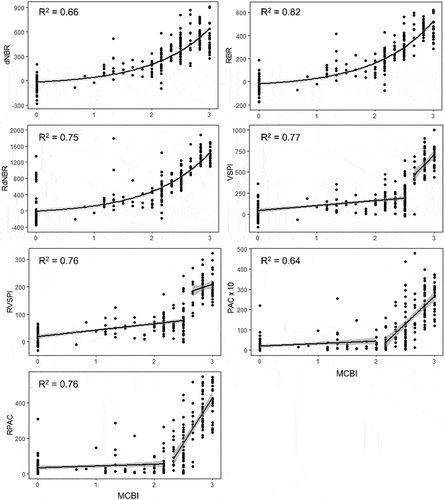
Table 2. Comparison of overall Kappa statistics for remotely sensed fire severity indices using thresholds derived from linear, exponential and piecewise linear regression models. Bold text indicates the most accurately classified model for each remotely sensed index
Relative versions of spectral indices demonstrated only minor improvements in classification accuracy compared to their original absolute versions (). The RVSPI (κ = 0.47) showed minor improvement over the VSPI (κ = 0.40). Similarly, the RBR (κ = 0.61) demonstrated minor improvement over the dNBR (κ = 0.59), though no improvement was evident for the RdNBR (κ = 0.59). In contrast, the RPAC (κ = 0.42) demonstrated lesser classification accuracy than the PAC (κ = 0.48). Despite demonstrating limited sensitivity to low and moderate severity fire, the PAC and RVSPI demonstrated performance comparable to the dNBR, RdNBR, and RBR when classifying areas of high severity fire (MCBI >2.25, N classes = 2) ().
4. Discussion
The VSPI and PAC are novel methods that have shown promise for estimating fire severity and recovery over large areas (Hu et al. Citation2019; Massetti et al. Citation2019). Although these methods are oriented towards detecting structural indicators of fire severity, they did not perform as well as NBR-based methods when evaluated using modified CBI field reference data. For the heterogeneously vegetated and burnt study area, RBR had the highest classification accuracy and correlation to MCBI, while dNBR and RdNBR demonstrated similar performances to each other. Our findings highlight the advantages and challenges associated with remotely sensed fire severity estimation using SWIR reflectance incorporated in the VSPI (Section 4.1), LiDAR point cloud data (Section 4.2), and the NBR (Section 4.3). We provide recommendations and considerations for the application and further development of the remote sensing indices that were evaluated.
4.1. Evaluation of the Vegetation Structure Perpendicular Index
Following modifications to address potential limitations of the VSPI (see Supplementary Materials 1 and 2), our experimental RVSPI showed only minor improvement in classifying MCBI, though accuracy was lower than the computationally simpler dNBR, RdNBR, and RBR. This suggests that the VSPI limitations we addressed are secondary to broader issues relating to the sole use of SWIR reflectance and orthogonal index design in an index intended to estimate fire severity.
Empirical and radiative transfer modelling studies demonstrate that SWIR reflectance is sensitive to a combination of interacting leaf and canopy-level properties, including vegetation and soil moisture, Leaf Area Index (LAI), fractional vegetation cover, and charred materials (Dawson et al. Citation1999; Bowyer and Danson Citation2004; Key and Benson Citation2005; Chuvieco et al. Citation2006; Miller and Thode Citation2007). Perpendicular displacement in SWIR spectral space enhances sensitivity to LAI (Massetti Citation2019) and can reduce sensitivity to characteristics related to photosynthetic activity, such as vegetation greenness and moisture (Trigg and Flasse Citation2001), although this correlation may weaken substantially as LAI increases in denser canopied forests (Xiao et al. Citation2013). Our results suggest that reduced sensitivity to photosynthetic characteristics may also reduce the VSPI’s ability to quantify lower severity fire, since these characteristics are critical indicators of low and moderate severity (Key and Benson Citation2005; Chuvieco et al. Citation2006; Miller and Thode Citation2007). Further, by itself, change in LAI is generally limited to higher severity, canopy-consuming fire (Key and Benson Citation2005; Gibson et al. Citation2020), and this is reflected by the location and magnitude of breakpoints in the piecewise linear regressions of VSPI and RVSPI (MCBI = 2.67).
Further issues with use of orthogonal indices such as VSPI may arise from their sensitivity to sun-surface-sensor geometries and associated topographic effects. Although reflectance band ratio indices, such as the Normalized Difference Vegetation Index and NBR, are generally considered unaffected by variation in sun-surface-sensor geometries, perpendicular indices such as the Perpendicular Vegetation Index (PVI) (Richardson and Wiegand Citation1977) are more sensitive to these effects (Bannari et al. Citation1995; Matsushita et al. Citation2007). Given that the VSPI employs a similar design to the PVI, and wavelengths that are sensitive to sun-surface-sensor geometries (Mousivand et al. Citation2014), uncertainties may be introduced by topographic and seasonal variation of index values. More shadowed surfaces, such as south-facing slopes, may exhibit generally lower perpendicular displacements due to reduced brightness (Bannari et al. Citation1995), although these effects are likely reduced by reflectance standardization techniques (Huete et al. Citation2002).
4.2. Evaluation of the Profile Area Change index
Our findings demonstrate challenges associated with fire severity estimation over large areas using bi-temporal airborne LiDAR data. Bi-temporal single wavelength LiDAR point cloud data have been increasingly used to estimate changes to forest structure (Alonzo et al. Citation2017; McCarley et al. Citation2017b; Hoe, Dunn and Temesgen Citation2018; Meng et al. Citation2018), but are usually applied in combination with other remote sensing observations. The PAC can robustly infer changes to forest structure, as indicated by LAI and basal area (Hu et al. Citation2019). However, single wavelength airborne LiDAR systems have limited ability to infer non-structural vegetation characteristics (McCarley et al. Citation2017b). As a result, the PAC does not respond to vegetation biochemical properties, such as the distinction between live and dead vegetation, or other fire-induced changes such as soil colour. These properties are important indicators of fire severity, particularly at lower severities (Chuvieco et al. Citation2006; Miller and Thode Citation2007), and are inputs into the MCBI data that were used for our evaluation (Key and Benson Citation2005) (Section 2.2). As a result, PAC and RPAC showed weak sensitivities to low and moderate severity fire (MCBI <2.25) ().
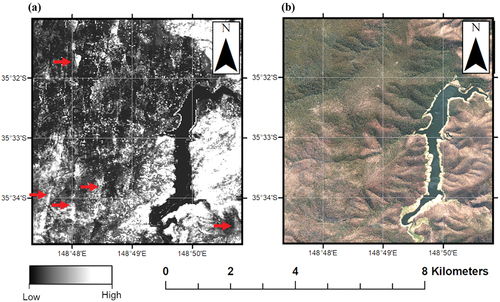
Although our experimental RPAC increased model explained variance (R2 = 0.76) relative to the PAC (R2 = 0.64) (), it did not improve MCBI classification accuracy. Additional modifications to the PAC may further improve its performance. First, there is growing application of LiDAR return intensity information and fusion of multispectral imagery to complement LiDAR-derived vegetation structure information with biochemical information (Moffiet et al. Citation2005; Gaulton et al. Citation2013; Wei et al. Citation2012; McCarley et al. Citation2017b; Hoe, Dunn and Temesgen Citation2018; Meng et al. Citation2018), which may warrant consideration for profile area-based methods. Second, differences in LiDAR acquisition characteristics between pre- and post-fire LiDAR datasets, in particular scan angle, are likely to introduce uncertainty in PAC and RPAC estimated fire severity. We applied LiDAR profile area methods of fire severity estimation in forests when using broad-scale LiDAR data that was not collected specifically for estimating fire severity. Differences in acquisition characteristics between the pre- and post-fire LiDAR datasets may have introduced some degree of error. However, given the costs associated with broad-scale airborne LiDAR data, we argue that our evaluation of the PAC is more typical of its likely application. We observed artefacts in PAC and RPAC fire severity maps () that correspond to airborne LiDAR flight paths, which are likely representations of variation in LiDAR scan angle. Detection of vegetation using airborne LiDAR systems is strongly affected by LiDAR scan angle (Liu et al. Citation2018), suggesting that a change in profile area may represent a change in scan angle rather than a change in vegetation structure. Use of profile area methods may require calibration to account for LiDAR scan angle and vegetation leaf inclination (Solberg et al. Citation2009; Korhonen et al. Citation2011).
Figure 7. Comparison of (a) PAC estimated fire severity for a section of the Orroral Valley Fire to (b) corresponding post-fire aerial image. Straight line artefacts resembling airborne LiDAR flight paths (indicated by red arrows) are not represented in the post-fire UAV imagery and are likely caused by differences in scan angle between pre- and post-fire acquisitions.
4.3. Comparison of Normalised Burn Ratio fire severity indices
Our results regarding the comparatively well-studied NBR-based fire severity indices complement existing knowledge of these methods. Relationships between MCBI and NBR-based indices showed sensitivity to low and moderate severity fire (), but also displayed non-linear relationships consistent with previous studies using CBI data (van Wagtendonk, Root and Key Citation2004; Key Citation2006; Hall et al. Citation2008; Soverel, Perrakis and Coops Citation2010; Yin et al. Citation2020). This exponential relationship has been attributed to low sensitivity of the dNBR to the consumption of surface and understorey forest layers (De Santis and Chuvieco Citation2007; Hoy et al. Citation2008).
The Orroral Valley Fire study area varied substantially in pre-fire vegetation characteristics and subsequently pre-fire NBR, suggesting that relativized versions of the dNBR may be more suited to the study area (Miller and Thode Citation2007; Parks, Dillon and Miller Citation2014). Spatial variation in pre-fire NBR was exaggerated by the severe pre-fire drought, whereby the rain-shadowed eastern part of the study area received less rain than the western part. Despite substantial and drought-exacerbated pre-fire heterogeneity in the study area, we found only marginal improvement in performance of the dNBR via its relative form, RBR, and minimal differences in classification accuracies and correlations between dNBR and RdNBR. Improved classification accuracy and explained variance of the RBR compared to the RdNBR may be a result of the reduction of anomalous index values that can arise in the RdNBR in very low pre-fire NBR areas (McCarley et al. Citation2017a; Parks, Dillon and Miller Citation2014), which were common in the Orroral Valley Fire. More generally, however, the advantages of the RBR for deriving specific biological and operational inferences are unclear given the amount of biophysical information that is condensed into our MCBI scores.
Previous studies have reported differences in the comparative performance of the dNBR and its relativized forms. In eucalypt forest types, Tanase, Kennedy and Aponte (Citation2015) determined no improvement in classification Overall Accuracy (OA) for the RBR compared to the dNBR (OA = 0.62 and 0.74, respectively). Similarly, Yin et al. (Citation2020) observed little difference in classification accuracy between the dNBR and RdNBR in Australian savannah (κ = 0.25–0.30 and 0.06–0.31, respectively). In coniferous forest types, only minor or no improvements in performance have been demonstrated when using relativized forms of the dNBR (Hudak et al. Citation2007; Miller and Thode Citation2007; Wulder et al. Citation2007; Soverel, Perrakis and Coops Citation2010; Lhermitte et al. Citation2011; Parks, Dillon and Miller Citation2014; Tanase, Kennedy and Aponte Citation2015). Although Miller and Thode (Citation2007) suggest that relativization can improve identification of high fire severity areas, we found only minor improvement in accuracy when using the RBR to classify high severity fire (N classes = 2; ). However, we observed the dNBR to perform worse for high-severity fire in drought-affected dry sclerophyll forests characterized by low pre-fire NBR, which aligns with the premises of relative indices (Miller and Thode Citation2007; Parks, Dillon and Miller Citation2014). For general fire severity estimation purposes in highly heterogenous forests, our findings suggest that the RBR may provide minor improvements in performance relative to the dNBR. However, differences in performance between the NBR-based indices were small, and this is supported by the literature. As a result, we suggest that method selection should primarily consider what index best aligns with the user’s definition of fire severity and intended application of fire severity information, noting the distinction between absolute and relative representations of change.
4.4. Research limitations and recommendations
Despite the size and diversity of the 86,562 ha Orroral Valley Fire, our evaluations of classification accuracy were limited to this particular area. Further, the CBI reference data combine various indicators of fire effects into a single continuous and holistic index, but it is not the only field-based indicator of fire severity (Chappell and Agee Citation1996; Rogan and Yool Citation2001; Doerr et al. Citation2006). The CBI may be limited in spectral uniqueness across its range of index values, and therefore not ideally suited to evaluation of optical remote sensing methods (De Santis and Chuvieco Citation2009). Our modified aerial-based CBI field estimates, which were simplified to accommodate field access constraints, may provide less detailed and continuous information of some fire effects that are important for specific biological and operational applications, relative to ground-based CBI estimates. Further, our aerial-based approach may have introduced some locational and visual assessment errors. Despite these limitations, we were able to determine important differences in remotely sensed fire severity index performance. Further comparison of NBR-based indices and other recent remotely sensed methods (e.g. Tanase et al. Citation2010; Quintano, Fernández-Manso and Fernández-Manso Citation2018; Fernandez-Carrillo, McCaw and Tanase Citation2019; Gibson et al. Citation2020; Yin et al. Citation2020) against field-based indicators would further inform the application of remote sensing data for fire severity estimation.
5. Conclusions
We compared the performance of commonly applied spectral indices and two recently proposed fire severity indices, which use passive (optical) and active (LiDAR) remote sensing information. The RBR provided the highest classification accuracy and correlation to MCBI field reference data. Overall, relative indices generally provided minimal improvements in performance despite the highly heterogenous and drought-affected study area. The VSPI and PAC, and our experimental relative forms RVPSI and RPAC, were unable to distinguish areas of low and moderate severity fire. Although the designs of the VSPI and PAC, and our experimental relative forms RVPSI and RPAC, emphasize structural change, many definitions and field measurements of fire severity consider a range of observable fire-caused changes that are less represented by these estimation methods. The use of the indices investigated and derived in this study should consider their discussed advantages and limitations in relation to the objective of their application.
Supplementary_material_3_clean.docx
Download MS Word (31.9 KB)Supplementary_material_2_clean.docx
Download MS Word (275.9 KB)Supplementary_material_1_clean.docx
Download MS Word (737.9 KB)Acknowledgements
We thank Liam Steel for advice on field data quality control.
Disclosure statement
No potential conflict of interest was reported by the author(s).
Data availability statement
Some data that support this study were obtained from the ACT EPSDD by permission. This data may be shared upon reasonable request to the corresponding author subject to permission from the ACT EPSDD. Other data that support this study will be shared upon reasonable request to the corresponding author.
Supplementary material
Supplemental data for this article can be accessed here
Additional information
Funding
References
- ACT EPSDD. 2020. ACT Bushfire and Flood Recovery Plan. Canberra: ACT EPSDD.
- Addison, P. and T. Oommen. 2018. “Utilising Satellite Radar Remote Sensing for Burn Severity Estimation.” International Journal of Applied Earth Observation and Geoinformation 73: 292–299.
- Alonzo, M., D. C. Morton, B. D. Cook, H.-E. Andersen, C. Babcock, and R. Pattison. 2017. “Patterns of Canopy and Surface Layer Consumption in a Boreal Forest Fire from Repeat Airborne Lidar.” Environmental Research Letters 12 (6): 065004. doi:https://doi.org/10.1088/1748-9326/aa6ade.
- Bannari, A., D. Morin, F. Bonn, and A. Huete. 1995. “A Review of Vegetation Indices.” Remote Sensing Reviews 13 (1–2): 95–120. doi:https://doi.org/10.1080/02757259509532298.
- Bowyer, P. and F. M. Danson. 2004. “Sensitivity of Spectral Reflectance to Variation in Live Fuel Moisture Content at Leaf and Canopy Level.” Remote Sensing of Environment 92 (3): 297–308. doi:https://doi.org/10.1016/j.rse.2004.05.020.
- Bradstock, R. A. 2009. “Effects of Large Fires on Biodiversity in Southeastern Australia: Disaster or Template for Diversity?” International Journal of Wildland Fire 17: 809–822.
- Bradstock, R. A., K. A. Hammill, L. Collins, and O. Price. 2010. “Effects of Weather, Fuel and Terrain on Fire Severity in Topographically Diverse Landscapes of Southeastern Australia.” Landscape Ecology 25 (4): 607–619. doi:https://doi.org/10.1007/s10980-009-9443-8.
- Brewer, C. K., J. C. Winne, R. L. Redmond, D. W. Opitz, and M. V. Mangrich. 2005. “Classifying and Mapping Wildfire Severity.” Photogrammetric Engineering & Remote Sensing 71 (11): 1311–1320. doi:https://doi.org/10.14358/PERS.71.11.1311.
- Cansler, C. A. and D. McKenzie. 2012. “How Robust are Burn Severity Indices When Applied in a New Region? Evaluation of Alternate Field-Based and Remote-Sensing Methods.” Remote Sensing 4: 456–483.
- Chafer, C. J. 2008. “A Comparison of Fire Severity Measures: An Australian Example and Implications for Predicting Major Areas of Soil Erosion.” Catena 74 (3): 235–245. doi:https://doi.org/10.1016/j.catena.2007.12.005.
- Chappell, C. B. and J. K. Agee. 1996. “Fire Severity and Tree Seedling Establishment in Abies Magnifica Forests, Southern Cascades, Oregon.” Ecological Applications 6: 628–640.
- Chen, X., Y. Y. Liu, J. P. Evans, R. M. Parinussa, A. I. J. M. van Dijk, and M. Yebra. 2018. “Estimating Fire Severity and Carbon Emissions Over Australian Tropical Savannas Based on Passive Microwave Satellite Observations.” International Journal of Remote Sensing 39 (20): 6479–6498. doi:https://doi.org/10.1080/01431161.2018.1460507.
- Chuvieco, E., I. Aguado, J. Salas, M. García, M. Yebra, and P. Oliva. 2020. “Satellite Remote Sensing Contributions to Wildland Fire Science and Management.” Current Forestry Reports 6 (2): 81–96. doi:https://doi.org/10.1007/s40725-020-00116-5.
- Chuvieco, E., I. González, F. Verdú, I. Aguado, and M. Yebra. 2009. “Prediction of Fire Occurrence from Live Fuel Moisture Content Measurements in a Mediterranean Ecosystem.” International Journal of Wildland Fire 18 (4): 430–441. doi:https://doi.org/10.1071/WF08020.
- Chuvieco, E., D. Riaño, F. Danson, and P. Martin. 2006. “Use of a Radiative Transfer Model to Simulate the Postfire Spectral Response to Burn Severity.” Journal of Geophysical Research: Biogeosciences 111 (G4). doi:https://doi.org/10.1029/2005JG000143.
- Clark, J. and R. McKinley. 2011. “Remote Sensing and Geospatial Support to Burned Area Emergency Response Teams.” Fire Management Today 71: 15.
- Cocke, A. E., P. Z. Fulé, and J. E. Crouse. 2005. “Comparison of Burn Severity Assessments Using Differenced Normalised Burn Ratio and Ground Data.” International Journal of Wildland Fire 14 (2): 189–198. doi:https://doi.org/10.1071/WF04010.
- Congalton, R. G. and K. Green. 2019. Assessing the Accuracy of Remotely Sensed Data: Principles and Practices. Boca Raton: CRC press.
- Dawson, T. P., P. J. Curran, P. R. J. North, and S. E. Plummer. 1999. “The Propagation of Foliar Biochemical Absorption Features in Forest Canopy Reflectance: A Theoretical Analysis.” Remote Sensing of Environment 67 (2): 147–159. doi:https://doi.org/10.1016/S0034-4257(98)00081-9.
- De Santis, A. and E. Chuvieco. 2007. “Burn Severity Estimation from Remotely Sensed Data: Performance of Simulation versus Empirical Models.” Remote Sensing of Environment 108 (4): 422–435. doi:https://doi.org/10.1016/j.rse.2006.11.022.
- De Santis, A. and E. Chuvieco. 2009. “GeoCbi: A Modified Version of the Composite Burn Index for the Initial Assessment of the Short-Term Burn Severity from Remotely Sensed Data.” Remote Sensing of Environment 113 (3): 554–562. doi:https://doi.org/10.1016/j.rse.2008.10.011.
- Doerr, S., R. Shakesby, W. Blake, C. Chafer, G. Humphreys, and P. Wallbrink. 2006. “Effects of Differing Wildfire Severities on Soil Wettability and Implications for Hydrological Response.” Journal of Hydrology 319 (1–4): 295–311. doi:https://doi.org/10.1016/j.jhydrol.2005.06.038.
- Eidenshink, J., B. Schwind, K. Brewer, Z.-L. Zhu, B. Quayle, and S. Howard. 2007. “A Project for Monitoring Trends in Burn Severity.” Fire Ecology 3 (1): 3–21. doi:https://doi.org/10.4996/fireecology.0301003.
- Epting, J., D. Verbyla, and B. Sorbel. 2005. “Evaluation of Remotely Sensed Indices for Assessing Burn Severity in Interior Alaska Using Landsat TM and ETM+.” Remote Sensing of Environment 96 (3–4): 328–339. doi:https://doi.org/10.1016/j.rse.2005.03.002.
- Fernandez-Carrillo, A., L. McCaw, and M. A. Tanase. 2019. “Estimating Prescribed Fire Impacts and Post-Fire Tree Survival in Eucalyptus Forests of Western Australia with L-Band SAR Data.” Remote Sensing of Environment 224: 133–144.
- Gale, M. G., G. J. Cary, A. I. J. M. Van Dijk, and M. Yebra. 2021. “Forest Fire Fuel Through the Lens of Remote Sensing: Review of Approaches, Challenges and Future Directions in the Remote Sensing of Biotic Determinants of Fire Behaviour.” Remote Sensing of Environment 255: 112282. doi:https://doi.org/10.1016/j.rse.2020.112282.
- Gaulton, R., F. Danson, F. Ramirez, and O. Gunawan. 2013. “The Potential of Dual-Wavelength Laser Scanning for Estimating Vegetation Moisture Content.” Remote Sensing of Environment 132: 32–39.
- Gibson, R., T. Danaher, W. Hehir, and L. Collins. 2020. “A Remote Sensing Approach to Mapping Fire Severity in Southeastern Australia Using Sentinel 2 and Random Forest.” Remote Sensing of Environment 240: 111702.
- Giddey, B. L., J. A. Baard, and T. Kraaij. 2022. “Verification of the differenced Normalised Burn Ratio (dNBR) as an index of fire severity in Afrotemperate Forest.” South African Journal of Botany 146: 348–353. doi:https://doi.org/10.1016/j.sajb.2021.11.005.
- Hall, R. J., J. Freeburn, W. De Groot, J. Pritchard, T. Lynham, and R. Landry. 2008. “Remote Sensing of Burn Severity: Experience from Western Canada Boreal Fires.” International Journal of Wildland Fire 17 (4): 476–489. doi:https://doi.org/10.1071/WF08013.
- Han, D., X. Di, G. Yang, L. Sun, and Y. Weng. 2021. “Quantifying Fire Severity: A Brief Review and Recommendations for Improvement.” Ecosystem Health and Sustainability 7: 1973346.
- Hoe, M. S., C. J. Dunn, and H. Temesgen. 2018. “Multitemporal LiDar Improves Estimates of Fire Severity in Forested Landscapes.” International Journal of Wildland Fire 27 (9): 581–594. doi:https://doi.org/10.1071/WF17141.
- Hoy, E. E., N. H. French, M. R. Turetsky, S. N. Trigg, and E. S. Kasischke. 2008. “Evaluating the Potential of Landsat TM/ETM+ Imagery for Assessing Fire Severity in Alaskan Black Spruce Forests.” International Journal of Wildland Fire 17 (4): 500–514. doi:https://doi.org/10.1071/WF08107.
- Hu, T., Q. Ma, Y. Su, J. J. Battles, B. M. Collins, S. L. Stephens, M. Kelly, and Q. Guo. 2019. “A Simple and Integrated Approach for Fire Severity Assessment Using Bi-Temporal Airborne LiDar Data.” International Journal of Applied Earth Observation and Geoinformation 78: 25–38.
- Hudak, A. T., P. Morgan, M. J. Bobbitt, A. M. Smith, S. A. Lewis, L. B. Lentile, P. R. Robichaud, J. T. Clark, and R. A. McKinley. 2007. “The Relationship of Multispectral Satellite Imagery to Immediate Fire Effects.” Fire Ecology 3 (1): 64–90. doi:https://doi.org/10.4996/fireecology.0301064.
- Huete, A., K. Didan, T. Miura, E. P. Rodriguez, X. Gao, and L. G. Ferreira. 2002. “Overview of the Radiometric and Biophysical Performance of the MODIS Vegetation Indices.” Remote Sensing of Environment 83 (1–2): 195–213. doi:https://doi.org/10.1016/S0034-4257(02)00096-2.
- Keeley, J. E. 2009. “Fire Intensity, Fire Severity and Burn Severity: A Brief Review and Suggested Usage.” International Journal of Wildland Fire 18 (1): 116–126. doi:https://doi.org/10.1071/WF07049.
- Keeley, J. E., C. Fotheringham, and M. Baer-Keeley. 2005. “Determinants of Postfire Recovery and Succession in Mediterranean‐climate Shrublands of California.” Ecological Applications 15: 1515–1534.
- Key, C. 2006. “Evaluate Sensitivities of Burn-Severity Mapping Algorithms for Different Ecosystems and Fire Histories in the United States.” Final Report to the Joint Fire Science Program.
- Key, C. and N. Benson. 2005. “Landscape Assessment: Ground Measure of Severity, the Composite Burn Index; and Remote Sensing of Severity, the Normalised Burn Ratio . In FIREMON: Fire Effects Monitoring and Inventory System. USDA Forest Service, edited byLutes, D. C., Keane, R. E., Caratti, J. F., Key, C. H., Benson, N. C., Sutherland, S., and Gangi, L. J. Ogden.
- Korhonen, L., I. Korpela, J. Heiskanen, and M. Maltamo. 2011. “Airborne Discrete-Return LIDAR Data in the Estimation of Vertical Canopy Cover, Angular Canopy Closure and Leaf Area Index.” Remote Sensing of Environment 115 (4): 1065–1080. doi:https://doi.org/10.1016/j.rse.2010.12.011.
- Lentile, L. B., Z. A. Holden, A. M. Smith, M. J. Falkowski, A. T. Hudak, P. Morgan, S. A. Lewis, P. E. Gessler, and N. C. Benson. 2006. “Remote Sensing Techniques to Assess Active Fire Characteristics and Post-Fire Effects.” International Journal of Wildland Fire 15 (3): 319–345. doi:https://doi.org/10.1071/WF05097.
- Lhermitte, S., J. Verbesselt, W. W. Verstraeten, S. Veraverbeke, and P. Coppin. 2011. “Assessing Intra-Annual Vegetation Regrowth After Fire Using the Pixel Based Regeneration Index.” ISPRS Journal of Photogrammetry and Remote Sensing 66 (1): 17–27. doi:https://doi.org/10.1016/j.isprsjprs.2010.08.004.
- Liu, J., A. K. Skidmore, S. Jones, T. Wang, M. Heurich, X. Zhu, and Y. Shi. 2018. “Large Off-Nadir Scan Angle of Airborne LiDar Can Severely Affect the Estimates of Forest Structure Metrics.” ISPRS Journal of Photogrammetry and Remote Sensing 136: 13–25. doi:https://doi.org/10.1016/j.isprsjprs.2017.12.004.
- Lutz, J. A., C. H. Key, C. A. Kolden, J. T. Kane, and J. W. van Wagtendonk. 2011. “Fire Frequency, Area Burned, and Severity: A Quantitative Approach to Defining a Normal Fire Year.” Fire Ecology 7 (2): 51–65. doi:https://doi.org/10.4996/fireecology.0702051.
- Main-Knorn, M., Pflug, B., Louis, J., Debaecker, V., Müller-Wilm, U., and Gascon, F. 2017. “Sen2Cor for sentinel-2.“ Image and Signal Processing for Remote Sensing XXIII, Warsaw, Poland, October 4, 2017 1042704 Bruzzone, Lorenzo (International Society for Optics and Photonics). doi:https://doi.org/10.1117/12.2278218.
- Massetti, A. 2019. Enhancement of Fire Spread Modelling Using High-Resolution Remotely Sensed Data. Melbourne: Department of Civil Engineering, Monash University.
- Massetti, A., C. Rüdiger, M. Yebra, and J. Hilton. 2019. “The Vegetation Structure Perpendicular Index (VSPI): A Forest Condition Index for Wildfire Predictions.” Remote Sensing of Environment 224: 167–181. doi:https://doi.org/10.1016/j.rse.2019.02.004.
- Matsushita, B., W. Yang, J. Chen, Y. Onda, and G. Qiu. 2007. “Sensitivity of the Enhanced Vegetation Index (EVI) and Normalized Difference Vegetation Index (NDVI) to Topographic Effects: A Case Study in High-Density Cypress Forest.” Sensors 7 (11): 2636–2651. doi:https://doi.org/10.3390/s7112636.
- McCarley, T. R., C. A. Kolden, N. M. Vaillant, A. T. Hudak, A. M. Smith, and J. Kreitler. 2017a. “Landscape-Scale Quantification of Fire-Induced Change in Canopy Cover Following Mountain Pine Beetle Outbreak and Timber Harvest.” Forest Ecology and Management 391: 164–175. doi:https://doi.org/10.1016/j.foreco.2017.02.015.
- McCarley, T. R., C. A. Kolden, N. M. Vaillant, A. T. Hudak, A. M. S. Smith, B. M. Wing, B. S. Kellogg, and J. Kreitler. 2017b. “Multi-Temporal LiDar and Landsat Quantification of Fire-Induced Changes to Forest Structure.” Remote Sensing of Environment 191: 419–432. doi:https://doi.org/10.1016/j.rse.2016.12.022.
- Meng, R., P. E. Dennison, F. Zhao, I. Shendryk, A. Rickert, R. P. Hanavan, B. D. Cook, and S. P. Serbin. 2018. “Mapping Canopy Defoliation by Herbivorous Insects at the Individual Tree Level Using Bi-Temporal Airborne Imaging Spectroscopy and LiDar Measurements.” Remote Sensing of Environment 215: 170–183. doi:https://doi.org/10.1016/j.rse.2018.06.008.
- Miller, J. D. and A. E. Thode. 2007. “Quantifying burn severity in a heterogeneous landscape with a relative version of the delta Normalised Burn Ratio (dNBR).” Remote Sensing of Environment 109 (1): 66–80. doi:https://doi.org/10.1016/j.rse.2006.12.006.
- Moffiet, T., K. Mengersen, C. Witte, R. King, and R. Denham. 2005. “Airborne Laser Scanning: Exploratory Data Analysis Indicates Potential Variables for Classification of Individual Trees or Forest Stands According to Species.” ISPRS Journal of Photogrammetry and Remote Sensing 59 (5): 289–309. doi:https://doi.org/10.1016/j.isprsjprs.2005.05.002.
- Morgan P., Keane R. E., Dillon G. K., Jain T. B., Hudak A. T., Karau E. C., Sikkink P. G., Holden Z. A. and Strand E. K. 2014. “Challenges of assessing fire and burn severity using field measures, remote sensing and modelling.“ Int. J. Wildland Fire 23 (8): 1045. https://doi.org/10.1071/WF13058.
- Mousivand, A., M. Menenti, B. Gorte, and W. Verhoef. 2014. “Global Sensitivity Analysis of the Spectral Radiance of a Soil–vegetation System.” Remote Sensing of Environment 145: 131–144. doi:https://doi.org/10.1016/j.rse.2014.01.023.
- Ndalila, M. N., G. J. Williamson, and D. M. J. S. Bowman. 2018. “Geographic Patterns of Fire Severity Following an Extreme Eucalyptus Forest Fire in Southern Australia: 2013 Forcett-Dunalley Fire.” Fire 1: 40.
- Nolan, R. H., C. J. Blackman, V. R. de Dios, B. Choat, B. E. Medlyn, X. Li, R. A. Bradstock, and M. M. Boer. 2020a. “Linking Forest Flammability and Plant Vulnerability to Drought.” Forests 11 (7): 779. doi:https://doi.org/10.3390/f11070779.
- NSW DPIE. 2020. NSW Fire and the Environment 2019–20 Summary. Sydney: NSW DPIE.
- Parks, S. A., G. K. Dillon, and C. Miller. 2014. “A New Metric for Quantifying Burn Severity: The Relativised Burn Ratio.” Remote Sensing 6: 1827–1844.
- Pook, E., A. Gill, and P. Moore. 1997. “Long-Term Variation of Litter Fall, Canopy Leaf Area and Flowering in a Eucalyptus Maculata Forest on the South Coast of New South Wales.” Australian Journal of Botany 45 (5): 737–755. doi:https://doi.org/10.1071/BT95063.
- Quintano, C., A. Fernández-Manso, and O. Fernández-Manso. 2018. “Combination of Landsat and Sentinel-2 MSI Data for Initial Assessing of Burn Severity.” International Journal of Applied Earth Observation and Geoinformation 64: 221–225. doi:https://doi.org/10.1016/j.jag.2017.09.014.
- Richardson, A. J. and C. Wiegand. 1977. “Distinguishing Vegetation from Soil Background Information.” Photogrammetric Engineering and Remote Sensing 43: 1541–1552.
- Rogan, J. and S. Yool. 2001. “Mapping Fire-Induced Vegetation Depletion in the Peloncillo Mountains, Arizona and New Mexico.” International Journal of Remote Sensing 22 (16): 3101–3121. doi:https://doi.org/10.1080/01431160152558279.
- Roy, D. P., L. Boschetti, and S. N. Trigg. 2006. “Remote Sensing of Fire Severity: Assessing the Performance of the Normalised Burn Ratio.” IEEE Geoscience and Remote Sensing Letters 3 (1): 112–116. doi:https://doi.org/10.1109/LGRS.2005.858485.
- Schober, P., C. Boer, and L. A. Schwarte. 2018. “Correlation Coefficients: Appropriate Use and Interpretation.” Anesthesia & Analgesia 126 (5): 1763–1768. doi:https://doi.org/10.1213/ANE.0000000000002864.
- Signorell, A., K. Aho, A. Alfons, N. Anderegg, T. Aragon, A. Arppe, A. Baddeley, K. Barton, B. Bolker, and H. Borchers. 2018. DescTools: Tools for Descriptive Statistics. R package version 0.99. 26. Vienna: The Comprehensive R Archive Network.
- Smith, H. G., G. J. Sheridan, P. N. J. Lane, P. Nyman, and S. Haydon. 2011. “Wildfire Effects on Water Quality in Forest Catchments: A Review with Implications for Water Supply.” Journal of Hydrology 396: 170–192.
- Solberg, S., A. Brunner, K. H. Hanssen, H. Lange, E. Næsset, M. Rautiainen, and P. Stenberg. 2009. “Mapping LAI in a Norway Spruce Forest Using Airborne Laser Scanning.” Remote Sensing of Environment 113 (11): 2317–2327. doi:https://doi.org/10.1016/j.rse.2009.06.010.
- Soverel, N. O., D. D. Perrakis, and N. C. Coops. 2010. “Estimating Burn Severity from Landsat dNbr and RdNbr Indices Across Western Canada.” Remote Sensing of Environment 114 (9): 1896–1909. doi:https://doi.org/10.1016/j.rse.2010.03.013.
- Stambaugh, M. C., L. D. Hammer, and R. Godfrey. 2015. “Performance of Burn-Severity Metrics and Classification in Oak Woodlands and Grasslands.” Remote Sensing 7 (8): 10501–10522. doi:https://doi.org/10.3390/rs70810501.
- Tanase, M. A., R. Kennedy, and C. Aponte. 2015. “Fire Severity Estimation from Space: A Comparison of Active and Passive Sensors and Their Synergy for Different Forest Types.” International Journal of Wildland Fire 24 (8): 1062–1075. doi:https://doi.org/10.1071/WF15059.
- Tanase, M. A., M. Santoro, J. de La Riva, P. Fernando, and T. Le Toan. 2010. “Sensitivity of X-, C-, and L-Band SAR Backscatter to Burn Severity in Mediterranean Pine Forests.” IEEE Transactions on Geoscience and Remote Sensing 48 (10): 3663–3675. doi:https://doi.org/10.1109/TGRS.2010.2049653.
- Tang, W., J. Hu, H. Zhang, P. Wu, and H. He. 2015. “Kappa Coefficient: A Popular Measure of Rater Agreement.” Shanghai Archives of Psychiatry 27: 62–67. doi:https://doi.org/10.11919/j.issn.1002-0829.215010.
- Tolhurst, K. G. and G. McCarthy. 2016. “Effect of Prescribed Burning on Wildfire Severity: A Landscape-Scale Case Study from the 2003 Fires in Victoria.” Australian Forestry 79: 1–14.
- Tran, B. N., M. A. Tanase, L. T. Bennett, and C. Aponte. 2018. “Evaluation of Spectral Indices for Assessing Fire Severity in Australian Temperate Forests.” Remote Sensing 10: 1680.
- Trigg, S. and S. Flasse. 2001. “An Evaluation of Different Bi-Spectral Spaces for Discriminating Burned Shrub-Savannah.” International Journal of Remote Sensing 22: 2641–2647.
- Turner, M. G., W. W. Hargrove, R. H. Gardner, and W. H. Romme. 1994. “Effects of Fire on Landscape Heterogeneity in Yellowstone National Park, Wyoming.” Journal of Vegetation Science 5 (5): 731–742. doi:https://doi.org/10.2307/3235886.
- van Wagtendonk, J. W., R. R. Root, and C. H. Key. 2004. “Comparison of AVIRIS and Landsat ETM+ Detection Capabilities for Burn Severity.” Remote Sensing of Environment 92: 397–408.
- Verbyla, D. L., E. S. Kasischke, and E. E. Hoy. 2008. “Seasonal and Topographic Effects on Estimating Fire Severity from Landsat TM/ETM+ Data.” International Journal of Wildland Fire 17 (4): 527–534. doi:https://doi.org/10.1071/WF08038.
- Vieira, S. M., U. Kaymak, and J. M. Sousa. 2010. Cohen’s Kappa Coefficient as a Performance Measure for Feature Selection. In International Conference on Fuzzy Systems, 1–8. https://doi.org/https://doi.org/10.1080/15481603.2017.1413794
- Wei, G., S. Shalei, Z. Bo, S. Shuo, L. Faquan, and C. Xuewu. 2012. “Multi-Wavelength Canopy LiDar for Remote Sensing of Vegetation: Design and System Performance.” ISPRS Journal of Photogrammetry and Remote Sensing 69: 1–9. doi:https://doi.org/10.1016/j.isprsjprs.2012.02.001.
- Wulder, M., J. White, S. Magnussen, and S. McDonald. 2007. “Validation of a Large Area Land Cover Product Using Purpose-Acquired Airborne Video.” Remote Sensing of Environment 106 (4): 480–491. doi:https://doi.org/10.1016/j.rse.2006.09.012.
- Xiao, Y., W. Zhao, D. Zhou, and H. Gong. 2013. “Sensitivity Analysis of Vegetation Reflectance to Biochemical and Biophysical Variables at Leaf, Canopy, and Regional Scales.” IEEE Transactions on Geoscience and Remote Sensing 52 (7): 4014–4024. doi:https://doi.org/10.1109/TGRS.2013.2278838.
- Yebra, M., P. E. Dennison, E. Chuvieco, D. Riano, P. Zylstra, E. R. Hunt Jr, F. M. Danson, Y. Qi, and S. Jurdao. 2013. “A Global Review of Remote Sensing of Live Fuel Moisture Content for Fire Danger Assessment: Moving Towards Operational Products.” Remote Sensing of Environment 136: 455–468. doi:https://doi.org/10.1016/j.rse.2013.05.029.
- Yebra, M., X. Quan, D. Riaño, P. R. Larraondo, A. I. van Dijk, and G. J. Cary. 2018. “A Fuel Moisture Content and Flammability Monitoring Methodology for Continental Australia Based on Optical Remote Sensing.” Remote Sensing of Environment 212: 260–272. doi:https://doi.org/10.1016/j.rse.2018.04.053.
- Yin, C., B. He, M. Yebra, X. Quan, A. C. Edwards, X. Liu, and Z. Liao. 2020. “Improving Burn Severity Retrieval by Integrating Tree Canopy Cover into Radiative Transfer Model Simulation.” Remote Sensing of Environment 236: 111454.