
ABSTRACT
Multispectral radiometry resolutely quantifies canopy attributes of similarly managed monocultures over wide and varied temporal arrays. Likewise, liquid phthalocyanine-containing products are commonly applied to turfgrass as a spray pattern indicator, dormancy colourant, and/or product synergist. While perturbed multispectral radiometric characterization of putting greens within 24 h of treatment by synthetic phthalocyanine colourant has been reported, explicit guidance on subsequent use is absent from the literature. Our objective was to assess creeping bentgrass (Agrostis stolonifera L. ‘Penn G2’) putting green reflectance and growth one to 14 d following semi-monthly treatment by synthetic Cu II phthalocyanine colourant (Col) and petroleum-derived spray oil (PDSO) combination product at a 27 L ha−1 rate and/or 7.32 kg ha−1 soluble N treatment by one of two commercial liquid fertilizers. As observed in a bentgrass fairway companion study, mean daily shoot growth and canopy dark green colour index (DGCI) increased with Col+PDSO complimented N treatment. Yet contrary to the fairway study results, deflated mean normalized differential red edge (NDRE) or vegetative index (NDVI) resulted from an associated Col+PDSO artefact that severely impeded near infrared (810-nm) putting green canopy reflectance. Regardless of time from Col+PDSO combination product treatment, the authors strongly discourage turfgrass scientists from employing vegetative indices that rely on 760- or 810-nm canopy reflectance when evaluating such putting green systems.
1. Introduction
Multispectral radiometry is increasingly implemented by research scientists to quantify shoot density, canopy colour, nitrogen status, and/or a/biotic stress of turfgrass (Kruse, Christians, and Chaplin Citation2006; Caturegli et al. Citation2020; DaCosta and Huang Citation2006; Guillard et al. Citation2020; Pruyne, Schlossberg, and Uddin Citation2019, Citation2020; Schlossberg Citation2022). Justifications for adoption include precise and rapid measurement of canopy reflectance by multiple operators. Likewise, these measurements generate continuous, ratio data readily complemented by emerging automated sampling technologies and/or GIS platforms (Rogan and Schlossberg Citation2013; Wilber, Czarnecki, and McCurdy Citation2022; Zhang et al. Citation2019).
Meanwhile, reports cautioning scientists of cultural limitations on multispectral radiometric inference into turfgrass canopy attributes have materialized. Noted obstacles include evaluation of various turfgrass species and/or identic cultivars either managed at different heights of cut or evaluated in the 24 h immediately following spray treatment by synthetic colourant or a colourant combination product at low rates (Bremer et al. Citation2011; Lee et al. Citation2011; Leinauer et al. Citation2014; McCall et al. Citation2020; Obear et al. Citation2017).
Liquid phthalocyanine-containing products are commonly applied to golf course putting greens as either a spray pattern indicator, dormancy colourant, and/or combination product synergist (Mattox et al. Citation2020, Citation2021; McCarty et al. Citation2013, Citation2014; Pinnix, McCauley, and Miller Citation2018a; Pinnix et al. Citation2018b; Pinnix, McCauley, and Miller Citation2019). Using an active-type spectroradiometer, McCall et al. (Citation2020) reported identical spectral properties among three phthalocyanine colourant-containing products. ‘Grigg GreenPIG’ (Brandt Consolidated, Inc., Springfield, IL, USA) and ‘Foursome’ (Makhteshim-Agan of North America, Inc., Raleigh, NC, USA) comprise dedicated spray pattern indicators recommended for routine use (McCall et al. Citation2020). The third was Civitas Pre-M1×ed Turf DefenseTM (Intelligro, Mississauga, ON, Canada), a synthetic polychlorinated Cu II phthalocyanine colourant in petroleum-derived spray oil (PDSO) labelled for golf course putting greens on 7- to 21-d intervals (Van Dyke Citation2019).
Given precise quantification of temporal variation is a pre-eminent attribute of multispectral radiometry relative to visual or other assessment (Bell et al. Citation2002; Guertal and Shaw Citation2004; Johnsen et al. Citation2009; Leinauer et al. Citation2014; Trenholm et al. Citation2000), research trials conducted on turfgrass monocultures are likely to include both colourant combination products and repeated canopy evaluations using multispectral radiometry >1 d following treatment (Nascimento et al. Citation2020). Recently published field research describes reflectance from a monocultured creeping bentgrass fairway 1 to 10 d following repeated semi-monthly colourant combination product and/or soluble N fertilizer foliar treatments (Leiby and Schlossberg Citation2022). Results show the 9.8 kg N ha−1 foliar fertilization to be the more influential component in reducing mean reflectance in all visible wavebands measured. However, inclusion of 27 L colourant combination product (ha−1) further reduced mean 460-, 610-, 660- and 710-nm canopy reflectance, but not 510- or 560-nm reflectance of the treated bentgrass fairway mowed three times a week at a 12.7-mm height of cut (Leiby and Schlossberg Citation2022).
Foliar N fertilization did not affect NIR reflectance from the fairway system, yet addition of colourant combination product to the tank mix severely reduced 760- and 810-nm reflectance relative to reflectance of shorter, visible wavebands (Leiby and Schlossberg Citation2022). Foliar treatment effect on fairway NIR reflectance interacted with day after initial treatment, when colourant combination product reduced both 760- and 810-nm mean reflectance from approximately 5.7 to 3.4 absolute percentage points relative to N fertilizer alone over the 10-d post-application periods. Vegetative indices calculated using canopy reflectance were significantly improved by the foliar N fertilizer component but showed no interaction between treatment and sample date. Colourant combination product significantly increased mean dark green colour of the fairway canopy, but not mean normalized differential vegetative index (Leiby and Schlossberg Citation2022).
Despite the documented limitations of multispectral reflectometry in assessing creeping bentgrass fairway canopy qualities, as well as those of creeping bentgrass putting greens in the 24 h following spray treatment by synthetic colourant or a colourant combination product at low rates, the current literature provides no explicit guidance concerning putting green canopy reflectance inference at times >24 h from combination colourant and spray oil application. Our objective was to determine how frequent and repeated spray application of a commercial, synthetic polychlorinated Cu II phthalocyanine colourant (Col) and a petroleum-derived spray oil (PDSO) liquid influences creeping bentgrass (Agrostis stolonifera L. ‘Penn G2’) putting green visible and near-infrared reflectance, associated vegetative indices, and shoot growth over 14-d post application periods.
2. Materials and methods
The experiment was initiated in 2019 on a ‘Penn G2’ creeping bentgrass putting green maintained on a 9-cm sand cap above a native Hagerstown silt loam (fine, mixed, semiactive, mesic Typic Hapludalfs) within the J. Valentine Turfgrass Research Center (University Park, PA, USA). The upper 15-cm soil profile, thatch excluded, was thoroughly sampled in April 2019, and submitted to the Penn State Univ. Agric. Analytical Services Laboratory for routine soil analysis (Shoemaker, McLean, and Pratt Citation1961; Eckert and Sims Citation2011; Wolf and Beegle Citation2011). Later that month, and again in April 2020, the putting green was sand topdressed (1 Mg ha−1), brushed, and mowing was withheld for 3 d prior to study initiation.
Synthetic polychlorinated Cu II phthalocyanine colourant (Col) and petroleum-derived spray oil (PDSO) combination product (Col+PDSO, Civitas PreM1×ed Turf Defence) and/or liquid N fertilizer treatments, either urea ammonium nitrate (UAN, 30-0-0, 15% urea-N by mass, Plant Food Co. Inc., Cranbury, NJ, USA) or methylol urea (MU, Nitamin 30-0-0, 12% urea-N, Koch Agronomic Services LLC, Wichita, KS, USA), were randomly assigned to four 1.83- × 0.92-m plots in a randomized complete block design with blocks separated by 60-cm buffers. A fifth plot in each of five (5) blocks was retained as a control and identically treated by DI H2O. Rate of Col+PDSO and/or liquid fertilizer treatment was 27 L ha−1 and/or 7.32 kg N ha−1 respectively and applied in 611 L ha−1 carrier volume using a single nozzle (TeeJet 11008EVS) wand-equipped CO2 backpack sprayer. Foliar treatments were initiated on 24 May 2019 and re-applied every 11 ± 4 d through 15 August 2019. The following season, identical spray treatments were resumed on 13 May and terminated on 27 July 2020.
The putting green (.) was mowed 6 ± 1 d per week at a 3.2-mm height of cut (0.126”) May through September in both years, and clippings were collected and discarded offsite. The putting green was irrigated with potable-quality water as needed to avert drought stress and treated with paclobutrazol (Trimmit 2SC, Syngenta Crop Protection Inc., Greensboro, NC, USA) as recommended every 18 ± 3 d. Supplemental fertilizer deliveries were periodically made over each growing season and totalled 9.8, 24.4, 18.8, 2.4, 0.3, 1.7, and 0.5 kg N, K, P, Mg, S, Fe, and Mn ha−1 in 2019; and 14.6, 2.4, 0.6, 2.2, and 1.0 kg N, Mg, S, Fe, and Mn ha−1 in 2020.
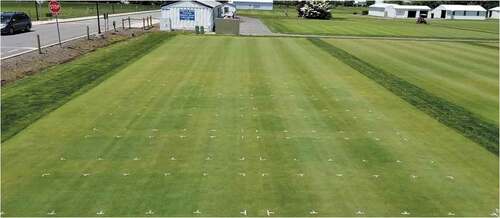
Figure 1. Putting green research plots recently treated by polychlorinated Cu II phthalocyanine colourant (Col) and petroleum-derived spray oil (PDSO) combination product (Col+pdso, Civitas PreM1×ed Turf Defense) and/or liquid N fertilizer foliar application, June, 2019.
Following the second treatment application in each year, a passive multi-spectral radiometer (CropScan MSR87, Rochester, MN) was used to measure canopy reflectance relative to simultaneous irradiance in the 460, 510, 560, 610, 660, 710, 760, and 810 ± 5-nm wavebands. Optimal radiometer operation required cloudless conditions and orientation of its downward-facing silicon photodiodes perpendicular to the turfgrass surface (Chang et al., Citation2005; Lee et al. Citation2011). On days conditions permitted, two successive rounds of plot scans were collected at a 0.7-m height, providing for unique, 0.1-m2 sample areas. Canopy reflectance (R) was measured in the ±3-h interval around solar noon 18, 21, 46, 55, 61, 82, 84, 87 and 90 days after initiation (DAI) in 2019, and 374, 385, 389, 405, 411, 413, 418, 420, 423, and 432 DAI in 2020. Duplicate measures of percent reflectance at each waveband were averaged per plot prior to statistical analysis. All plots were fully vegetated over the experimental duration, thus precluding influence of soil background on reflectance measures.
Mean percent reflectance in the 810- and 710- or 660-nm wavebands were used to determine normalized differential red edge (NDRE; Rodriguez et al. Citation2006) or normalized differential vegetative index (NDVI; Baret and Guyot Citation1991). Canopy return of visible blue, green, and red light, i.e. respective mean percent reflectance of 460-, 560-, and 660-nm radiation, was used to calculate the dark green colour index (DGCI; Karcher and Richardson Citation2003)
Turfgrass shoot growth was quantified as clipping yield sampled 18 June 2024 July, and 26 August 2019, or 16 June 2012 July, and 1 August 2020; corresponding to 25, 61, and 94 DAI in 2019, or 389, 415 and 435 DAI in 2020. Likewise, these clipping yield collections occurred 12, 7, and 11 or 8, 13, and 5 days after last treatment (DALT), respectively. Samples were collected over a single, 53-cm wide pass using a reel mower (Toro Greensmaster 1000, Bloomington, MN) set to a 3.3-mm height of cut across each 183-cm plot length. The putting green plots were not mowed the 3 to 4 d preceding scheduled clipping yield collections. Once complete, all remaining turf was mowed and clippings discarded offsite. Clipping samples were oven-dried at 60°C, weighed to 0.1-mg precision (Zhu, Schlossberg, and Bryant Citation2016), and divided by the number of days previously not mowed as daily shoot growth (kg ha−1 d−1).
Putting green canopy reflectance by waveband; canopy DGCI, NDRE, NDVI; and daily shoot growth were individually modelled by one-way analysis of an augmented factorial (2 × 2 + 1) using PROC MIXED (SAS Institute, v. 9.4, Cary, NC, USA). More specifically, the treatment array comprised a factorial of Col+PDSO absence or presence by two N sources (2 × 2) plus a control (DI H2O) treatment (Atkinson, Donev, and Tobias Citation2007). Justification for this preference over a two-way (3×2) includes the high likelihood of midseason putting green tank mixes already containing low rates of soluble N; and thwarting potential misrepresentation of Col+PDSO treatment as an alternative to light and frequent N fertilization of putting greens in season.
Block effect comprised the sole random variable, and the main effect of experimental treatment (TRT) was F-tested by the block × TRT interaction term (McIntosh Citation1983). Diagnostic plots were inspected to confirm normal error distribution, constant variance, and independent errors assumption abidance. Noncompliant observations, >3 standardized residuals from its predicted value and not comprising >1.5% of the sample set, were omitted as missing data. Contrast statements used to parse Col+PDSO and/or fertilizer rate or source within significant treatment (TRT) effects could not be arranged orthogonally, thus resulting sums of squares may exceed that of the treatment main effect.
The nineteen repeated measures were analysed as split plots in time from initiation. Both the days after initiation (DAI) and TRT × DAI sources were F-tested by the residual. Still further in respect of the broad inference space, i.e. where mean outcomes may be expected under similar conditions and identical semi-monthly treatments, significant main treatment effects (pooled means) are reported and discussed regardless of accompanying significant TRT × DAI interaction. PROC REG was used to further analyse significant TRT × DAI effects as the mean difference between Col+PDSO or equally N-fertilized treatments by DAI, days after first treatment that season (DAFTTS), days after last treatment (DALT), days before clipping yield, and routine transformations thereof.
3. Results
The routine soil analysis of the putting green rootzone sampled from the upper 15 cm in April 2019 revealed a 1:1 soil pH of 7.07. Nutrients and base cations as extracted by Mehlich-3 were reported in the following mean concentrations: 1267, 7, 43, 144, 38, 28, and 5 mg kg−1 of Ca, Cu, K, Mg, P, S, and Zn, respectively.
3.1. Reflectance by waveband
Mean reflectance from the creeping bentgrass putting green canopy in all measured wavebands was significantly influenced by semi-monthly Col+PDSO treatment and/or nitrogen fertilizer application (). The Col+PDSO component of the combination treatments was the predominant influence on measured canopy reflectance, comprising between 32 and 98% of treatment sum of squares (data not shown).
Table 1. ANOVA of percent reflectance from treated creeping bentgrass putting green canopies in the 460-, 510-, 560-, 610-, 660-, 710-, 760-, and 810-nm wavebands by source and pooled treatment levels.
Regarding reflectance of all measured wavebands, a lesser average percentage of 460-nm reflectance (R460) than any other was observed over the experimental duration, and the maximum mean R460 was recorded from the control plots (). Nitrogen fertilizer source; i.e. UAN vs. methylol urea, imposed neither significant effect nor interaction with Col+PDSO inclusion, but reflected less mean 460-nm radiation than control plots. The contrast of pooled N-only treatments vs. the control treatment accounted for 7% of the treatment sum of squares (data not shown). The combination treatments of both N and Col+PDSO showed lesser R460 yet (), and contrast of Col+PDSO combination vs. the N only treatments accounted for 63% of the treatment sum of squares (data not shown). Leiby and Schlossberg (Citation2022) report a dissimilar influence of Col+PDSO and/or soluble N treatment on ‘Declaration’ creeping bentgrass fairway reflectance, whereas N only treatments more greatly mitigated fairway R460 relative to the control than Col+PDSO relative to the N only treatments.
Maximum mean 510-, 560-, and 610-nm reflectance was observed from the control plots, while minimum mean reflectance of these wavebands was observed from plots receiving both N and Col+PDSO combination treatment (). The N-only treatments showed intermediate mean reflectance that was significantly different from either, regardless of N source (). Similarly, fertilizer source did not interact with Col+PDSO to influence mean reflectance of these three wavebands. The contrast of pooled N-only treatments vs. the control treatment accounted for 26, 17, or 13% of the mean 510-, 560-, or 610-nm reflectance treatment sum of squares, respectively. The contrast of Col+PDSO combination vs. the N only treatments accounted for 32, 44, or 49% of the respective mean 510-, 560-, or 610-nm reflectance treatment sum of squares (data not shown), and differs from results of a similar fairway study showing Col+PDSO did not influence R510 or R560 from N-fertilized plots (Leiby and Schlossberg Citation2022)
Mean R660 or R710 from N fertilized plots was lower than from unfertilized, but statistically lowest when treated by N and Col+PDSO (). Fertilizer source imposed no effect or interaction with Col+PDSO inclusion, and contrast of pooled N-only treatments vs. the control treatment accounted for 18 or 5% of the mean 660- or 710-nm reflectance treatment sum of squares, respectively. Meanwhile, contrast of Col+PDSO combination vs. the N only treatments accounted for 42 or 64% of the mean R660 or R710 treatment sum of squares, respectively (data not shown). While similar treatments applied to a fairway showed lower mean R660 from N fertilized than from unfertilized plots, and lowest R660 per the N and Col+PDSO treatment, the magnitude of the reduction of the former contrast exceeded the latter. In other words, equivalent Col+PDSO application imparts greater influence on R660 from a canopy mowed 6 d week−1 at 3.2-mm than one mowed 3 d week−1 at a 12.7-mm height of cut (Leiby and Schlossberg Citation2022). The same disparity in R710 is observed and reported between the two systems.
Mean 760- or 810-nm waveband reflectance from plots receiving the Col+PDSO combination treatment was less than from all others (). However, the mean R760 or R810 levels are unique relative to all wavebands previously described in that the bentgrass putting green canopy reflectance recorded from plots treated only with N were greater than from control plots (). The same was not observed of a similarly treated creeping bentgrass fairway showing statistically equivalent mean R760 and R810 from plots treated by 9.76 kg N ha−1 or DI H2O (Leiby and Schlossberg Citation2022). Likewise, fertilizer source imposed no significant effect on mean percent reflectance of either waveband. Contrasts of pooled N-only treatments vs. the control treatment accounted for only 5 or 7% of the treatment sum of squares for mean R760 or R810, respectively. Contrast of Col+PDSO combination vs. the N only treatments accounted for 95 and 98% of respective mean 760- and 810-nm reflectance treatment sum of squares (data not shown).
However, fertilizer source interacted with Col+PDSO inclusion to significantly influence mean 760- and 810-nm reflectance (). Mean R760 resulting from only N treatment as UAN was 49.3%, exceeding the 48.5% R760 measured from its N-only methylol urea counterpart. Yet when combined with Col+PDSO, respective mean R760 from UAN or methylol urea was 39.1 or 39.2%. Similarly, mean R810 from plots receiving only N as UAN was 56.1%, exceeding the 55.3% R810 measured from its N-only methylol urea counterpart. When combined with Col+PDSO, respective mean R810 from UAN or methylol urea was 46.2 or 46.4%. Thus, a near-infrared reflecting component of the UAN liquid fertilizer may be masked by either the colourant and/or PDSO ingredient when complimented by the combination product. Alternatively, an ingredient in the methylol urea liquid fertilizer may absorb a small fraction of 760- to 810-nm radiation that is then masked by the overriding absorption of 810-nm light by addition of Col+PDSO combination product to the tank mix. Experimental objectives notwithstanding, identifying the mechanism behind this interaction will require further putting green investigations, as similar treatment did not illicit such interaction among like liquid N fertilizers applied at modest rates in the companion fairway study (Leiby and Schlossberg Citation2022).
All measured wavebands of creeping bentgrass putting green reflectance were statistically influenced by sample DAI (), a likely result of varying hours elapsed since last mowing, nutrient availability, climatic conditions, and/or mower sharpness over the duplicate 13-week experiments. Yet unlike the companion fairway study results that showed only R760 and R810 were subject to significant treatment by sample date interaction (Leiby and Schlossberg Citation2022), putting green reflectance of all measured wavebands was significantly influenced by the interaction of treatment and sample DAI (). Resulting inference into the DAI effect will be deferred to each waveband-specific spray treatment dependency.
As hypothesized, Col+PDSO was the treatment component most influencing reflectance variance (sum of squares) in every waveband measured. Thus, differences in reflectance between Col+PDSO and/or N fertilizer treatment pairs were averaged and regressed by DAI (n = 19). Resultant models of the difference (Δ) in 450-, 510-, 560-, 610-, 660-, and 710-nm reflectance featured coefficients of determination (r2) <0.12 and slope coefficients not statistically different from zero. Yet when employing days after last treatment (DALT) as the regressor, rather than DAI, improved linear models predicted varying reflectance dependence (.
Figure 2. Linear regression models of differences in creeping bentgrass putting green canopy reflectance due to synthetic Cu II phthalocyanine colourant (Col) and petroleum-derived spray oil (PDSO) complementation of foliar N spray application; by days after last treatment (DALT) and (a) 460- or 610-nm waveband, (b) 510- or 660-nm waveband, and (c) 560- or 710-nm waveband. Each symbol represents the mean difference of ten pairwise comparisons collected on one sampling date.
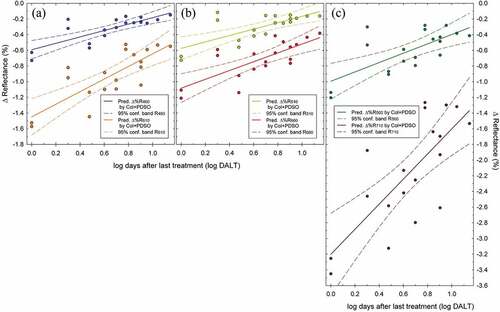
Linear models show a maximum 0.58% reduction of R460 and R510 the day immediately following Col+PDSO treatment (). The Col+PDSO treatment ΔR460 increased with time but remained −0.2% at 14 DALT (). Meanwhile, the ΔR510 upper confidence band intercepts 0% at approximately 12.5 DALT (). These linear models feature coefficients of determination (r2) of 0.72 and 0.52, respectively.
The ΔR560 is predicted to be −0.99% the day following Col+PDSO treatment, increasing to approximately −0.3% by 14 DALT (). One to 14 d following, ΔR610 by Col+PDSO treatment increased from −1.45 to −0.55% (). Similarly, from one to 14 d following described Col+PDSO treatment, ΔR660 was respectively increased from −1.08 to −0.42% (). Linear models of ΔR560, ΔR610, and ΔR660 feature 0.48, 0.62, and 0.57 coefficients of determination (r2), respectively.
Canopy reflectance (R) of the far red and near-infrared wavebands were most influenced by Col+PDSO treatment. For example, a ΔR710 of −3.2% is predicted the day after Col+PDSO treatment, increasing to an approximate −1.35% canopy ΔR710 14 DALT (). Such significant temporal influence of Col+PDSO treatment may later prove consequential, given the major role R710 plays in the NDRE calculus.
Relative to equal N treatment, semi-monthly Col+PDSO application resulted in a mean ΔR810 of −9.4% (). However, Col+PDSO suppressed R760 to a greater extent than any other waveband, resulting in a mean ΔR760 of −9.8% (). Despite both the described putting green and companion fairway study systems having received identical Col+PDSO treatment (Leiby and Schlossberg Citation2022), these differences in mean ΔR760 and ΔR810 from the putting green were more than twofold greater.
Table 2. ANOVA of treated creeping bentgrass putting green canopy dark green colour index (DGCI), normalized differential red edge (NDRE), normalized differential vegetative index (NDVI), and daily shoot growth by source and pooled treatment levels.
Differences in R760 or R810 from the putting green per Col+PDSO vs. N only treatment were also regressed by DAI (n = 19). Unlike the 460- to 710-nm reflectance model results, regression of ΔR760 and ΔR810 by DAI proved significant (P < 0.041, error df = 17), though featured respectively lacklustre 0.22 and 0.24 coefficients of determination (r2). Considering the respective β0 estimate of −11.8 or −11.4%, β1 slope estimate of 0.0086 or 0.008, and experimental duration of 432 d; the best-case scenario is an approximate ΔR of −8% from semi-monthly Col+PDSO treatment of putting greens.
Marginally improved models of ΔR760 and ΔR810 resulted from regression by DALT (P < 0.003, r2 = 0.42): ΔR760 = −14% + 6.51 (logDALT) and ΔR810 = −13.2% + 5.79 (logDALT). Significantly improved models predicting ΔR760 or ΔR810 by time resulted from stepwise selection of a second regressor variable. Specifically, ΔR760 = −17% + 7.23 (logDALT) + 0.01 (DAI), P < 0.0001, error df = 16, r2 = 0.74; or ΔR810 = −15.5% + 6.47 (logDALT) + 2 × 10⁻⁵ (DAI2), P < 0.0001, error df = 16, r2 = 0.75. However, no predictive advantage was afforded within the experiment confines, DAI <432; as sometimes the case with novel, second-term contributions (Leinauer et al. Citation2014; Schlossberg, Karnok, and Landry Citation2002). Either model employing the log DALT regressor predicted a negative Col+PDSO treatment influence on ΔR760 or ΔR810 for no less than 141 DALT.
3.2. Vegetative indices
As with reflectance of measured wavebands, the DGCI, NDRE, and NDVI indices were significantly influenced by the main effects of treatment and DAI. Neither fertilizer source nor its interaction with Col+PDSO complementation influenced these dependent variables (). Expectedly, mean DGCI, NDRE, and NDVI indices observed of controls were less than those calculated from N only treatments (Leiby and Schlossberg Citation2022), and this contrast accounted for 28, 98, and 93% of respective treatment sum of squares (data not shown). Putting green mean DGCI improvement by Col+PDSO inclusion was 0.018 index points (), a twofold increase relative to that observed in the companion fairway study (Leiby and Schlossberg Citation2022), and accounted for 31% of the treatment sum of squares (data not shown). Conversely, the N and Col+PDSO combination treatment showed lesser NDRE or NDVI means than N fertilizer by a margin of 0.014 or 0.005 index points (). While accounting for just 21 or 5% of the NDRE or NDVI treatment main effect sum of squares respectively, this response comprises a stark juxtaposition to the absence of Col+PDSO effect on fairway NDVI reported by Leiby and Schlossberg (Citation2022) as well as the Col+PDSO induced improvement in putting green canopy mean DGCI ().
All three calculated indices were significantly influenced by interaction of treatment and sample event (DAI) from 1 to 14 d post-treatment (). Considering the Col+PDSO treatment component most influenced reflectance variance at every waveband measured, differences in DGCI between Col+PDSO and/or N fertilizer-treated pairs were again averaged and regressed by DAI (n = 19). The slope coefficient predicting ΔDGCI by DAI was not statistically different from zero. When employing the natural log of days after first treatment this season (DAFTTS) as a regressor for ΔDGCI, rather than DAI, the following significant (P < 0.001, error df = 17) linear model resulted: ΔDGCI = 0.059 + −0.01 (lnDAFTTS), r2 = 0.56. Thus, improvement in canopy DGCI of putting greens receiving semi-monthly N complemented by Col+PDSO treatment, all as described above, is greater early in the season than later. Nonetheless, ΔDGCI resulting from Col+PDSO treatments is predicted to remain positive, even 365 DAFTTS. Despite the TRT × DAI effect on NDRE and NDVI (), the severe confounding of ΔR710, ΔR760, and ΔR810 by Col+PDSO precludes further predictive modelling efforts.
3.3. Shoot growth
Putting green shoot growth was significantly influenced by main effect of treatment and DAI (). Neither an effect of fertilizer source nor its interaction with Col+PDSO inclusion in spray treatment was detected. As one might expect, mean shoot growth of N fertilized statistically exceeded that of unfertilized (). The related contrast statement reveals 35% of treatment variance was associated with this 5.1 kg (ha d)−1 mean shoot growth increase and confirms the N-limited status of the putting green system. Nonetheless, Col+PDSO treatment showed a further 3.5 kg ha−1 mean daily shoot growth increase () over equal N fertilizer, accounting for 24% of the treatment sums of squares (data not shown).
Measured daily shoot growth showed significant interaction between treatment and sample collection DAI (). Per-block shoot growth differences between Col+PDSO and N fertilizer only treatments were averaged and regressed by DAI (n = 6). The following (P < 0.01, error df = 4) linear model: Δkg (ha d)−1 shoot growth= −0.022 + 0.253(DAI0.5), r2 = 0.84, indicates a dependably increasing influence of N and Col+PDSO treatment, relative to N alone, on shoot growth over the experimental duration. Moreover, subsequent multivariate analysis revealed this improved (P < 0.01, error df = 3) linear model: Δkg (ha d)−1 shoot growth = 7.68 + 2 × 10⁻⁵(DAI2) + 2.3 × 10⁻⁴(DAFTTS2), r2 = 0.98. Unlike the initial univariate model or that predicting Col+PDSO effect on ΔDGCI over time, this improved model shows shoot growth to be positively influenced by cumulative Col+PDSO treatment within and across successive seasons.
4. Discussion
The described 27 L ha−1 rate of Col+PDSO statistically reduced putting green canopy reflectance in the 610- through 810-nm wavebands over the 14-d post-application period. As first noted by Obear et al. (Citation2017) and illustrated by a calculated response surface of NDRE and NDVI (), either index is more sensitive to change in R660 or R710 than R810. Moreover, plots registering an identical NDRE or NDVI value need not share a common percentage of R660 or R710 and R810, rather a common ratio of the two. The following example pertains equally to NDRE, but, in the spirit of brevity, will solely reference NDVI.
Figure 3. A calculated response surface of normalized differential red edge (NDRE) or vegetative index (NDVI) by 810-nm and 660- or 710-nm arrays of percent canopy reflectance measures representative of maintained turfgrass systems in the field. Star symbols share identical NDVI values.
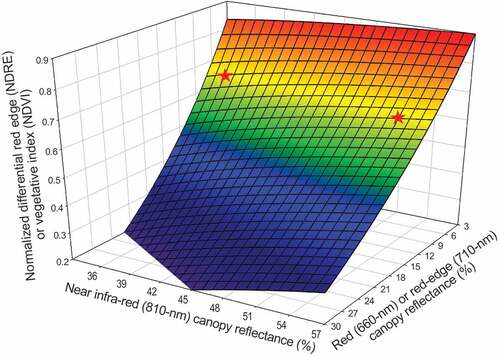
The magnitude of the R810 to R660 ratio dictates NDVI directly. For example, both star symbols shown share a NDVI of 0.667 (). The left-hand star depicts a plot reflecting 7% 660-nm and 35% 810-nm of irradiance, while the right-hand star depicts a plot reflecting 11% 660-nm and 55% 810-nm irradiance. If R810 remains unchanged, then NDVI shows an inverse response to change in R660. When R660 remains static, NDVI responds directly to R810 variance ().
In the absence of Col+PDSO, increasing semi-monthly N rate from 0 to 7.3 kg ha−1 consistently reduced R660 of the putting green canopy. This N-induced reduction in R660 is in certain agreement with the literature (Bendig et al. Citation2014; Rautiainen and Rautiainen Citation2018; Shannon et al. Citation1998). However, combination with 27 L ha−1 Col+PDSO further reduced R660 of the putting green canopy relative to adjacent and equally N-fertilized plots. McCall et al. (Citation2020) reported chlorophyll curvature index, derived from 675- to 690-nm reflectance, showed no influence of phthalocyanine colourant 1 d after treatment. Moreover, chlorophyll a or b extracted from creeping bentgrass tissue sampled 7 d after 2.7 L ha−1 Col+PDSO treatment was statistically equivalent to that of untreated canopy tissue (McCall et al. Citation2020).
The methods employed herein preclude unequivocal determination of decreased R660 as a physiological response of the treated creeping bentgrass or an artefact of the Col+PDSO residue. Yet relative to its effect on R660, the described Col+PDSO treatments disproportionally decreased R810 over significant duration. For example, McCall et al. (Citation2020) describe reduction of 760- to 840-nm reflectance 24-h following phthalocyanine combination product application to a creeping bentgrass fairway, despite having been applied at one-tenth the rate employed herein. Similarly, Leiby and Schlossberg (Citation2022) reported a respective 5.6 to 3.5% reduction in mean R810 from a regularly N-fertilized creeping bentgrass fairway, 1 to 10 d following repeated 27 L ha−1 Col+PDSO treatments.
One to 14 d following semi-monthly Col+PDSO treatment, creeping bentgrass putting green canopy R810 showed respective reduction of 13.2 to 6.6%. This constitutes a reduction in R810 of greater magnitude and duration than reported hitherto (Leiby and Schlossberg Citation2022; McCall et al. Citation2020; Obear et al. Citation2017). Yet reduced mean NDRE and NDVI of N-fertilized plots, over the 14-d period following Col+PDSO treatment, contrast reported correlations of turfgrass shoot growth and NDVI in season (Trenholm, Carrow, and Duncan Citation1999; Zhu et al. Citation2012). Furthermore, putting green mean DGCI calculated using visible waveband reflectance over the 14-d period following semi-monthly treatment showed a significant, positive effect of Col+PDSO.
The direct relation of near infrared reflectance (R810) and vegetative biomass is well documented (Munyatu Citation2022; Trenholm, Carrow, and Duncan Citation1999; Trenholm et al. Citation2000). Meanwhile, increases in putting green shoot growth were observed from 5- to 13-d following Col+PDSO treatment relative to non- or equally N-fertilized plots. On these bases, the shoot growth increase observed conflicts with the simultaneous reduction in R810 reflectance and implicates Col+PDSO residue as the artefactual cause of deflated NDVI and NDRE indices.
Direct inference of data resulting from the described applications to creeping bentgrass putting greens in the Mid-Atlantic US show Col+PDSO and N combination treatment deflates common vegetative indices for ≥336 h, comprising a fourteen-fold increase in duration over previous reports. Meanwhile, the empirical models constructed from the data predict Col+PDSO treatment adversely influences R760 or R810 for no less than 141 DALT. Resultingly, the authors strongly discourage employ of vegetative indices relying on 760- or 810-nm canopy reflectance when evaluating putting green systems treated by PDSO and Cu II phthalocyanine combination product(s).
Disclosure statement
No potential conflict of interest was reported by the authors.
Data availability statement
All raw data submitted to data depository and designated ‘public’. Schlossberg, Maxim (Citation2022), Putting green clipping yield, canopy reflectance, and vegetative indices by time from colourant and spray oil combination product application, Dryad, Dataset, https://doi.org/10.5061/dryad.6hdr7sr4j
Additional information
Funding
References
- Atkinson, A. C., A. N. Donev, and R. D. Tobias. 2007. Optimum Experimental Designs, with SAS, 189–192. New York: Oxford University Press.
- Baret, F., and G. Guyot. 1991. “Potentials and Limits of Vegetation Indices for LAI and APAR Assessment.” Remote Sensing of Environment 35 (2–3): 161–173. doi:10.1016/0034-4257(91)90009-U.
- Bell, G. E., D. L. Martin, S. G. Wiese, D. D. Dobson, M. W. Smith, M. L. Stone, and J. B. Solie. 2002. “Vehicle-Mounted Optical Sensing: An Objective Means for Evaluating Turf Quality.” Crop Science 42 (1): 197–201. doi:10.2135/cropsci2002.0197.
- Bendig, J., A. Bolten, S. Bennertz, J. Broscheit, S. Eichfuss, and G. Bareth. 2014. “Estimating Biomass of Barley Using Crop Surface Models (CSM) Derived from UAV-Based RGB Imaging.” Remote Sensing 6 (11): 10395–10412. doi:10.3390/rs60x000x.
- Bremer, D. J., H. Lee, K. Su, and S. J. Keeley. 2011. “Relationships Between Normalized Difference Vegetation Index and Visual Quality in Cool-Season Turfgrass: I. Variation Among Species and Cultivars.” Crop Science 51 (5): 2212–2218. doi:10.2135/cropsci2010.12.0728.
- Caturegli, L., M. Gaetani, M. Volterrani, S. Magni, A. Minelli, A. Baldi, G. Brandani, et al. 2020. “Normalized Difference Vegetation Index versus Dark Green Colour Index to Estimate Nitrogen Status on Bermudagrass Hybrid and Tall Fescue.” International Journal Remote Sensing 41 (2): 455–470. doi:10.1080/01431161.2019.1641762.
- Chang, J., S.A. Clay, D.E. Clay, D. Aaron, D. Helder, and K. Dalsted. 2005.“Clouds infl uence precision and accuracy of ground-based spectroradiometers.“ Commun. Soil Sci. Plant Anal 36:1799–1807. doi:10.1081/CSS-200062449.
- DaCosta, M., and B. Huang. 2006. “Minimum Water Requirements for Creeping, Colonial, and Velvet Bentgrasses Under Fairway Conditions.” Crop Science 46 (1): 81–89. doi:10.2135/cropsci2005.0118.
- Eckert, D., and J. T. Sims. 2011. “Recommended soil pH and lime requirement tests.” In Recommended Soil Testing Procedures for the Northeastern United States, edited by , The Northeast Coordinating Committee for Soil Testing (NECC-1812), 19–26. 3rd ed. Northeast Regional Publication # 493. Accessed 28 November 2022. https://sites.udel.edu/canr-nmeq/northeastern-soil-testing-procedures/
- Guertal, E. A., and J. N. Shaw. 2004. “Multispectral Radiometer Signatures for Stress Evaluation in Compacted Bermudagrass Turf.” HortScience 39 (2): 403–407. doi:10.21273/HORTSCI.39.2.403.
- Guillard, K., K. M. Miele, I. Surer, and T. F. Morris. 2020. “Guiding Fall Fertilization of Cool Season Turfgrass Lawns with NDVI Sufficiency Index.” Crop Science 61 (1): 784–803. doi:10.1002/csc2.20301.
- Johnsen, A. R., B. P. Horgan, B. S. Hulke, and V. Cline. 2009. “Evaluation of Remote Sensing to Measure Plant Stress in Creeping Bentgrass (Agrostis Stolonifera L.) Fairways.” Crop Science 49 (6): 2261–2274. doi:10.2135/cropsci2008.09.0544.
- Karcher, D. E., and M. D. Richardson. 2003. “Quantifying Turfgrass Color Using Digital Image Analysis.” Crop Science 43 (3): 943–951. doi:10.2135/cropsci2003.9430.
- Kruse, J. K., N. E. Christians, and M. H. Chaplin. 2006. “Remote Sensing of Nitrogen Stress in Creeping Bentgrass.” Agronomy journal 98 (6): 1640–1645. doi:10.2134/agronj2006.0022.
- Lee, H., D. J. Bremer, K. Su, and S. J. Keeley. 2011. “Relationships Between Normalized Difference Vegetation Index and Visual Quality in Turfgrasses: Effects of Mowing Height.” Crop Science 51 (1): 323–332. doi:10.2135/cropsci2010.05.0296.
- Leiby, N. L., and M. J. Schlossberg. 2022. “Reduced Creeping Bentgrass Fairway Reflectance Following Synthetic Colorant Application.” Agricultural Environmental Letters 7 (1): e20064. doi:10.1002/ael2.20064.
- Leinauer, B., D. M. VanLeeuwen, M. Serena, M. Schiavon, and E. Sevostianova. 2014. “Digital Image Analysis and Spectral Reflectance to Determine Turfgrass Quality.” Agronomy journal 106 (5): 1787–1794. doi:10.2134/agronj14.0088.
- Mattox, C., M. Dumelle, B. McDonald, M. Gould, C. Olsen, C. Schmid, R. Wang, and A. Kowalewski. 2021. “Comparing Rates of Mineral Oil, Sulfur, and Phosphorous Acid on Microdochium Patch Suppression and Turfgrass Quality.” Agronomy journal 113 (5): 1–12. doi:10.1002/agj2.20558.
- Mattox, C. M., A. R. Kowalewski, B. W. McDonald, J. G. Lambrinos, and J. W. Pscheidt. 2020. “Combinations of Rolling, Mineral Oil, Sulfur, and Phosphorous Acid Affect Microdochium Patch Severity.” Agronomy journal 112 (5): 3383–3395. doi:10.1002/agj2.20191.
- McCall, D. S., D. G. Sullivan, X. Zhang, S. B. Martin, A. Wong, and E. H. Ervin. 2020. “Influence of Synthetic Phthalocyanine Pigments on Light Reflectance of Creeping Bentgrass.” Crop Science 61 (1): 804–813. doi:10.1002/csc2.20335.
- McCarty, L. B., J. R. Gann, C. E. Wells, T. F. Bruce, and P. D. Gerald. 2013. “Physiological Responses of Creeping Bentgrass to Pigment Containing Products.” Agronomy journal 105 (6): 1797–1802. doi:10.2134/agronj2013.0298.
- McCarty, L. B., J. R. Gann, C. E. Wells, and P. D. Gerald. 2014. “Creeping Bentgrass Field Response to Pigment-Containing Products.” Agronomy journal 106 (4): 1533–1539. doi:10.2134/agronj14.0008.
- McIntosh, M. S. 1983. “Analysis of Combined Experiments 1.” Agronomy journal 75 (1): 153–155. doi:10.2134/agronj1983.00021962007500010041x.
- Munyatu, C. 2022. “Detecting the Distribution of Grass Aboveground Biomass on a Rangeland Using Sentinel-2 MSI Vegetation Indices.” Advances in Space Research 69 (2): 1130–1145. doi:10.1016/j.asr.2021.10.048.
- Nascimento, M. V. L., P. L. F. Santos, J. V. Costa, J. T. Martins, R. L. V. Boas, and L. J. G. Godoy. 2020. “Durability and Concentration of Organic Colorant in the Visual Quality of DiscoveryTM Bermudagrass.” Ornamental Horticulture 26 (4): 621–632. doi:10.1590/2447-536X.v26i4.2211.
- Obear, G. R., W. C. Kreuser, K. Hubbard, B. DeBels, and D. J. Soldat. 2017. “Plant Colorants Interfere with Reflectance-Based Vegetation Indices.” Crop Science 57 (2): 595–601. doi:10.2135/cropsci2016.05.0440.
- Pinnix, G. D., R. K. McCauley, and G. L. Miller. 2018a. “Air Temperature Effects on Turfgrass Colorant Transfer.” Crop Forage Turfgrass Manage 4 (1): 170091. doi:10.2134/cftm2017.12.0091.
- Pinnix, G. D., R. K. McCauley, and G. L. Miller. 2019. “Leaf Wetness Influences Turf Colorant Application.” Crop Forage Turfgrass Manage 5 (1): 180099. doi:10.2134/cftm2018.12.0099.
- Pinnix, G. D., G. L. Miller, D. C. Bowman, and G. L. Grabow. 2018b. “Color, Transfer, and Application Parameters of Turfgrass Colorants.” Agronomy journal 110 (1): 1–11. doi:10.2134/agronj2017.03.0164.
- Pruyne, D. T., M. J. Schlossberg, and W. Uddin. 2019. “Perennial Ryegrass Wear Resistance and Soil Amendment by Ca- and Mg-Silicates.” Agronomy 9 (10): 578. doi:10.3390/agronomy9100578.
- Pruyne, D. T., M. J. Schlossberg, and W. Uddin. 2020. “Creeping Bentgrass Fairway Wear Resistance by Granular Topdressing of Ca/mg-Rich Liming Agents.” Agriculture 10 (2): 43. doi:10.3390/agriculture10020043.
- Rautiainen, H., and M. Rautiainen. 2018. “A Study on the Drivers of Canopy Reflectance Variability in a Boreal Forest.” Remote Sensing Letters 9 (7): 666–675. doi:10.1080/2150704X.2018.1458344.
- Rodriguez, D., G. J. Fitzgerald, R. Belford, and L. K. Christensen. 2006. “Detection of Nitrogen Deficiency in Wheat from Spectral Reflectance Indices and Basic Crop Eco-Physiological Concepts.” Crop Pasture Science 57 (7): 781–789. doi:10.1071/AR05361.
- Rogan, C. M., and M. J. Schlossberg. 2013. “Complimenting Late-Season Nitrogen Fertilization of Cool-Season Turfgrass Putting Greens with Trinexapac-Ethyl.” Agronomy journal 105: 1507–1514. doi:10.2134/agronj2012.0443.
- Schlossberg, M. 2022. “Putting Green Clipping Yield, Canopy Reflectance, and Vegetative Indices by Time from Colorant and Spray Oil Combination Product Application, Dryad, Dataset.” doi:10.5061/dryad.6hdr7sr4j.
- Schlossberg, M. J. 2022. “Temporal Recovery of Polymer-Coated Urea-N by Kentucky Bluegrass in the Field.” Horticulturae 8 (3): 207. doi:10.3390/horticulturae8030207.
- Schlossberg, M. J., K. J. Karnok, and G. Landry Jr. 2002. “Estimation of Viable Root Length Density of Heat-Tolerant Creeping Bentgrass Cultivars, ‘Crenshaw’ and ‘L93’, by an Accumulative Degree Day Model.” Journal American Society Horticultural Science 127 (2): 224–229. doi:10.21273/JASHS.127.2.224.
- Shannon, L., S. L. Taylor, W. R. Raun, J. B. Solie, G. V. Johnson, M. L. Stone, and R. W. Whitney. 1998. “Use of Spectral Radiance for Correcting Nitrogen Deficiencies and Estimating Soil Test Variability in an Established Bermudagrass Pasture.” Journal of Plant Nutrition 21 (11): 2287–2302. doi:10.1080/01904169809365563.
- Shoemaker, H. E., E. O. McLean, and P. F. Pratt. 1961. “Buffer Methods for Determining Lime Requirement of Soils with Appreciable Amounts of Extractable Aluminum.” Soil Science Society of America Journal 25 (4): 274–277. doi:10.2136/sssaj1961.03615995002500040014x.
- Trenholm, L. E., R. N. Carrow, and R. R. Duncan. 1999. “Relationship of Multispectral Radiometry Data to Qualitative Data in Turfgrass Research.” Crop Science 39 (3): 763–769. doi:10.2135/cropsci1999.0011183X003900030025x.
- Trenholm, L. E., M. J. Schlossberg, G. Lee, S. A. Geer, and W. Parks. 2000. “An Evaluation of Multispectral Responses on Selected Turfgrass Species.” International Journal Remote Sensing 21 (4): 709–721. doi:10.1080/014311600210524.
- Van Dyke, A. 2019. “Controlling Snow Molds with CIVITAS Turf Defense in Utah.” Crop, Forage, & Turfgrass Management 5 (1): 190012. doi:10.2134/cftm2019.02.0012.
- Wilber, A. L., J. M. P. Czarnecki, and J. D. McCurdy. 2022. “An ArcGis Pro Workflow to Extract Vegetation Indices from Aerial Imagery of Small-Plot Turfgrass Research.” Crop Science 62 (1): 503–511. doi:10.1002/csc2.20669.
- Wolf, A. M., and D. B. Beegle. 2011. “Recommended Soil Tests for Macro and Micro nutrients.” In Recommended Soil Testing Procedures for the Northeastern United States, edited by, The Northeast Coordinating Committee for Soil Testing (NECC-1812),39–48. 3rd ed. Northeast Regional Publication # 493. https://sites.udel.edu/canr-nmeq/northeastern-soil-testing-procedures/
- Zhang, J., S. Virk, W. Porter, K. Kenworthy, D. Sullivan, and B. Schwartz. 2019. “Applications of Unmanned Aerial Vehicle Based Imagery in Turfgrass Field Trials.” Frontiers Plant Science 10: 279. doi:10.3389/fpls.2019.00279.
- Zhu, Q., M. J. Schlossberg, and R. B. Bryant. 2016. “Foliar Fertilization–Induced Injury and Recovery of a Creeping Bentgrass Putting green.“Journal.” Plant Nutrition 39 (11): 1589–1596. doi:10.1080/01904167.2016.1161778.
- Zhu, Q., M. J. Schlossberg, R. B. Bryant, and J. P. Schmidt. 2012. “Creeping Bentgrass Putting Green Response to Foliar Nitrogen fertilization.” Agronomy Journal 104 (6): 1589–1594. doi:10.2134/agronj2012.0157.