
 ?Mathematical formulae have been encoded as MathML and are displayed in this HTML version using MathJax in order to improve their display. Uncheck the box to turn MathJax off. This feature requires Javascript. Click on a formula to zoom.
ABSTRACT
Beacon towers are an important infrastructure responsible for transmitting military information in ancient times. However, many of the beacons have disappeared due to natural erosion and man-made vandalism. Historical U2 aerial images provide heritage and geographical information over the last century to research the beacon tower system. However, the fragmented distribution of beacons and the greyscale colouring of the aerial images make it difficult to manually identify small-sized beacons in a wide range of aerials. This study introduced deep learning to automatically detect beacons in U2 images. Three improvements were added to the standard Fully Convolutional One-Stage Object Detection (FCOS) network: 1) The structure of the Feature Pyramid Network (FPN) was adjusted to enhance the small objects feature at lower layers; 2) The standard convolutional kernel in backbone network was replaced with DCNv2 to account for irregular towers; 3) NMS was replaced with Soft-NMS to improve the accuracy of the detection box prediction. Our results demonstrate that more than 60% average precision (AP) can be obtained using our improved FCOS. After testing, the results showed that the three-part methodology can automatically detect most beacons in historical U2 aerial images, reduce the manual miss rate, and improve efficiency. The results of the test were the first to successfully identify destroyed beacons, recreate the beacon route, and retrace the beacon siting strategy. Our method helps to speed up the efficiency of heritage excavation in historical aerial images, and it may provide a convenient means of processing in other architectural heritage restoration studies.
1. Introduction
1.1. Beacons on the Great Wall and their state of preservation
The Great Wall in northern China is one of the largest cultural heritage sites in the world, spanning 15 provinces. The Ming Great Wall is the epitome of ancient Chinese military defence and represents the highest level of ancient military engineering (). Studying the Ming Great Wall contributes to better understanding of Chinese frontier politics, defence patterns, and military strategy. The beacon system (bottom right of ) is one of the most important tools in the Wall’s military defence system, helping to achieve coordination and synergy (Yan, Zhang, and Zhe Citation2011). The beacons worked by relaying the enemy’s movements from tower to tower and transmitting information from the wall to the settlements.
Figure 1. Distribution of the ming great wall, including walls, beacons, military forts, and other architectural monoliths.
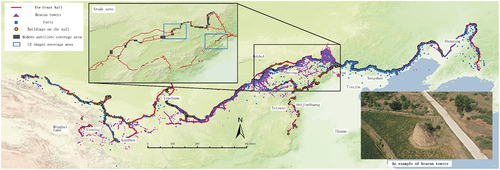
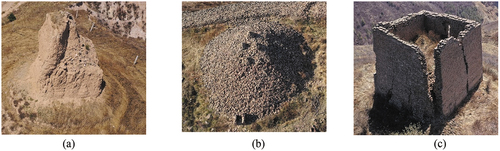
According to data published by the Great Wall Resource Survey (GW Resource Survey), presently, 50% of the total wall installations have disappeared or are on the verge of disappearing (“The Great Wall Conservation Master Plan Citation2019). Moreover, beacons are more impacted by human activity and less preserved compared with the wall. () Note the GW Resource Survey project only completed statistics of destroyed wall facilities, and these data are not yet available for beacons.
Figure 2. Examples of existing beacons that are in poor condition (eroded or collapsed): (a) an irregularly shaped weathered beacon; (b) a completely collapsed and unrecognizable beacon; (c) a beacon with a collapsed interior and standing brick outer wall.
1.2. Previous methods of detecting beacons
Detection beacon towers is time-consuming, labour-intensive and expensive. Archaeologists usually acquire tower locations by relying on visible architecture, consulting historical texts, or asking local residents. The scattered distribution, severe damage, and sparse remains of beacons make field investigation difficult. Further, the lack of information on geographical coordinates in historical texts makes locating beacons even more difficult. Residents’ knowledge alone cannot be used for validation. It is therefore challenging to obtain complete information on the location of beacons by the means described above, especially those where the above-ground remains have disappeared. Research should include counting destroyed beacons, mining the number and locations of destroyed beacons, and filling the gap in analyses of destroyed beacons. In particular, an automatic method of acquiring disappeared beacons should be established to improve efficiency.
1.3. Application of historical remote sensing images in archaeology
Historical pictures and texts can retain information about the location and shape of architectural features. The distance between beacon towers was recorded in ancient texts as ‘one pier in five miles’ (Zhang Citation2013). However, due to the influence of terrain and manmade construction, the distance between beacons does not precisely follow the rule of ‘five miles’. Historical maps may record the number of beacon towers in relation to the walls and related military forts, as well as their approximate relative positions. However, these maps do not provide the latitude and longitude for geolocating each beacon; additionally, the morphology of beacons is missing. Historical remote sensing images from the 1960s and 1970s can retrace the location information of architectural features more accurately; the method has been applied in the field of archaeology (Fowler Citation2013).
Currently, historical satellite images are mostly used to observe the development and changes of heritage sites. For example, Russian KVR-1000 satellite images were used for archaeological research at Stonehenge (Fowler Citation1996) and the Euphrates River basin (Comfort Citation1997). Keyhole satellite data launched by the United States after the 1960s are frequently used in the field of archaeology (Rosa and Masini Citation2011). Visual methods are used to make archaeological discoveries using imagery of ancient settlements (Deroin, Bou Kheir, and Abdallah Citation2017), road networks (Watanabe et al. Citation2017), farming and animal husbandry systems (Casana Citation2013), and geological changes (Sarah, Gregory, and Chase Citation2017). There are also results of synergistic comparative analysis of joint multiple satellite data. For example, Huanhuan and Song (Citation2019) combined Keyhole and RESURS F1 satellite data to analyse the expansion of settlements in Tongzhou, Beijing. Hammer et al. (Citation2018) used Keyhole and HEXAGON satellite data to visually analyse and compare the impact of political factors and warfare on the destruction of monuments and heritage sites in Afghanistan in different periods.
In addition to historical satellite images, historical aerial images are used for archaeological discoveries. Since World War II, archaeological analysis using historical aerial images has mainly focused on military data collection by the U.S. Air Force, the German Nazi Air Force (Luftwaffe), and the British Royal Air Force (RAF) (Saunders Citation2009). For example, a comparative analysis of the ancient city of Samarra in Iraq was carried out using the data of the Luftwaffe and RAF in 1918 and satellite data in 2004 (Bewley and Kennedy Citation2013). Based on aerial images of Spain taken by the U.S. Air Force in 1945, the destruction of Roman military sites was analysed (García et al. Citation2016). Hammer developed a spatial indexing system for the Middle East based on images taken by U2 spy planes and analysed the architectural heritage sites of the Middle East (Hammer and Jason Citation2019). Starková (Citation2020) analysed the archaeological landscape of an Iraqi city using U2 aerial images. Such historical aerial images are dated earlier and with better clarity than historical satellite images, and they can reflect more original information about the location and status of architectural heritage sites. Therefore, this paper uses aerial images captured by Taiwan pilots flying U2 high-altitude reconnaissance aircraft over the Chinese mainland in the 1960s; the ground resolution is higher than 1 metre, effectively covering the area where the Chinese beacons were distributed.
1.4. Traditional means of archaeological analysis of historical remote sensing data based on visual observation
The analysis methods of the aforementioned literature are mainly visual observation, which requires a large amount of labour in finding a specific heritage site from a vast image. In addition to the manual visual method, new computer algorithms have been introduced by some scholars to improve the identifiability of the data. Starková (Citation2020) introduced a variety of remote sensing data and algorithms to build a digital surface model (DSM) to enhance the visual recognition efficiency of U2 images. All of the above visual archaeological studies are focused on a city or a small area. Although visual methods can provide relatively accurate analytical results, they are clearly not suitable for large-scale archaeological excavation of heritage sites.
1.5. Automated means of archaeological analysis of historical remote sensing data represented by machine learning and deep learning
With the development of computer technology, machine learning has been introduced into archaeological analyses of remote sensing data. The efficiency of archaeological analysis has been improved such that heritage sites within a large area can be automatically detected. Orengo et al. (Citation2020) used a random forest model to automatically detect earth mound sites in Sentinel satellite images. Schuetter et al. (Citation2013) used edge extraction to automatically detect graves in QuickBird satellite images.
The introduction of deep learning further improved the efficiency of archaeological analyses of historical remote sensing images. This method uses a manually annotated dataset to train a model to automatically annotate heritage sites. Chen et al. (Citation2021) used deep learning methods to develop an automatic detection method for graves in satellite images. Soroush et al. (Citation2020) used deep learning to realize the automatic segmentation of qanat based on corona historical satellite images. Historical U2 aerial images have mainly been studied by visual observation (Hammer and Jason Citation2019; Starková Citation2020) because of their relatively small coverage area and short decryption time; there is no automatic detection method for such historical aerial images.
1.6. Research questions
Deep learning has achieved satisfactory results in detecting specific objects such as aircraft (Wu et al. Citation2015), ships (Kartal and Duman Citation2019), and buildings (Ok, Senaras, and Yuksel Citation2013) from modern satellite images. However, modern satellite images are four-channel colour images with abundant data; aircraft, ships, and other objects have obvious edges and contrast with the background. The single-channel greyscale U2 images used in this paper contain minimal data, and the beacons appear small. Some of the beacons are damaged or collapsed, resulting in blurred edges (). Moreover, the brick-and-stone earth structures are less distinguishable from the surrounding landscape. A single vertical U2 image covers a large area (approximately 1300 × 7600 metres for an image size of 19,305 × 9652 pixels). The beacon towers are not only small but also occupy a small area in the image (actual diameter of about 5–10 m and image size of about 20–100 pixels), further increasing the difficulty of identification. Therefore, existing deep learning methods need to be modified for beacons and U2 images to improve recognition accuracy.
We address two research questions in this paper:
Can deep learning techniques be applied to the problem of identifying historical beacon towers in U2 images?
Can the new methods improve the accuracy of the existing object detection neural networks for beacons?
2. Study area and data
2.1. Study area
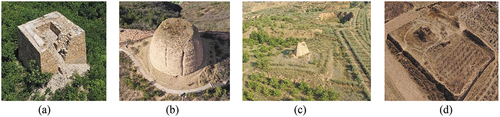
This paper studies beacons in Hebei and Shanxi Provinces (area marked in ). These beacons are stone masonry, brick wrapped, rammed earth, and other structures, with square and round shapes; some have an enclosed courtyard outside (). Most types of Ming Dynasty beacons are present. The high population density, construction, abundant rainfall, and erosion in this region have led to the destruction of beacons (). The existing beacons are generally 3–5 metres, with more severely decayed structures measuring only half a metre. Some beacons along the extension from the wall to the inner settlement are closer to human settlements and more damaged; these are the main research subject of this paper.
Figure 3. Beacons of different forms in the study area. (a) Square Beacon. (b) Round Beacon. (c) No Courtyard Beacon. (d) Courtyard Beacon.
2.2. U2 images
The U2 image data used in the study included original aerial photographs and route description maps (). There are three routes in each direction with some image overlap, and each route is recorded by left and right cameras. According to a study on the application of archaeological research in the Middle Eastern (Hammer and Jason Citation2019), a U2 image could resolve objects between 30 and 50 cm on the ground at nadir. The route description map records the approximate latitude and longitude of the route and also the location information of the aerial images. Based on the approximate coordinates, it is possible to detect the city in which the U2 images were taken. Based on information about less altered ground objects such as mountains, rivers, roads and ancient cities, geographic information from U2 images aligned with the modern satellite images. At least three locations per U2 image were selected for ‘Auto Ajust’ using ArcGIS georeferencing tools. The magnitude of error is guaranteed to be no more than one metre compared with direct visual observation. Therefore, the longitude and latitude of the U2 images can be obtained with ArcGIS software based on the ground feature information in the images and the continuity between them. shows the two coverage areas where geographical calibration was completed.
Figure 4. U2 route description.
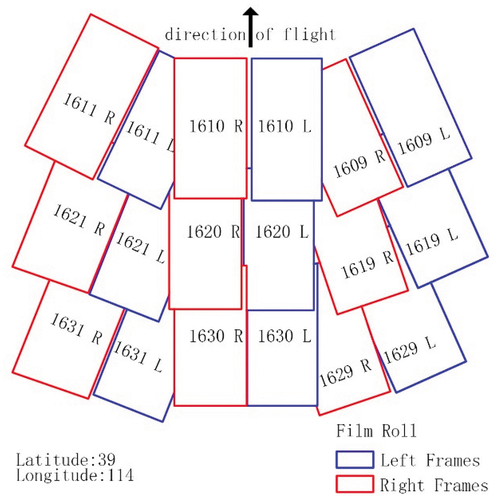
Figure 5. Two U2 images coverage areas that have been geographically aligned.
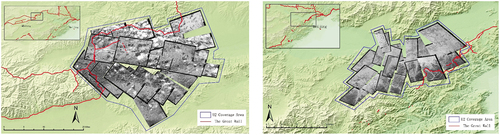
This paper uses images from the middle vertical route for object detection because images taken from the outer route produce perspective distortion.
3. Method
The workflow of the presented method is shown in . First, object detection datasets are automatically labelled using modern remote sensing satellite imagery and geographic information on surveyed beacons. Then, we propose an improved Fully Convolutional One-Stage Object Detection (FCOS) network by adding three improvements. Finally, the automatic detection beacon model is obtained after training the data.
Figure 6. The workflow of our presented method.
3.1. Data pre-processing
3.1.1. Acquisition of raw data for the training dataset
In this paper, modern satellite image data and beacon geolocation data obtained from the GW Resource Survey were used to build a dataset for object detection. Note, it is more difficult to detect beacons manually in U2 images, while modern satellite images can achieve a resolution between 1 and 2 metres similar to that of U2 images. The modern satellite images were downloaded from Google Earth. The images are post-processed using RGB renderings from the original optical aerial images. After converting to greyscale, the images have the same single channel as the U2 images. After geo-alignment, the U2 images and modern satellite images have similar distortion and spatial resolution. Therefore, we use satellite images from Google Earth to build the beacon training dataset.
Based on the data of the GW Resource Survey, satellite images of several areas where the beacons are well preserved were acquired from Shanxi and Hebei Provinces (grey area in ). To avoid the effects of snow, forest cover, and clouds, clear sky images from spring and autumn were selected where possible. Finally, 102 large-size images (1968 pixels to 11,552 pixels) were obtained (remote sensing images in ).
Figure 7. Process of semi-automatic generation of target detection data sets using modern satellite images.
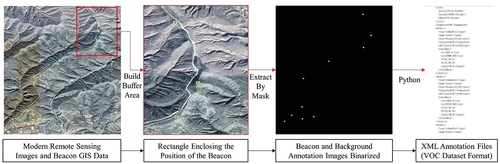
Semi-automatic creation of object detection training datasets can be achieved with ArcGIS software and Python programming. Based on the existing beacon GIS data, the point elements of each beacon were generated into surface elements with the same-size radius using the generated buffer analysis function of ArcGIS software. Using the mask extraction function, RGB images with separated object and background regions were obtained. Only 0 and 1 images with pixel values (0 for the object and 1 for the background) were obtained using the reclassification function. Using Python, the results were converted into XML annotation files as a VOC format object detection dataset (as shown in ).
3.1.2. Splitting raw data using sliding windows
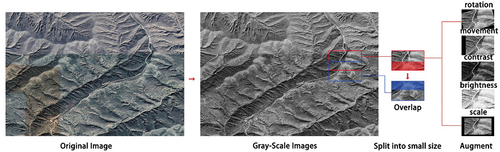
The size of the modern remote sensing image obtained above is much larger than the image size (500 × 300 pixels) used for training by CNN, so it was necessary to segment the image using the sliding window method (). Also, to avoid incomplete recognition of objects due to segmenting, an overlap rate of 30% was maintained between the segmented images. Ultimately, 979 images were obtained. To obtain an image similar to the actual U2 images, the RGB three-channel image was transformed to a greyscale image with only black-and-white channels (). After analysis, 1069 beacon objects were identified in the dataset; 70% of the images were selected for training and 30% were used for validation.
Figure 8. Sliding-window processing in which large images were split using a single sample data enhancement method.
To accurately evaluate the results with U2 images, a test set of U2 images of beacon objects was developed. A total of 328 images with 500 × 300 pixels were manually labelled ().
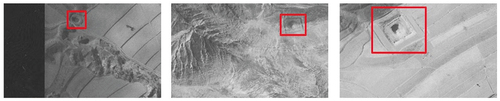
Figure 9. Examples from the test set created by U2 images.
3.1.3. Data augment
Due to the limited number of source images, we also used single-sample and multiple-sample image augmentation techniques to increase the robustness of the model. Single sample means that all augments are performed on a single sample. Multi-sample data augmentation refers to the use of multiple samples to add combinatorial changes to produce new samples.
The first is single-sample data augmentation, which addresses lightness and darkness variations, image deformation, and rotation that may occur in actual U2 images.
Second, for the multi-sample data augmentation, Mosaic (Bochkovskiy, Wang, and Mark Liao Citation2020) and MixUp (Zhang et al. Citation2017) were selected. The principle of the former method is that four images are randomly cropped, scaled, colour gamut adjusted, and stitched into one image for training (). The latter method is a combination of two images to produce a single image ().
Figure 10. Mosaic image augmentation result.
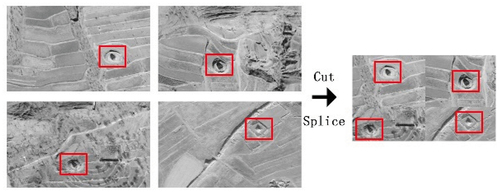
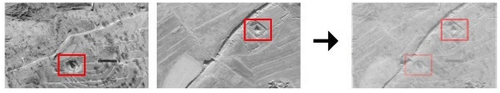
Figure 11. MixUp image augmentation result.
3.1.4. Addition of negative samples
Because the beacon tower has similarities to other earth mounds, using the dataset containing only beacons for training will produce false detections and missed detections. Therefore, we also collected images of relevant regions that do not contain beacons as negative samples to participate in the training ().
Figure 12. Addition of negative samples (examples).
3.2. Problem with small object detection
The detection object itself and the dataset need to be analysed before selecting a suitable CNN structure. The clustering algorithm can effectively divide the data with high similarity and summarize the characteristics of the object detection frame size. In the suite of YOLO detection algorithms (Redmon and Farhadi Citation2018), the K-means algorithm was used for developing statistical bounding box priors and sizes. K-means++ (Arthur and Vassilvitskii Citation2007) optimizes the choice of initial values for the K-means algorithm to reduce clustering errors. Different numbers of clustering centres were set up separately, and the average Intersection over Union (IoU) was calculated as shown in the .
Figure 13. Comparison of the average IoU with different bounding box prior size.
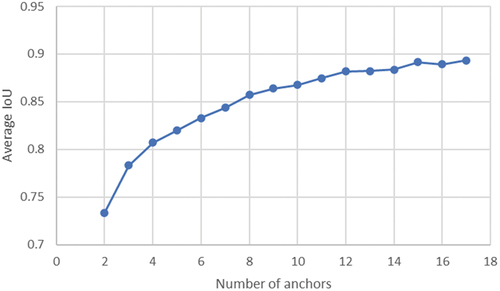
To determine the K value and the size of the bounding box priors, we calculated the sizes of the box for different K values. From , it appears that the box size redundancy occurs when K = 8. For example, for K = 8, the size of bounding box priors (30 × 26) and (28 × 31) are similar. For K = 9, the size of bounding box priors (31 × 27) and (35 × 33) are similar. So, a value of 7 for K is appropriate. Compared with the bounding box priors’ size statistics for the COCO dataset in yolov3 (K = 9), the values in this paper are significantly smaller, regardless of the value of K.
Table 1. Size of bounding box prior for different values of K and size of bounding box prior for the COCO dataset with K = 9.
Therefore, the object detection problem for beacons can be approximated as small object detection.
Small object detection is generally less accurate than for large objects. Taking the COCO dataset as an example, the same algorithm has a detection accuracy of 38.4% for small objects and 68.0% for large objects (Tan, Pang, and Le Citation2020) because the small object images have less information. Consider a 15 × 15 pixels object and ResNet50 feature extraction network in which the sampling rate is 16. After feature extraction, the size of the object on the feature map is less than 1, which makes it difficult to extract adequate features. Therefore, suitable CNN and improved methods for small objects need to be selected to enhance the detection efficiency of beacons.
3.3. CNN structure
This paper designs an object detection CNN for beacons in U2 images based on the FCOS (Tian et al. Citation2019), which is an anchor-free method. On the Tinypersons dataset used to evaluate the small object detection algorithm, FCOS achieves the best result (96.12%) on the tiny object miss rate (MRtiny50) (Xuehui et al. Citation2020), proving that the network has a lower miss rate in targeting the small object problem. Therefore, to detect as many beacons as possible, FCOS was chosen as the basic structure.
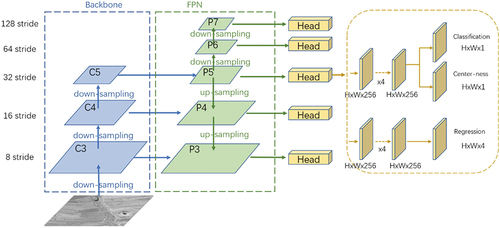
FCOS realized pixel-by-pixel object detection with an anchor-free structure. Multi-scale object detection is achieved by using the feature pyramid networks (FPN) to perform feature fusion on the three feature layers of C3, C4, and C5 from the backbone network to obtain P3, P4, and P5. Based on P5, down-sampling was applied to obtain P6 and P7. The output layer on the right-side includes classification, centre-ness, and regression of four parameters. The centre-ness localization strategy can avoid the influence of the anchor pre-set parameter on the results ().
Figure 14. Structure of original FCOS network.
3.4. Improvement techniques
To further improve the efficiency of beacon detection, three improvements were added to the FCOS network structure. Ablation experiments were used to compare the effects of several improvements.
3.4.1. Adjusting the structure of FPN to acquire image features at the lower layers
For small objects with fewer pixels, down-sampling of the backbone and FPN structure in the FCOS causes the loss of object information such that the network is unable to learn the effective features of the objects. The beacons in U2 images are usually small. Therefore, reducing the feature layers can obtain more feature information from the underlying feature layer, which can increase the accuracy of beacon tower detection.
In the original FCOS network, the stride size of a feature map is 8, 16, 32, 64, 128. Most beacons in the images are about 50 pixels. For 64 and 128 strides, the final size of the beacon on the feature map is less than 1, in which case feature information is lost. Therefore, removing the high-level feature maps (P6, P7), adding C2 with a stride of 4 and the corresponding P2, and adding the P5 structure corresponding to C5 is needed to meet the needs of beacon recognition of about 100 sizes.
FCOS has additional parameter settings for different step size feature maps using various size detection boxes. The original regression box range is ([−1, 64], [64, 128], [128, 256], [256, 512], [512, INF]). In this paper, the largest beacon object is smaller than 140, so the latter two size ranges are redundant. To reduce the redundancy of the anchor box as much as possible, the last two ranges were deleted, and the size box range of [32, 64] was added to obtain ([−1, 32], [32, 64], [64, 128], [128, INF]) for the four feature maps.
3.4.2. Deformable convolution network v2 (DCNv2)
To build object detection models, backbone networks often use standard convolutional kernels, such as regular sampling regions of 3 × 3 or 5 × 5 suitable for object detection with clear boundary rules. However, the method lacks the ability to adapt to irregular shapes. The beacons have round or square shapes () and irregular shapes due to deformation (), so it is difficult to fit their shapes using standard convolution kernels. The DCNv1 module is a deformation adjustment of the pooling layer while adding an offset to the sampling position of the standard convolution kernel. DCNv2 is based on this setting, adding a modulation mechanism to adjust the learned feature magnitude (Zhu et al. Citation2019), and the detection accuracy is higher. Therefore, the standard convolutional kernel in the ResNet backbone network was replaced with DCNv2.
3.4.3. Soft-NMS
In the object detection algorithm, a large number of prediction boxes are generated during the prediction calculation, and NMS is often used to filter the final detection boxes. The traditional NMS continuously performs IoU analysis with the maximum confidence detection box against other boxes by removing the boxes with larger IoU with the following equation:
where Nt represents the threshold value for IoU filtering.
However, since NMS removes all boxes with IoU values greater than Nt, a threshold set too low will result in the deletion of overlapping objects. If set too high, it tends to increase the risk of false detection. Bodla et al. (Citation2017) propose Soft-NMS, which reduces the confidence level of detection boxes larger than the threshold by adding a Gaussian function as follows:
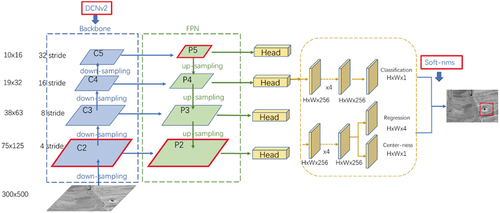
Therefore, this study added Soft-NMS to the detection stage to improve the accuracy of the detection box prediction. To summarize, the overall improvement process is shown in (red indicates the modified sections).
Figure 15. Structure of Improved FCOS network.
4. Results
In this section, the network structure established in the previous section is used to train the dataset. Four-fold validation is used to determine the final model. The U2 image test dataset is used to test the final model. To fully illustrate the superiority of the method established in this paper and the usefulness of the improvements, ablation experiments were used for comparative analysis.
All experiments were performed on a computer with an i7 CPU, 64 GB of RAM, an Ubuntu system, and NVIDIA GeForce RTX 2080Ti GPU.
4.1. Performance validation
After simple image processing, the modern satellite dataset was used to train and build an object detection model for the U2 images. The highest accuracy of our model was 67% at the IOU threshold of 0.5. The aim of this paper is to help archaeologists detect as many towers as possible. Although the results are less precise at an IoU of 0.5, more beacons can be detected.
4.1.1. Comparison of the results of different improvement methods
The precision rate and recall rate of commonly used detection indicators in object detection are applied in this paper. The AP, AP50, APS, APM, APL, Recall, RecallS, RecallM, and RecallL are used to evaluate the detection performance of the network. The above indicators are the same as the metrics considered with the COCO dataset. The AP is the area enclosed by the curves of precision and recall. The calculation of precision, recall, and AP are as follows:
where TP=True Positive, TN=True Negative, FP=False Positive, FN=False Negative.
According to the criteria for classifying object sizes in the COCO dataset, a tower is classified as a small object (smaller than 32 × 32 pixels), medium object (smaller than 96 × 96 pixels) or large object (bigger than 96 × 96 pixels). APS, APM and APL represent AP for small towers, medium towers and large towers. RecallS, RecallM and RecallL represent recall for small towers, medium towers and large towers, respectively. AP and Recall are averaged over multiple IoU values from 0.5 to 0.95. AP50 and Recall50 are computed at IoU of 0.5.
Overall, the improved FCOS outperformed the original FCOS in our datasets. The Recall50 value is 0.591 and the AP50 value is 0.67 for the improved FCOS with the low-feature method; more than half of the beacon towers were successfully detected. In the following sections, the improved FCOS was used to detect the heritage sites in U2 films. The results detected by this method are discussed in this paper and compared with other types of object detection CNN.
4.1.2. Ablation experiment
To analyse the behaviour of different improvement methods, we conducted several ablation studies. The results are shown in . All of the experiments were tested on the same environment.
Table 2. Performance of various improvement algorithms.
The impact of the low-feature experiment: Adding a C2 feature map renders the small object features better (second row of ). To match the added feature maps, the size range of anchors on feature maps was modified to better match the size of the beacon. From the results, the APs increased by 0.04, which is more obvious compared with the APm. To match the added feature maps, the size range of anchors on feature maps was modified to better match the size of the beacon. Since the number of large objects accounted was reduced, the improvement of APL may be coincidental. In summary, the addition of underlying information can improve the recognition efficiency of small beacons.
The impact of DCNv2: In particular, the highest results were obtained on the APs, which may be due to the more irregularities of the small beacons, making the effect of DCNv2 on this metric more prominent.
The impact of Soft-NMS: In addition to the accuracy improvement, the method has a more significant improvement in recall. Soft-NMS retains detection boxes larger than the IoU threshold, while the original nms directly deletes such boxes. Therefore Soft-NMS effectively improves the recall rate and reduces the missed detection of beacons.
From the perspective of computational efficiency, using the low-feature can reduce the detection time of the network. In this paper, we use FPS to measure the computational efficiency, which represents how many photos per second the model can detect. From the experimental results, the highest detection speed was obtained by the method of using the low-feature. The method of adding DCNv2 makes the detection speed decrease due to the increased computational effort.
In summary, all three means improve the efficiency of automatic detection of beacons to different degrees. The Improved FCOS method proposed in this paper has the highest accuracy and also has good real-time performance, which is faster than the original FCOS method and can provide automatic detection results more quickly. Compared to other methods, DCNv2 shows the most significant improvement for targeting small beacons.
4.2. Comparison with other studies
We compared the improved FCOS method with other object detection methods, including TOOD, RetinaNet (Lin et al. Citation2017), Faster R-CNN-FPN (Lin et al. Citation2017), and Cascade R-CNN. These four networks have the same basis (with regular convolutional kernel), the remaining parameters refer to the initial values in these papers. AP and recall with an IoU of 0.5 were selected for evaluation. ResNet50 was used as the backbone for all methods. With the exception of the Improved FCOS method, the anchor sizes and scales for the remaining methods maintain the values in the original papers. The same dataset and the same computer were used for all experiments. The results are shown in . The TOOD model detects towers better than the RetinaNet model (both one-stage approach). This finding is consistent with the results tested on the COCO dataset. The Cascade R-CNN model detects the towers better than the other methods. However, according to the papers’ data (Cai and Vasconcelos Citation2018; Feng et al. Citation2021), the TOOD model produced better results with the COCO dataset than the Cascade R-CNN. The structure of the cascade stage allows for a more accurate model in terms of detecting small beacons. Overall, the experimental results show that our method had the highest accuracy and recall. The comparison indicates that cutting a larger stride feature map, and adding a lower one can not only improve the detection accuracy but also increase the recall.
Table 3. Performance of different algorithms.
4.3. Visual inspection to verify the results
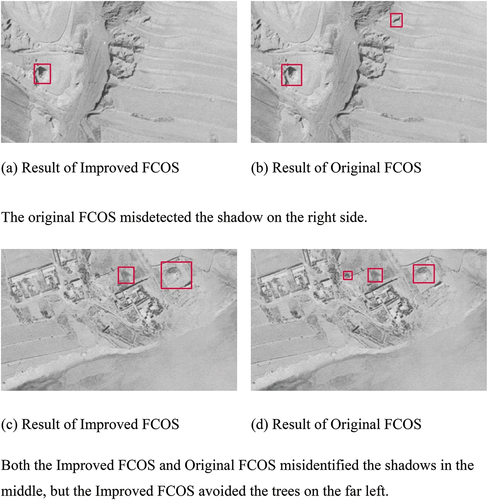
In addition to the quantitative analysis using the above metrics, this study also visually verified the improved FCOS detection results (). Trained researchers were invited to adjudicate the results. Conditions for judging beacons were as follows: Typically, the beacon has a foundation that juts out of the ground and an enclosed courtyard outside. The external edges of the beacon are relatively flat, with traces of manual excavation. In contrast, the outer borders of the trees are usually rough, with a finely serrated appearance. Direct analysis of the results shows that beacons with a relatively large size, a regular shape, and not covered by clouds are easiest to identify. Moreover, the improved FCOS is more accurate than the original FCOS, and it can effectively avoid the impact of some shadows and trees. The method of this paper can be applied to U2 images for automatic detection of beacons, and it can improve the performance of the original FCOS in detecting beacons.
Figure 16. Comparison of the detection results of the Original FCOS and Improved FCOS for the beacons.
4.4. Automatic detection of beacon position in U2 images based on the improved FCOS model and analysis of construction intention based on test results
To further illustrate the effectiveness of this method for archaeological and architectural heritage sites, this study used the established beacon automatic detection model for the analysis of U2 images. The identification results were also compared with the positions of beacons recorded in the GW Resource Survey.
From the identification results, six locations near Pingyuan Fortress were beacons that were not included in the GW Resource Survey, and four places near Xiyanghe Fortress were not recorded in the GW Resource Survey (yellow triangles in ). New beacon routes can be connected through new beacons found in the U2 images. The model established in this paper found three beacons on the northwest side of Pingyuan Fortress in the U2 image, consistent with the positions of the three beacons near the wall in the historical map (blue box in ). According to modern satellite data, the west side of Pingyuan Fortress beacon was not recorded by the GW Resource Survey because it had completely disappeared ().
Figure 17. Comparison between U2 image detection results and the GW Resource Survey data; analysis with historical map annotation results.
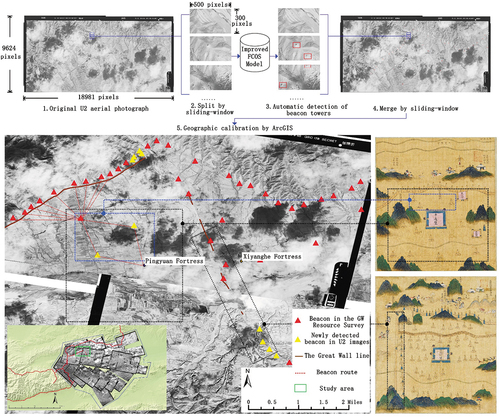
Figure 18. Explanation of newly discovered beacon in the U2 images not recorded in the GW Resource Survey.
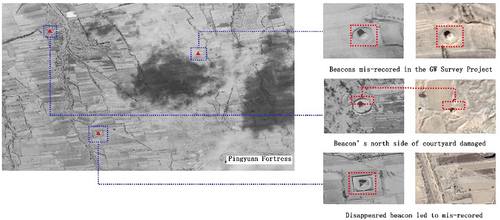
Moreover, the U2 detection results can provide the morphological characteristics of the beacon before it was damaged. The U2 image in records the non-destructed enclosed courtyard outside the beacon, and the result can be used to help analyse the grade, building function, etc., of the beacon.
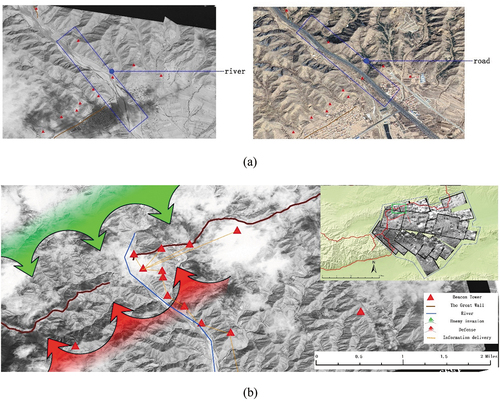
In addition, based on the detection results of the beacon in U2 images, the historical intention of the beacon construction can be further understood. Due to geographic changes, water-level decline, and modern road facility plans, many ground features have changed. For example, the river that once existed in the U2 images in is now a highway. Based on the automatic detection results of beacons in the U2 images (), the beacons outside the Great Wall line are distributed northward along the river. The location and orientation are placed such that the enemy could be monitored coming from the north, and the relatively flat road facilitates mutual observation and communication between beacons and also facilitates soldiers’ rotation.
Figure 19. U2 images help understand beacon position selection before the river change. (a) Comparison results of U2 images with modern satellite images. (b) Analysis of the location of the beacon built on the originally extended river in the U2 images.
The above two examples demonstrate the important role of object detection models in the study of U2 images; specifically, the method can improve research efficiency, help manual selection of heritage sites, provide basic data for subsequent research in the discovery of missing beacons, help uncover beacon transmission routes, and pinpoint beacon locations.
5. Discussion
5.1. Advantages of automatic detection of beacons in U2 images
The results demonstrate that the use of Improved FCOS is very successful in detecting beacons even when the object size is small. The metrics-based measurement results also demonstrate the methods used here can effectively improve the efficiency of FCOS in detecting small architectural heritage sites.
The joint analysis of U2 images, modern satellite images, and historical maps proves that the automatic detection of heritage sites in historical images can improve the analysis efficiency and provide a basis for beacon transmission route research and beacon position analysis. The method can broaden the current spatio-temporal analysis of the Great Wall and compensate for the impact of missing data on the accuracy of recovering beacon routes.
5.2. The difficulty of automatic detection of small object heritage sites
From the experiments, the Improved FCOS proposed in this paper can improve the recognition efficiency of small target heritage objects. Small object detection is not only a classical problem in the field of computer vision (Xuehui et al. Citation2020) but also an open problem in the detection of heritage objects in remote sensing. The paper also illustrates the difficulty of detecting burial heritage sites below 11 metres (beacons are usually smaller) in modern satellite images (Chen et al. Citation2021). Although the overall AP50 for detection was only a maximum of 0.67, the methods improved the detection accuracy of small object heritage sites. In the future, we plan to use this improved FCOS to detect other types of architectural heritage sites in U2 images and apply it to modern satellite images to detect small object heritage sites.
5.3. Limitations of the study
In addition to the advantages of U2 images in the field of architectural heritage analysis, the method has some limitations.
5.3.1. Misdetections in identifying the beacons
Although the present method can detect most beacons, there are still some beacons that are easily confused with the background and difficult to distinguish because of their small size and unclear boundaries. An automatically detected collapsed beacon (on the right side of ) was not fully exposed due to local flooding and cloud cover. It is also difficult to fully determine whether the object is a beacon only based on manual image analysis.
Figure 20. Improved FCOS applied to U2 image detection results and analysis of mis-detected objects. The red box is the automatic detection annotation, the green box is the correct detection annotation, and the blue box is the missed detection annotation.
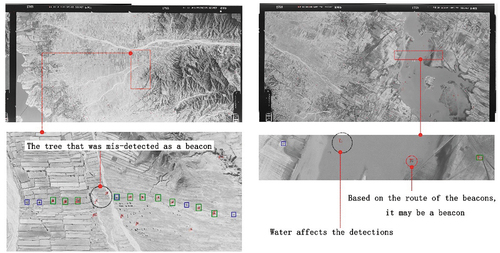
Sections of the objects that are difficult to discern can be determined by the distribution of surrounding beacons according to whether or not they are on the route of beacon transmission. In , the detected objects in the U2 image on the left are along the continuous beacon transmission route, so they can be safely categorized as beacons.
5.3.2. U2 images span a short period of time
Although U2 images have high resolution, they are only available since the 1960s. Single images cannot provide a multi-temporal comparative analysis, so they need to be combined with modern satellite images, other satellite historical aerial images, and measured image data taken by UAV to observe heritage changes.
5.4. Future work
In addition to extending the detection range of U2 images and enhancing the detection accuracy of beacons, the types of heritage objects that can be automatically detected in U2 images can be expanded in future work: walls, buildings, and settlements. Additional types and a wider range of heritage sites can be automatically identified to help complete historical archaeological discoveries. Moreover, the present method can be extended to other types of historical images, such as Corona satellite images, and multitemporal analysis can be achieved.
6. Conclusion
In this study, we use deep learning to implement automatic detection of beacons in U2 images. The results show that the object detection method based on CNN can effectively detect beacons in U2 images, even when using datasets built upon several hundred modern satellite images. The performance of the original FCOS in detecting beacons was improved by reducing the stride size, the number of feature layers, adjusting the pre-set parameters in FCOS, changing the standard convolutional kernel to DCNv2, and adding Soft-NMS to the prediction. From the test comparison results, the method can effectively improve the detection accuracy of beacons, achieving a final accuracy of more than 60% (i.e. detection of most beacons).
From the results of the application, the method was able to automatically search for relatively small beacons over a large area of U2 images. The method can help discover missing beacons and further complement the presumed beacon transmission routes. Further, the method eliminates the influence of modern infrastructure and elucidates the original intention of the beacon construction. Although the experiment focuses on beacons in Hebei and Shanxi Provinces, it can be adapted and applied to other regions and other types of architectural heritage sites.
In the future, the automatic detection method can be applied to conduct archaeological analyses of historical aerial images of other architectural heritage sites, such as fortresses and gates, forming a more complete picture of the Great Wall. We will introduce new algorithms and data to improve the detection accuracy of the method, such as adding Corona satellite image data, to perform multi-temporal analyses of architectural heritage sites and observe the original state and evolution of heritage sites.
Acknowledgements
U2 historical aerial images provided by the Center for GIS, RCHSS, Academia Sinica, Taiwan.
Disclosure statement
No potential conflict of interest was reported by the authors.
Additional information
Funding
References
- Arthur, D., and S. Vassilvitskii. 2007. “K-Means++: The Advantages of Careful Seeding.” Paper presented at the Proceedings of the Eighteenth Annual ACM-SIAM Symposium on Discrete Algorithms, SODA 2007, New Orleans, Louisiana, USA, January 7-9, 2007.
- Bewley, R., and D. Kennedy. 2013. Historical Aerial Imagery in Jordan and the Wider Middle East. In Archaeology from Historical Aerial and Satellite Archives, edited byW. Hanson, and I. Oltean, 221–242. New York: Springer NewYork Heidelberg Dordrecht London.
- Bochkovskiy, A., C.Y. Wang, and H.Y. Mark Liao. 2020. “Yolov4: Optimal Speed and Accuracy of Object Detection.” arXiv preprint arXiv:2004.10934.
- Bodla, N., B. Singh, R. Chellappa, and L. S. Davis. 2017. “Improving Object Detection with One Line of Code.” arXiv preprint arXiv:1704.04503.
- Cai, Z., and N. Vasconcelos. 2018. “Cascade R-Cnn: Delving into High Quality Object Detection.” Paper presented at the Proceedings of the IEEE conference on computer vision and pattern recognition, Salt Lake City, UT, USA.
- Casana, J. 2013. “Radial Route Systems and Agro-Pastoral Strategies in the Fertile Crescent: New Discoveries from Western Syria and Southwestern Iran.” Journal of Anthropological Archaeology 32 (2): 257–273. doi:10.1016/j.jaa.2012.12.004.
- Chen, F., R. Zhou, T. Van de Voorde, X. Chen, J. Bourgeois, W. Gheyle, R. Goossens, J. Yang, and X. Wenbo. 2021. “Automatic Detection of Burial Mounds (Kurgans) in the Altai Mountains.” Isprs Journal of Photogrammetry and Remote Sensing 177: 217–237. doi:10.1016/j.isprsjprs.2021.05.010.
- Comfort, A. 1997. “Satellite Remote Sensing and Archaeological Survey on the Euphrates.” ARCHAEOLOGICAL COMPUTING NEWSLETTER 1 (48): 1–8.
- Deroin, J. P., R. Bou Kheir, and C. Abdallah. 2017. “Geoarchaeological Remote Sensing Survey for Cultural Heritage Management. Case Study from Byblos (Jbail, Lebanon).” Journal of Cultural Heritage 23: 37–43. doi:10.1016/j.culher.2016.04.014.
- Feng, C., Y. Zhong, Y. Gao, M. R. Scott, and W. Huang. 2021. “Tood: Task-Aligned One-Stage Object Detection.” Paper presented at the 2021 IEEE/CVF International Conference on Computer Vision (ICCV), Montreal, Canada.
- Fowler, M. J. 1996. “High-Resolution Satellite Imagery in Archaeological Application: A Russian Satellite Photograph of the Stonehenge Region.” Antiquity 70 (269): 667–671. doi:10.1017/S0003598X00083812.
- Fowler, M. J. 2013. “Declassified Intelligence Satellite Photographs.“ In Archaeology from Historical Aerial and Satellite Archives, edited byW. Hanson, and I. Oltean, 47–66. New York: Springer NewYork Heidelberg Dordrecht London.
- García, C., J. Manuel, J. Fonte, A. Menéndez Blanco, D. González Álvarez, M. Gago Mariño, R. Blanco Rotea, and V. Álvarez Martínez. 2016. “Roman Military Settlements in the Northwest of the Iberian Peninsula. The Contribution of Historical and Modern Aerial Photography, Satellite Imagery and Airborne LiDar.” AARGnews: The Newsletter of the Aerial Archaeology Research Group 52: 43–51.
- Hammer, E., and U. Jason. 2019. “Near Eastern Landscapes and Declassified U2 Aerial Imagery.” Advances in Archaeological Practice 7 (2): 107–126. doi:10.1017/aap.2018.38.
- Hammer, E., R. Seifried, K. Franklin, and A. Lauricella. 2018. “Remote Assessments of the Archaeological Heritage Situation in Afghanistan.” Journal of Cultural Heritage 33: 125–144. doi:10.1016/j.culher.2017.12.008.
- Huanhuan, L., and W. Song. 2019. “Expansion of Rural Settlements on High-Quality Arable Land in Tongzhou District in Beijing, China.” Sustainability 11: 5153. doi:10.3390/su11195153.
- Kartal, M., and O. Duman. 2019. “Ship Detection from Optical Satellite Images with Deep Learning.” Paper presented at the 2019 9th International Conference on Recent Advances in Space Technologies (Rast), Istanbul, Turkey.
- Lin, T. Y., P. Dollar, R. Girshick, K. He, B. Hariharan, and S. Belongie. 2017. “Feature Pyramid Networks for Object Detection.” Paper presented at the 2017 IEEE Conference on Computer Vision and Pattern Recognition (CVPR), Honolulu, HI, USA.
- Lin, T. Y., P. Goyal, R. Girshick, K. He, and P. Dollár. 2017. “Focal Loss for Dense Object Detection.” IEEE Transactions on Pattern Analysis & Machine Intelligence PP PP 99: 2999–3007.
- Ministry of Culture and Tourism of the People’s Republic of China, The Great Wall Conservation Master Plan. 2019. Overview and Value Connotation. In The Great Wall Conservation Master Plan, edited byThe Chinese National Cultural Heritage Administration. Beijing: Ministry of Culture and Tourism of the People’s Republic of China and the Chinese National Cultural Heritage Administration.
- Ok, A. O., C. Senaras, and B. Yuksel. 2013. “Automated Detection of Arbitrarily Shaped Buildings in Complex Environments from Monocular VHR Optical Satellite Imagery.” IEEE Transactions on Geoscience and Remote Sensing 51 (3): 1701–1717. doi:10.1109/TGRS.2012.2207123.
- Orengo, H. A., F. C. Conesa, A. Garcia-Molsosa, A. Lobo, C. A. Petrie, M. Madella, and C. A. Petrie. 2020. “Automated Detection of Archaeological Mounds Using Machine-Learning Classification of Multisensor and Multitemporal Satellite Data.” Proceedings of the National Academy of Sciences 117 (31): 18240–18250. doi:10.1073/pnas.2005583117.
- Redmon, J., and A. Farhadi. 2018. “Yolov3: An Incremental Improvement.” arXiv preprint arXiv:1804.02767.
- Rosa, L., and N. Masini. 2011. “Satellite Remote Sensing in Archaeology: Past, Present and Future Perspectives.” Journal of Archaeological Science 38: 1995–2002. doi:10.1016/j.jas.2011.02.002.
- Sarah, P., M. Gregory, and C. Chase. 2017. “Using Open Access Satellite Data Alongside Ground Based Remote Sensing: An Assessment, with Case Studies from Egypt’s Delta.” Geosciences 7 (4): 94. doi:10.3390/geosciences7040094.
- Saunders, N. J. 2009. “Ulysses’ Gaze: The Panoptic Premise in Aerial Photography and Great War Archaeology.“ In Images of Conflict: Military Aerial Photography and Archaeology, edited byB. Stichelbaut, J. Bourgeois, N. Saunders, and P. Chielens, 27–40. Newcastle: Cambridge Scholars Publishing.
- Schuetter, J., P. Goel, J. McCorriston, J. Park, M. Senn, and M. Harrower. 2013. “Autodetection of Ancient Arabian Tombs in High-Resolution Satellite Imagery.” International Journal of Remote Sensing 34 (19): 6611–6635. doi:10.1080/01431161.2013.802054.
- Soroush, M., K. Ur, E. Khazraee, and J. A. Ur. 2020. “Deep Learning in Archaeological Remote Sensing: Automated Qanat Detection in the Kurdistan Region of Iraq.” Remote Sensing 12 (3): 500. doi:10.3390/rs12030500.
- Starková, L. 2020. “Toward a High-Definition Remote Sensing Approach to the Study of Deserted Medieval Cities in the Near East.” Geosciences 10: 10. doi:10.3390/geosciences10090369.
- Tan, M., R. Pang, and Q. V. Le. 2020. “EfficientDet: Scalable and Efficient Object Detection.” Paper presented at the 2020 IEEE/CVF Conference on Computer Vision and Pattern Recognition (CVPR), Seattle, WA, USA.
- Tian, Z., C. Shen, H. Chen, and T. He. 2019. “FCOS: Fully Convolutional One-Stage Object Detection.” Paper presented at the 2019 IEEE/CVF International Conference on Computer Vision (ICCV), Seoul, Korea (South).
- Watanabe, N., S. Nakamura, B. Liu, and N. Wang. 2017. “Utilization of Structure from Motion for Processing CORONA Satellite Images: Application to Mapping and Interpretation of Archaeological Features in Liangzhu Culture, China.” Archaeological Research in Asia 11: 38–50. doi:10.1016/j.ara.2017.06.001.
- Wu, H., H. Zhang, J. Zhang, and F. Xu. 2015. “Fast Aircraft Detection in Satellite Images Based on Convolutional Neural Networks.” Paper presented at the 2015 IEEE International Conference on Image Processing (ICIP), Long Beach, CA, USA.
- Xuehui, Y., Y. Gong, N. Jiang, Y. Qixiang, and Z. Han. 2020. “Scale Match for Tiny Person Detection.” Paper presented at the Proceedings of the IEEE/CVF winter conference on applications of computer vision, Snowmass, CO, USA.
- Yan, L., Y. Zhang, and L. Zhe. 2011. “The Non-Linear Nature of the Great Wall: Research on the Stratified System of Military Settlements Along the Great Wall Under the Wei-Suo System of Ming Dynasty.” New Architecture 03: 118–121.
- Zhang, Z. 2013. The Great Wall Collection of Real Records of the Ming Dynasty. Vol. 196. Ningxia: Ningxia people’s Publishing House.
- Zhang, H., M. Cisse, Y. N. Dauphin, and D. Lopez-Paz. 2017. “Mixup: Beyond Empirical Risk Minimization.” arXiv preprint arXiv:1710.09412.
- Zhu, X., H. Hu, S. Lin, and J. Dai. 2019. “Deformable ConvNets V2: More Deformable, Better Results.” Paper presented at the 2019 IEEE/CVF Conference on Computer Vision and Pattern Recognition (CVPR), Long Beach, CA, USA.