
 ?Mathematical formulae have been encoded as MathML and are displayed in this HTML version using MathJax in order to improve their display. Uncheck the box to turn MathJax off. This feature requires Javascript. Click on a formula to zoom.
ABSTRACT
Based on the hourly precipitation data from the observation stations, the accuracy of hourly QPEs from Fengyun geostationary satellites FY-4A, FY-2 H and multi-satellite joint IMERG-Early precipitation products over the southeastern Tibetan Plateau were compared and assessed. And the relationship between the accuracy of various satellites and terrain were discussed. The results show that: (1) The QPEs of FY-4A, FY-2 H and IMERG-Early can reflect the temporal and spatial distribution characteristics of real precipitation; (2) The QPEs of FY-4A and FY-2 H overestimate the precipitation in the researched region, and the overestimation of FY-4A was more obvious, while IMERG-Early QPE underestimates the precipitation. IMERG-Early QPE showed the best overall accuracy performance. (3) All three satellite QPEs were less accurate in July and August. (4) The accuracy of the QPEs of FY-4A and FY −2 H were better than that of IMERG-Early QPE in heavy rainfall. (5) The accuracy of three satellite QPEs increase with the increase of altitude. The results can provide reference for selecting satellite QPEs for operational applications in the southeastern Tibetan Plateau.
1. Introduction
Precipitation is an important part of the global water flux circulation, its spatial and temporal distribution affects the global atmospheric circulation, climate change, hydrological balance and other processes (Kidd and Huffman Citation2011; Kidd and Levizzani Citation2011). Its uneven spatial and temporal variation may lead to extreme weather events such as rainstorms and droughts, and local heavy rainfall will easily lead to floods (Maggioni, Meyers, and Robinson Citation2016). Therefore, accurate precipitation information is regarded as the basis and support for understanding the global water circulation and energy balance and is of great significance for monitoring and forecasting short-term rainstorm events, disaster prevention and mitigation, meteorology, and hydrology.
Ground rain gauge observation stations which have particularly high precision, are one of the conventional precipitation measurement methods (H et al. Citation2008; X et al. Citation2010; Zhang, Cong, and Ni Citation2013). But it is difficult to obtain spatially continuous precipitation information due to the uneven spatial distribution of meteorological stations (W et al. Citation2011). Ground-based weather radar has compensated for the problem of insufficient spatial distribution to a certain extent, but it is not the first choice for large-scale all-weather precipitation observation due to the limitations of high cost, difficult equipment maintenance, terrain shelter and limited observation range (Wen et al. Citation2013). Satellite observation is advantaged in terms of all-weather, high spatial and temporal resolution and wide range, and it is capable of effectively making up for the limitations of ground rainfall measurement methods, and has become the most widely used method to obtain large-scale precipitation information quickly and efficiently (J et al. Citation2018; K et al. Citation2014; Shukla et al. Citation2014; Tapiador et al. Citation2012). At present, satellite remote sensing precipitation retrieval is mainly based on visible/near-infrared bands of geostationary satellites, microwave sensors of low earth orbit satellites, precipitation radar and active and passive remote sensing sensors. Microwave sensors and precipitation radars carried by low earth orbit (LEO) satellites can obtain three-dimensional structure information of precipitation clouds, and can retrieve precipitation more accurately (Fu Citation2019). However, LEO satellites have long revisit period and low time resolution of product data. Multi-satellite combined precipitation products such as TRMM TMPA (Tropical Rainfall Measuring Mission Multi-satellite Precipitation Analysis) (J et al. Citation2007), CMORPH (Climate Prediction Center MORPHing technique) (JJ et al. Citation2004), GSMaP (Global Satellite Mapping of Precipitation) (Kubota et al. Citation2007), GPM IMERG (Integrated Multi-satellite Retrievals for Global Precipitation Measurement) and a series of precipitation products (Yong et al. Citation2015) can make up for the limitations of low earth orbit satellites to a certain extent, but there are still different degrees of time lag problems, which cannot meet the needs of weather monitoring. There are geostationary satellite-based IR precipitation products from the US (e.g. GOES-16/17), Europe (e.g. Meteosat-8/10), China (e.g. FY2/4), Japan (e.g. Himawari-8), India (e.g. INSAT-3D/3R/3S), and Korea (GEO-KOMPSAT-2A). Although geosynchronous orbit (GEO) infrared observation of precipitation has limitations in overall accuracy (Wang and Hong Citation2018), the geostationary satellite still has high practical application value in weather analysis and forecast, weather model assimilation (Prashant and Atul Citation2016), and short-term heavy precipitation monitoring due to its advantages of extremely high revisit period and fixed monitoring range (Ren et al. Citation2021).
Researchers have done a lot of assessment research on the precision of satellite Quantitative Precipitation Estimation (QPE). Previous research has recognized the multi-satellite joint QPE precipitation detection capability at the global, regional and basin scales (D et al. Citation2010; H et al. Citation2014; Sharifie, Steinacker, and Saghafian Citation2016; Tan and Duan Citation2017; Z. T. Wang, Li, and Zhang Citation2021; Zhang et al. Citation2021), and revealed some important and common problems, such as the relatively large QPE error in high altitude and high latitude areas, and the insufficient retrieval accuracy of small precipitation and extreme precipitation (E et al. Citation2017; Lu et al. Citation2018; Ma et al. Citation2016; Tong et al. Citation2007). The accuracy of QPE retrieval is uncertain in areas with complex terrain (Y et al. Citation2013). In terms of the accuracy assessment of Fengyun geostationary satellites QPE (Zhong Citation2021) and (Li, Yong, and Wu Citation2023) analysed the error characteristics of FY4A QPE in mainland China and found that the accuracy of FY4A QPE in humid areas in the southeast is higher than that in arid areas in the northwest. Xu et al. (Citation2019) analysed the precipitation accuracy of FY-2 G and FY-2E in the summer of 2018 in mainland China, compared it with GPM, and found that the IMERG accuracy of FY-2 G and GPM was significantly higher than that of FY-2E. The existing results prove that the domestic geostationary satellite QPE can correctly reflect the spatial and temporal distribution characteristics of precipitation, but there is a lack of in-depth exploration of the accuracy performance of satellite QPE in different scales in complex terrain areas, as well as quantitative analysis of the impact of terrain and other factors on the quality of satellite QPE. Few researchers focus on QPE products of domestic geostationary satellites, and accuracy assessment is not only an important means to assess the reliability and applicability of satellite remote sensing products, but also the main basis to improve the quality of satellite products. Therefore, it is necessary to assess the accuracy before the regional application of QPE for Fengyun geostationary satellites.
The southeastern Tibetan Plateau has an extremely important impact on rainstorm, flood, and drought disasters in China through the large topography, the elevated heat source and water vapour circulation, as well as the steep slope topography of the Tibetan Plateau, especially the abnormal development and eastward movement of disastrous weather systems (Heng and Jiang Citation2019; Li et al. Citation2010; Liu, Yang, and Liu Citation2023; Wang et al. Citation2018; Y et al. Citation2011), which often leads to serious rainstorm and flood disasters to the vast areas downstream. Due to the harsh environmental conditions in the region, the meteorological stations are sparse, the layout is not reasonable, and the observation capacity is very weak (Ma et al. Citation2015; Tang et al. Citation2018). Therefore, it is urgent to improve the application level of satellite precipitation products in this region, especially the geostationary satellite QPE with high observation frequency.
China has developed and launched two generations of geostationary meteorological satellites: FY-2 G and FY-2 H (the Fengyun-2 series) and FY-4A and FY-4B (the Fengyun-4 series) are currently in orbit. Fengyun geostationary satellite is an important meteorological satellite in China, and it is necessary to develop the practical application of its QPE, but there are relatively few studies on the applicability of China’s geostationary satellite QPE in the southeastern Tibetan Plateau. Based On the hourly precipitation data from ground rain gauge observation stations (OBS) provided by the China Meteorological Administration (CMA), the accuracy and error characteristics of FY-4A and FY-2 H QPEs in the warm season precipitation under complex terrain conditions in the southeastern Tibetan Plateau were analysed. The accuracy of GPM-IMERG QPE was compared with that of multi-satellite joint data. The results can provide a reference for the selection of satellite QPE operational applications in the southeast of the Tibetan Plateau, and provide scientific suggestions for the retrieval algorithm and error correction of FY-2 H and FY-4A QPEs.
2. Study area and data source
2.1. Overview of the study area
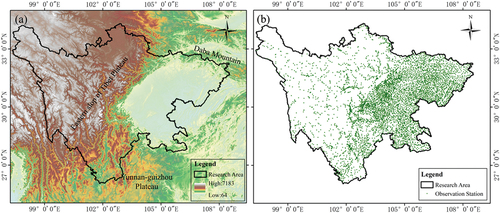
The study area is located in the southeastern slope and downstream of the Tibetan Plateau, between the East Asian monsoon and the alpine region of the Tibetan Plateau. The terrain is characterized by high in the west and low in the east, with plateau mountains in the west, with an elevation of more than 3,000 m, and basins and hills in the east, with an elevation of 500 ~ 2,000 m. The unique topography makes the water vapour carried by the monsoon from the Pacific Ocean and the Indian Ocean blocked by the surrounding mountains, thereby forming abundant rainfall around the basin (Hu and Li Citation2015; Sun, Zhu, and Wang Citation2023); it also causes obvious regional and temporal differences in precipitation in the study area, with more precipitation in summer, less in winter, more in the east and south, and less in the northwest (Bao, Zhang, and Sun Citation2011; Zhang et al. Citation2016). The terrain distribution of the study area and its surrounding areas is shown in .
Figure 1. Topography and spatial distribution map of stations in the study area. (a stands for the spatial distribution of topography, and b stands for the location of rain gauge stations).
2.2. Data source
2.2.1. Precipitation data observed by surface rain gauge
In this paper, the hourly OBS precipitation data in the study area provided by the Tianqing system of CMA is selected as the reference data, and the time span of the precipitation series is the warm season from April to September every year from 2019 to 2021. The distribution of OBS in the study area is shown in . The stations are most densely distributed in the eastern basin, and the plateau is relatively sparse. In this study, the quality control of site data was carried out, and the wrong or doubtful data were eliminated. The number of sites after quality control was 5,981.
2.2.2. Surface Quantitative Precipitation Estimation by use of FY-4A AGRI (FY-4A QPE)
FY-4A is equipped with Advanced Geostationary Radiation Imager (AGRI) (Song et al. Citation2023), which can produce time resolution of 1 h, 3 h, 6 h and 24 h full disk (DISK) QPE and real-time products of precipitation estimation in China region (REGC) with a temporal resolution of 5 min. FY-4A QPE obtains the transfer characteristic parameters from Infrared brightness temperature to precipitation using the probability density matching method of real-time rolling update, so as to estimate precipitation (You Citation2018). The spatial resolution of the FY-4A QPE product is 4 km. FY4A QPE started in Fengyun Satellite Remote Sensing Data Service Network (http://satellite.nsmc.org.cn/portasite/default.aspx.) on 12 March 2018. 1 h DISK QPE product was selected for assessment and analysis in this study.
2.2.3. QPE by use of FY-2 H VISSR-2 (FY-2 H QPE)
The FY-2 H is technically mature and stable and is equipped with a stretched visible and infrared spin scan radiometer (VISSR-2) (B. Y. Ma, Tang, and Hu Citation2022). The cloud top temperature of the precipitation cloud cluster detected by the infrared sounder is used to infer the precipitation information in the cloud. The spatial resolution of precipitation products is 5 km, and the temporal resolution is 1 h, 3 h, 6 h and 24 h. FY-2 H QPE was updated on the Fengyun Satellite Remote Sensing Data Service Network (http://satellite.nsmc.org.cn/portasite/default.aspx.) on 5 June 2018. In this present research, QPE with a time resolution of 1 h is selected for assessment and analysis.
2.2.4. GPM IMERG-Early
GPM is an international satellite precipitation mission developed by the National Aeronautics and Space Administration (NASA) and the Japan Aerospace Exploration Agency (JAXA), whose core sensor was successfully launched on 27 February 2014. IMERG is a new generation of multi-satellite joint retrieval precipitation data released by the GPM programme, which integrates a variety of microwave, infrared, and radar data, and fully realizes the complementary advantages of multi-source sensors. According to different data sources and processing processes, IMERG series precipitation products include quasi-real-time products IMERG-Early (delayed by 4 hours), IMERG-Late (delayed by 12 hours), and delayed research-level products IMERG-Final (delayed by 3.5 months)[49]. In view of the short-time delay of FY-4A and FY-2 H QPE, the quasi-real-time satellite precipitation product (IMERG-Early) of GPM is selected for comparative study in this paper. The IMERG-Early product has a spatial resolution of 0.1° and a temporal resolution of 30 min. Data is obtained from the NASA website (http://pmm.nasa.gov/data-access/downloads).
2.3. Research methods
2.3.1. Space-time matching
The spatial and temporal resolutions of the OBS precipitation data and three satellite QPE are different, so it is necessary to unify the spatial and temporal scales of various precipitation data. On the time scale, the 30-minute interval IMERG-Early and the minute-level FY-4A QPE data are averaged and accumulated separately to obtain the 1-hour average precipitation. On the spatial scale, because of the low spatial resolution of OBS, the nearest three satellite QPEs grid points within 0.1° are selected as matching samples with OBS as the centre. Finally, the space-time matching between QPE and OBS is realized.
2.3.2. Consistency test indexes
In order to quantitatively analyse the consistency of three QPEs and OBS precipitation data, four widely used accuracy assessment indexes are used in this paper: Correlation Coefficient (CC), Root Mean Squared Error (RMSE), Relative Bias (RBIAS), Mean Absolute Error (MAE) (L et al. Citation2023). CC represents the consistency between QPEs and OBS precipitation data; RMSE can be used not only to assess the overall error level and accuracy of QPE but also to describe the degree of dispersion; RBIAS can reflect the degree of systematic bias of QPEs. The formulas for the error indicators are shown in .
Table 1. Consistency assessment index formula.
2.3.3. Precipitation event detection indexes
In practical applications, it is also necessary to consider the detection capacity of satellite QPE for precipitation events. In this study, three indexes were used: Probability of Detection (POD), False-alarm Rate (FAR), and Frequency Bias Index (FBI). POD represents the proportion of correctly detected precipitation events to the total number of events detected by satellite QPE; FAR represents the proportion of incorrectly detected precipitation events to the total number of precipitation events detected by satellite QPE; FBI comprehensively reflects the capacity of satellite QPE to detect actual precipitation events. If the FBI index is less than 1, it indicates that the precipitation events are underestimated, and if the FBI index is greater than 1, it indicates that the precipitation events are overestimated. The calculation method of the precipitation event detection index is shown in and .
Table 2. Distribution table of precipitation identification results of satellite and test source.
Table 3. Precipitation event detection index formula.
3. Assessment results
3.1. Spatial distribution characteristics of satellite QPE
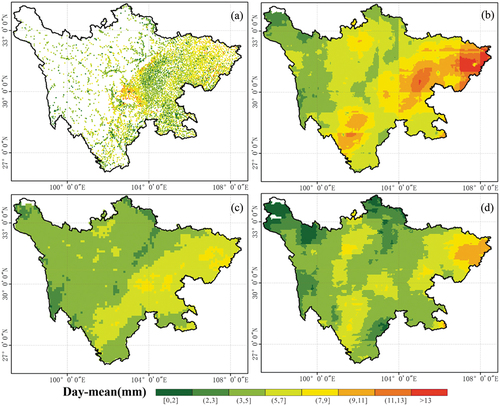
To verify whether the three satellite QPEs can correctly reflect the spatial distribution characteristics of warm-season precipitation in the study area, the average daily precipitation of OBS, FY-2 H QPE, FY-4A QPE and IMERG-Early from April to September during 2019–2021 is calculated respectively, and the spatial distribution is shown in . It is shown from the OBS precipitation distribution shown in that the warm season precipitation in the study area has a northeast-southwest rainfall belt, and there are two precipitation centres in the central part (102 ~ 104°E, 28 ~ 30.5°N) and in the northeast (106 ~ 108°E, 31.5 ~ 33°N), and the average daily precipitation can reach 15 mm∙day−1. It can be seen from the spatial distribution of the average daily precipitation of the three satellites in that the distribution characteristics of the northeast-southwest precipitation are consistent with the OBS precipitation. All three satellite QPEs can reflect the locations of the two heavy precipitation regions in the central and northeastern parts of the study area. Compared with the precipitation of OBS, IMERG-Early QPE is the most accurate, and the QPEs of FY-2 H and FY −4A tend to overestimates precipitation, FY-4A QPE showing the most significant difference. All three satellite QPEs are located in the northern part of the study area (101.5 ~ 102.5 E, 32.5 ~ 32.9°N). A precipitation centre is detected, and OBS is sparsely distributed at this location, which fails to reflect the obvious distribution of heavy precipitation. It is shown by the spatial distribution of daily mean precipitation that the three satellite products can correctly reflect the spatial distribution characteristics of precipitation in the southeast of the Tibetan Plateau to a certain extent. However, there are different degrees of deviations between the QPEs of the three satellites and OBS, so it is necessary to quantitatively evaluate and analyse the satellite QPEs error.
Figure 2. Mean daily precipitation in the study area during the warm season from 2019 to 2021. (a is OBS, b is FY-4A, c is IMERG-Early, and d is FY-2 H)
3.2. Satellite QPE hourly scale accuracy quantitative assessment results
To quantitatively evaluation the accuracy performance of the FY-4A、FY-2 H and IMERG-Early QPE over southeastern Tibetan in the warm season, various evaluation indexes of the three satellite QPEs based on OBS data were calculated. summarizes the statistical results of each assessment index of three satellite QPEs relative to OBS data in the study area at the hourly scale from April to September during 2019–2021. In terms of consistency test indexes, the CC of IMERG-Early is the highest, which is 0.29, indicating that the consistency between IMERG-Early and OBS reference is the highest among the three satellite QPEs. The RBIAS of FY-4A and FY-2 H are greater than 0, indicating that they tend to overestimate the precipitation, while the RBIAS of IMERG-Early shows an underestimation of precipitation. Among them, the RBIAS of FY-2 H (5.21%) deviates the least from 0, while the RBIAS of FY-4A (54.26%) deviates the most from 0. The IMERG-Early satellite data shows the lowest RMSE of 4.69 mm. In terms of precipitation event detection indexes: IMERG-Early QPE has the best precipitation detection capability, with the highest POD value (0.29) and the lowest FAR value (0.72); FY-2 H ranks second in precipitation detection capability (POD is 0.18, FAR is 0.76); and FY-4A has the worst detection capability (POD is 0.12, FAR is 0.79). The FBI value of IMERG-Early is greater than 1, indicating that the data overestimated the number of precipitation events; the FBI values of FY-4A and FY-2 H are less than 1, indicating that the number of precipitation events were underestimated. Most indicators show that EMERG-Early performs better than the FY-4A and FY-2 H QPEs in the southeastern Tibet Plateau.
Table 4. Hourly accuracy assessment of three satellite precipitation products.
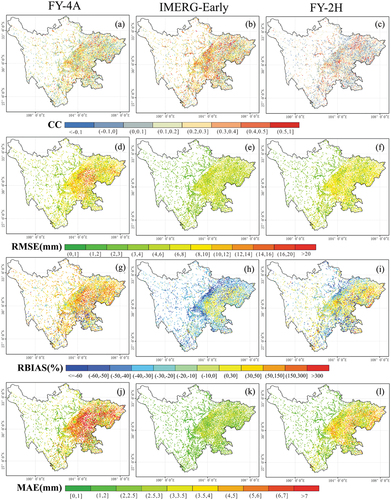
shows the spatial distribution of CC, RMSE, BIAS, MAE between QPEs of the three satellites and OBS at the hourly scale in the study area. The CCs of the three satellite QPEs in do not show obvious features in the spatial distribution. show that the spatial distribution characteristics of RMSE and MAE of the three satellite QPEs are relatively consistent, which are larger in the eastern part of the study area and smaller in the western plateau; The RMSE and MAE of FY-4A QPE are significantly larger than those of the other two satellite QPEs in the Sichuan Basin in the eastern part of the study area, while the RMSE and MAE of IMERG-Early are relatively small. It can be shown from the spatial distribution of RBIAS in that the RBIAS of FY-4A is positive on the whole, and there are obvious negative values only in some areas in the south of the study area, indicating that FY-4A overestimates the precipitation in most areas of the study area; IMERG-Early slightly underestimates the precipitation in the eastern basin, while most of the other regions show a significant underestimation of the precipitation. The underestimation phenomenon is particularly obvious in the central plateau slope area near 104°E; FY-2 H is overestimated in the eastern plateau, slightly underestimated in the western plateau, and significantly underestimated in the northern plateau slope and the southern Yunnan-Guizhou Plateau adjacent regions. The error values of the three satellites showed distinct spatial distribution characteristics in different terrains.
Figure 3. Spatial distribution of consistency index of FY-4A, FY-2H and IMERG-Early satellite precipitation products.
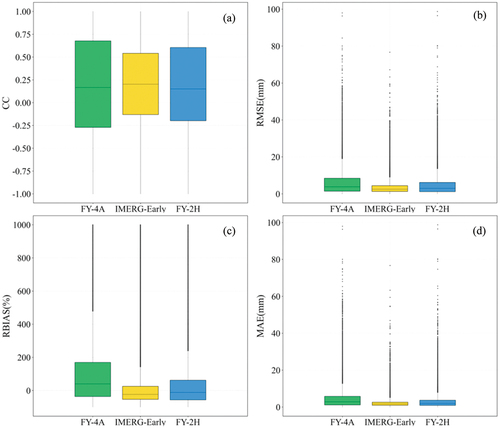
is a box diagram of the consistency index of the three satellite products on the hour scale. The upper and lower edges of the box diagram are the 25th and 75th percentiles respectively, the middle horizontal line is the median, and the upper and lower ends represent outliers. In general, the box diagram of each index of IMERG-Early is the shortest, followed by FY-2 H, and FY-4A is the longest. The median of IMERG-Early is also the closest to the optimal value of each index. The correlation coefficients () of the three satellite QPEs greater than 0 account for 71%, 83% and 78% of the sample size, respectively. In the RMSE, RBIAS, and MAE box diagrams of the three satellite QPEs, the median and upper and lower quantiles of IMERG-Early are lower than those of FY-2 H and FY-4A, indicating that the error between IMERG-Early and OBS is the smallest. The more outliers in the three satellite box diagrams reflect the instability of the satellite QPE accuracy. Overall, the consistency of IMERG-Early with the OBS data is better than that of FY-4A and FY-2 H in the study area. Most of the satellite data are positively correlated with the station precipitation, indicating that the satellite QPE can reflect the trend of precipitation change to a certain extent. But the more outliers in the three satellite box diagrams reflect the instability of the satellite QPE accuracy. The longer tail features in the box plots of the three satellites indicate a higher number of outliers, reflecting the instability of the satellite QPEs accuracy.
Figure 4. Satellite QPE consistency assessment index box diagram.
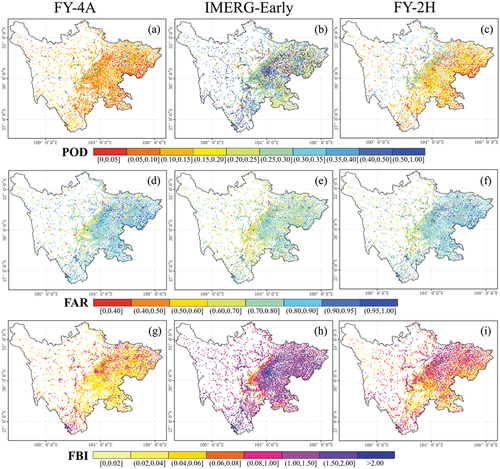
To test the detection capacity of the three satellite QPE for precipitation events, the spatial distribution maps of POD, FAR and FBI are drawn, as shown in . The hit rate of IMERG-Early is significantly higher than that of FY-2 H and FY-4A in the spatial distribution of precipitation, and the POD of IMERG-Early is the highest in the basin in the central part of the study area, with most POD values are greater than 0.50. In the transition zone between the plateau and the basin, the POD is the lowest (0.25). The spatial distribution of POD of FY-2 H in the central basin of the study area is 0.1, and the POD on the northern plateau can reach 0.35. The overall regional hit rate of FY-4A is low, only about 0.10, but the POD in the vicinity of the site correction reaches more than 0.50. In terms of FAR, the FAR of three satellite products is low nearby the precipitation centre (102 ~ 104°E, 28 ~ 30.5°N), and the FAR is high near the northern plateau slope and Daba Mountain; the overall FAR of IMERG-Early is low, and the spatial FAR values of FY-2 H and FY-4A are equivalent. FY-4A is significantly less than 1 in the FBI in the southeastern part of the basin and is closest to 1 around the site correction location. The FBI of FY-2 H is in the south-central part of the study area (103 ~ 104°E, 28 ~ 29.5°N). The regional value is less than 1, which indicates that FY-2 H underestimates the precipitation events in this region, and FBI is closest to 1 in the northeast heavy precipitation region, which indicates that FY-2 H is the most accurate to detect the precipitation events in this region. In IMERG-Early space, the overall FBI is greater than 1, and only in the transition zone between the central plateau and the basin, the FBI is less than 1.
Figure 5. Spatial distribution map of satellite QPE precipitation event detection index.
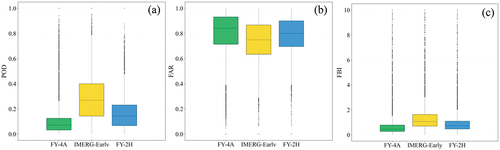
is a box diagram of three satellite QPE precipitation event detection indexes. As far as POD is concerned, the median and upper and lower quantiles of IMERG-Early are significant in FY-4A and FY-2 H, indicating that IMERG-Early has the highest hit rate for precipitation events; although the POD of FY-4A is significantly lower than that of the other two satellite QPEs, the box type of FY-4A is the shortest, indicating that the POD stability of Fy-4A is relatively the best. In terms of FAR, IMERG-Early is the lowest, followed by FY-2 H, and FY-4A is the highest. As far as the FBI is concerned, the median of IMERG-Early is greater than 1, indicating that IMERG-Early overestimates precipitation events, and the quantiles of FY-4A and FY-2 H are less than 1, indicating that these two satellite QPEs underestimate precipitation events. The median and upper and lower quantiles of FY-4A are lower than those of FY-2 H, indicating that the underestimation of precipitation events in FY-4A is more serious. Overall, on the hourly scale, IMERG-Early exhibits higher precipitation detection ability in the study area, followed by FY-2 H, while FY-4A has relatively greater room for improvement. Similarly, the longer tail features in the box plots of the three satellites also indicate the instability of the satellites’ ability to detect precipitation events.
Figure 6. Satellite QPE precipitation event detection index box diagram.
3.3. Change trend of satellite QPE assessment indexes in each month
Previous studies have shown that the distribution of warm-season precipitation in the study area is uneven on a monthly scale, with low precipitation in April–May, the highest precipitation from June to August, and relatively low precipitation in September (Sun, Zhu, and Wang Citation2023). To explore whether the satellite QPE can correctly reflect the trend of precipitation changes over time in the study area, this study quantitatively analysed the accuracy performance of the satellite hourly QPE during the warm season in each month.
As shown in , the change trend of the hourly average precipitation of the three satellite QPEs from April to September is consistent with that of OBS. Although IMERG-Early QPE tend to underestimates precipitation, its value is closest to OBS. FY-2 H underestimates precipitation in January, July, and August, while overestimating in other months. FY-4A tend to overestimate precipitation each month. Compared to IMERG-Early and FY −2 H QPEs, FY-4A QPE’s deviation is more significant in every month. In , the change trend of CC of QPE of the three satellites in each month is the same, gradually increasing from April to June, decreasing in July, and increasing again in August and September. The correlation coefficient of IMERG-Early is the highest in each month, and the highest correlation coefficient is 0.47 in September. The RMSE, RBIAS, and MAE line charts shown in show that the precipitation estimation error of FY-4A is significantly higher than that of FY-2 H and IMERG-Early. The trends of RMSE and MAE follow a similar pattern, exhibiting the highest error values in June to August. The RBIAS trends are different, and it is speculated that the reason may be the offset between positive and negative deviations. The POD trend in shows that the three satellites have a stronger capacity to capture strong precipitation than weak precipitation. From the FBI line chart in , it can be seen that IMERG-Early tends to overestimate the heavy precipitation events in July and August, and FY-4A underestimates the heavy precipitation events in July and August less than other months.
Figure 7. Change trend chart for each month.
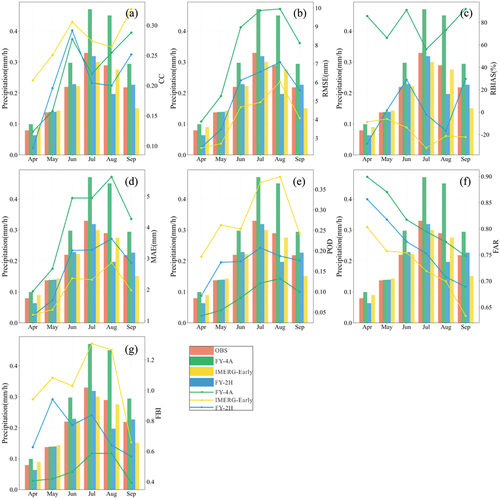
The three satellite QPEs can correctly reflect the trend of monthly average precipitation changes, and IMERG-Early has the overall best accuracy performance in each month. FY-4A and FY-2 H have a similar CC, but FY-4A has a larger error value than FY-2 H. It is worth mentioning that in the month with the largest precipitation, July, the RBIAS of FY-4A and FY-2 H decreased compared to the other months, while the RBIAS of IMERG-Early increased compared to the other months.
The three satellite QPEs have the capability to accurately reflect the monthly average precipitation trends. Most of the assessment indices for the three satellite QPEs exhibit similar trends across months, demonstrating relatively lower accuracy during July and August, which are the months with the highest precipitation. However, there are significant differences in the accuracy performance of the three satellite QPEs. Specifically, IMERG-Early QPE demonstrates the highest accuracy across months, while FY-4A exhibits the lowest accuracy.
4. Results analysis
4.1. The relationship between satellite QPE retrieval performance and precipitation intensity
According to the accuracy evaluation results for each month mentioned above, it can be seen that in the month with the largest precipitation, July, the RBIAS of the geostationary satellites FY-4A and FY-2 H decreased. Therefore, to explore the relationship between satellite precipitation detection errors and precipitation amounts, this article classifies the study area into precipitation levels based on the ‘National Intelligent Grid Meteorological Forecasting Business Specification’ issued by the China Meteorological Administration (The national intelligent grid meteorological forecasting business standard provisional). The accuracy and capture ability of satellite QPE for different precipitation amounts are statistically analysed, and the classification standards are shown in . According to the National Intelligent Grid Meteorological Forecast Operational Specification issued by the China Meteorological Administration, the rainfall grade of the study area is classified, and the classification criteria are shown in . The Probability Density Function (PDF) of precipitation intensity represents the incidence of rainfall (Kirstetter et al. Citation2013; Tang et al. Citation2016), which is an important metric for assessing the ability of satellite QPE to capture different precipitation events.
Table 5. Rainfall grade classification.
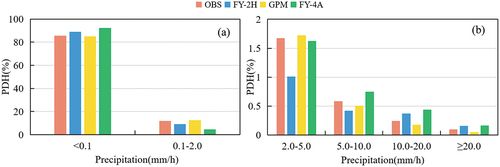
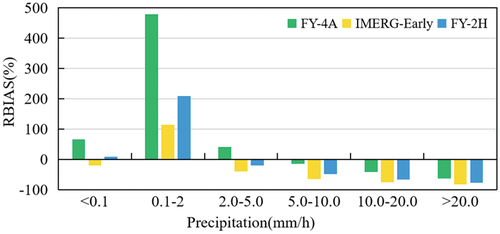
In this study, PDF and RBIAS are used to analyse the performance of three satellite QPEs in terms of different levels of precipitation intensity. shows the statistical histograms of no-rain (<0.1 mm∙h−1) and each level of precipitation. It is shown that more than 85% of the precipitation events occur in this interval, and IMERG-Early shows a slight underestimation of rainless events, while FY-2 H and FY-4A show an overestimation of rainless events, and the overestimation of FY-4A is more obvious. IMERG-Early slightly overestimates rainfall events in the range of 0.1–2.0 mm∙h−1 and 2.0–5.0 mm∙h−1; rainfall is greater than 5.0 mm∙h−1, IMERG-Early shows an obvious underestimation phenomenon, and with the increase of rainfall, the underestimation phenomenon of IMERG-Early is more obvious. FY-2 H underestimates precipitation events when the rainfall magnitude falls within the range of 0.1–10.0 mm∙h−1, and overestimates when the rainfall magnitude is greater than 10.0 mm∙h−1. In the range of 0.1–5.0 mm∙h−1, FY-4A underestimates the precipitation events, and when the rainfall intensity is greater than 10.0 mm∙h−1, FY-4A overestimates the precipitation events. In general, IMERG-Early overestimates the frequency of light rain and underestimates heavy rain, while FY-2 H and FY-4A underestimate light rain and overestimate heavy rain. The capacity of IMERG-Early to capture different levels of precipitation remains stable, FY-2 H has a better capacity to capture heavy rain events of more than 10.0 mm∙h−1, and FY-4A has the most accurate capacity to capture moderate rain events of 2.0–5.0 mm∙h−1.
Figure 8. Rainfall capture index line chart for no rain and various rain levels.
The deviation between IMERG-Early, FY-2 H, FY-4A and OBS in each grade of precipitation intensity is further analysed through . The three satellite QPEs all show the overestimation of low rainfall and the underestimation of high rainfall. In the range of 0.1–2.0 mm∙h−1, IMERG-Early QPE is the best and FY-4A RBIAS is the largest. In the interval of 2.0–5.0 mm∙h−1, FY-2 H QPE exhibits the smallest deviation. The RBIAS of FY-4A QPE is significantly closest to 0, followed by FY-2 H. The RBIAS of IMERG-Early QPE deviates the most from from 0 in the rainstorm range exceeding 5.0 mm∙h−1. It is shown by the results that the domestic geostationary satellite FY-4A has the least underestimation of rainstorms, and its capacity to estimate rainstorm rainfall is better than the other two satellites.
Figure 9. Histogram of relative deviation as a function of rainfall intensity.
4.2. The relationship between satellite QPE retrieval error and topography
The spatial distribution of satellite QPE evaluation results shows that the accuracy varies significantly in different terrain regions. And previous studies have shown that terrain is one of the important factors affecting the accuracy of satellite precipitation retrieval (J. Li, Yong, and Wu Citation2023). Therefore, this paper makes statistics on the relationship between the QPE consistency index of the three satellites and the elevation. is the scatter diagram of consistency assessment indexes such as RMSE, RBIAS, and MAE and the altitude of OBS location. The variation characteristics of the RMSE and MAE of the three satellite QPEs with altitude are relatively consistent, with a significant downward trend in the range of 0–1500 metres, a gradual decrease in the range of 1500–3000 metres, and almost no change above 3000 metres. This indicates that in low-altitude areas, altitude is an important factor affecting satellite precipitation retrieval, while in high-altitude regions, the impact of altitude on satellite precipitation retrieval accuracy is relatively small.
Figure 10. Scatter diagram of three satellite precipitation error values versus DEM.
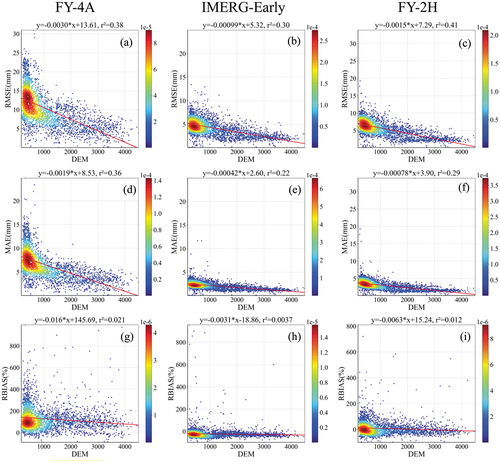
By comparing the trends of the three satellite QPEs, it can be seen that the trend of error reduction with increasing altitude for IMERG-Early is more gradual, indicating that its accuracy is less dependent on altitude. On the other hand, FY-4A has the most significant trend of accuracy changes with altitude, indicating that altitude has the greatest impact on its accuracy. Below an altitude of 1000 metres, there are significant differences in the error values of the three satellite QPEs, indicating that the accuracy of FY-4A and FY-2 H needs to be improved in the low-altitude areas within the study area. Above an altitude of 3000 metres, the RMSE and MAE values of IMERG-Early and FY-2 H tend to be consistent, indicating that the precipitation detection ability of these two satellite QPEs is similar in the highlands, while the accuracy of FY-4A’s precipitation retrieval still has significant room for improvement above 3000 metres. When compared to the RBIAS, it can be seen that FY-4A and FY-2 H have a more pronounced overestimation of precipitation in the low-altitude areas.
Using rainfall grade classification in , the correlation coefficient (RDCC) between the QPE RBIAS values of each satellite and DEM across different rainfall classifications were calculated. The results presented in , indicate that all three satellite QPEs exhibit the highest RDCC when the precipitation ranges from 2.0 to 5.0 mm∙h− 1. Furthermore, FY-4A and FY-2 H also exhibit relatively high RDCC values when the precipitation ranges from 5.0 to 10.0 mm∙h− 1. This suggests that the estimation accuracy of IMERG-Early QPE when the precipitation ranges from 2.0 to 5.0 mm∙h− 1 is most correlated with DEM, while FY-4A and FY-2 H show a high degree of correlation between their estimation accuracy for rainfall in the 5.0–10.0 mm∙h− 1 range and altitude.
Table 6. The RDCC for different rainfall.
Comparing the statistical results in , it is evident that FY-4A QPE has the highest RDCC for rainfall in the 0.1–10.0 mm∙h− 1 range, followed by FY-2 H Comparing the statistical results in , it is evident that FY-4A has the highest RDCC when the precipitation ranges from 0.1 to 10.0 mm∙h− 1, followed by FY-2 H. However, for the precipitation ranges more than 10 mm∙h− 1, the RDCC values of the three satellite QPEs are relatively similar. This indicates that under a precipitation range of less than 10 mm∙h− 1, FY-4A QPE’s accuracy has the strongest correlation with the terrain compared to the other two satellite QPEs.
5. Discussion
5.1. Comparison of advantages and disadvantages among QPEs of various satellites
In this paper, the accuracy performance of two generations of Fengyun geostationary satellites FY-4A and FY-2 H QPE in the warm season precipitation in the southeast of Tibetan Plateau is summarized and analysed, from two aspects of the temporal and spatial distribution characteristics of satellite QPE error and the capacity to monitor different intensity precipitation events, and compared with IMERG-Early. It is found that the comprehensive accuracy of IMERG-Early is generally better than that of FY-2 H and FY-4A, one of the main reasons is that they use different precipitation retrieval algorithms and data sources. In the production of GPM series satellite precipitation products, the dual-frequency precipitation radar DPR data are used to correct the passive microwave data of GPM satellite constellation. This method is capable of measuring the three-dimensional structure and rate of precipitation more accurately. Then using Kalman filtering method, IMERG-Early integrates infrared precipitation estimation, passive microwave precipitation estimation and microwave precipitation estimation, which greatly improves and expands the sampling accuracy of precipitation. Different from IMERG-Early, the geostationary FY-2 H precipitation product mainly applies the observation data of the infrared sensor on the geostationary satellite, and derives the precipitation estimation based on the relationship between precipitation and cloud top temperature. This indirect measurement method easily leads to the relatively low accuracy of precipitation estimation based on geostationary satellites. The overall accuracy of FY-2 H is better than that of FY-4A. The reason may be that the FY-4A precipitation estimation algorithm adopts the instantaneous precipitation estimated by microwave radiometer as the true value to establish the statistical relationship, but does not establish the direct relationship with OBS precipitation, which leads to its lower accuracy than FY-2 H.
FY-2 H and FY-4A are not as good as IMERG-Early in terms of the overall accuracy over the study area, but geostationary satellites have a uniquely advantaged in terms of temporal resolution and can obtain precipitation products with a short delay of minutes. Benefiting from the short delay time, the QPE of FY-series geostationary satellites has more potential than IMERG-Early in hydrological real-time monitoring and short-term and imminent forecasting applications. According to statistics, the Sichuan Basin in the study area is one of the centres of warm-season rainstorms in China, and the frequency of rainstorms, especially heavy rainstorms, is relatively high in the Sichuan Basin. The underestimation degree of precipitation by FY-4A is significantly lower than that by IMERG-Early satellite precipitation products under rainstorm intensity (≥5 mm∙h−1), with an important practical application value in rainstorm monitoring in the study area.
The advantages and disadvantages of the two geostationary satellites QPE and IMERG in the southeast of the Tibetan Plateau can be summarized in . IMERG is advantaged in overall accuracy, with longer time series and better data continuity, so it is suitable for large-scale and long-term precipitation research. FY-2 H is advantaged in short time delay, and its accuracy is closer to IMERG-Early, so it is more advantaged for regional short-term and imminent prediction. FY-4A has the highest spatial resolution and the least underestimation of rainstorms, therefore it has unique advantages in rainstorm monitoring.
Table 7. Comparison of advantages and disadvantages of three kinds of satellite precipitation products.
5.2. Error source analysis of satellite precipitation products
It is found from the validation results that compared with the ground OBS, the precipitation retrieved by the three satellites inevitably has a certain degree of error. IMERG-Early performs best on the hourly scale in the study area, but its CC is still not satisfied mainly because the way of satellite remote sensing to monitor precipitation is indirect estimation, limited by spatial and temporal sampling, sensors, and retrieval algorithms, resulting in large errors in real-time satellite precipitation estimation.
Compared with the existing accuracy assessment results of GPM (Zhang et al. Citation2021) and Fengyun geostationary satellite QPE (Y et al. Citation2013; Zhong Citation2021) on the national scale and some other regions, the accuracy evaluation results obtained in this paper for the southeastern Tibetan Plateau are relatively low, due to large altitude span of the study area, complex and changeable terrain, and complex precipitation mechanism. It is shown from previous studies that the accuracy of various satellite QPEs in humid areas along the southeast coast is significantly better than that in the northwest of China.
The possible influencing factors of satellite QPEs based on OBS assessment in this study area are summarized as follows: (1) Temporal and spatial scale mismatch. Spatially, ground stations only represent the precipitation at their location, while satellites have a resolution of several kilometres to more than 10 km. The precipitation in the study area is complex and changeable, and the spatial representativeness of the observation data under the special terrain is very limited, especially in the plateau area where there are few stations and in the plateau slope area where the altitude span is large. Although the spatial threshold is defined in this paper, it is still difficult to solve the spatial mismatch problem between the site and the satellite data grid. In terms of time, the station directly observes the hourly cumulative precipitation, while the satellite estimates the hourly cumulative precipitation from multiple instantaneous observation precipitation rates within an hour. When instantaneous heavy precipitation occurs, it will cause uncertainty in the satellite estimation of hourly precipitation from instantaneous precipitation. (2) Position error caused by the transformation of different spatial coordinate systems. FY-4A QPE is full disk nominal projection, and IMERG-early QPE is equal longitude and latitude projection. Different projection methods will inevitably cause a certain amount of position offset. (3) Limitations of various assessment indexes. There are interdependencies among various assessment indexes, for example, RBIAS is an average result, and positive and negative errors offset each other, so the performance of satellite precipitation assessment through the above conventional indexes is limited. In this study, a variety of assessment indexes that can fully reflect the characteristics of errors are selected as far as possible.
In this paper, the temporal and spatial distribution characteristics of three satellite QPEs errors are analysed, and the sources of satellite QPE errors are summarized. In the future, the accuracy performance of different satellite QPEs in different weather analysis processes will be analysed in combination with weather processes. This paper only analyzes the accuracy of three satellite QPEs in the study area under the condition of warm season precipitation, so it is necessary to further analyse the error characteristics of different satellite QPEs in each season in the future. In addition, how to achieve more precise spatial matching between point and areal precipitation data under the condition of limited spatial representativeness of ground rainfall gauge observations in complex terrain regions is also an important scientific issue that needs to be addressed in the subsequent research of this paper.
6. Conclusion
In this study, three satellite precipitation datasets, FY-2 H, FY-4A and IMERG-Early, were assessed and analysed by using the hourly data sets of 5,981 rain gauge stations in the southeastern Tibetan Plateau from April to September every year from 2019 to 2021, and the error characteristics of the three satellite QPEs were compared and analysed. The main conclusions are as follows:
The three satellite QPEs can reflect the spatial distribution of precipitation to a certain extent, but there are varying degrees of deviation in estimating rainfall values.
In terms of spatial distribution, all three satellite QPEs exhibit the worst accuracy in the basin and the highest accuracy on the plateau. A comparison of the accuracy of the three satellite QPEs indicates that IMERG-Early QPE has the best accuracy, followed by FY-2 H, and FY-4A has the lowest accuracy. Both FY-2 H and FY-4A QPE tend to overestimate low precipitation and underestimate high precipitation.
All three satellite QPEs are able to accurately reflect the monthly changes in precipitation in the warm season over the study area. The accuracy is relatively the lowest in July and August, when the precipitation is the heaviest.
The QPEs of FY-2 H and FY-4A possess an advantage in estimating heavy rainfall (≥5 mm/h), especially the FY-4A QPE.
The errors of satellite QPEs decrease as the altitude increases, all three satellite QPEs have the highest RDCC when the precipitation ranges from 2.0 to 5.0 mm∙h− 1. When precipitation is less than 10 mm∙h− 1, FY-4A QPE’s has the highest RDCC compared to the other two satellite QPEs.
To sum up, The three satellite QPEs can accurately reflect the spatial and temporal distribution of precipitation in the southeastern part of the Qinghai-Tibet Plateau to a certain extent. The accuracy of satellite-derived precipitation is influenced by both topography and precipitation amount. In terms of large-scale overall precipitation estimation, IMERG-Early precipitation data are more consistent with the observation results and have better precipitation estimation capacity in the study area. Compared with FY-4A, FY-2 H performs better in the error index. FY-4A performs the best in the rainfall estimation of rainstorm(≥ 5 mm∙h−1) observation. FY-2 H and FY-4A are of great significance in short-term and imminent forecasting because of their high temporal resolution, and FY-4A provides a practical application value in rainstorm monitoring. The results of this study can provide a scientific basis for the selection of precipitation data sources for hydrological monitoring and weather forecasting under the complex terrain conditions of the Tibetan Plateau, with important practical significance for the improvement of the domestic geostationary satellite precipitation retrieval algorithm.
Disclosure statement
No potential conflict of interest was reported by the author(s).
Data availability statement
The data that support the findings of this study are available from the first author upon request.
Additional information
Funding
References
- Bao, X., F. Zhang, and J. Sun. 2011. “Diurnal Variations of Warm-Senson Precipitation East of the Tibetan Plateau Over China.” Monthly Weather Review 139 (9): 2790–2810. https://doi.org/10.1175/mwr-d-11-00006.1.
- D, T. Y., C. D. Peters, A. R. F, T. Kubota, and T. Ushio. 2010. “Evaluation of GSMap Precipitation Estimates Over the Contiguous United States.” Journal of Hydrometeorology 11 (2): 566–574. https://doi.org/10.1175/2009JHM1190.1.
- E, B. H., V. Diji A I J M, V. Levizzani, J. Schellekens, D. G. Miralles, B. Martens, A. de Roo, et al. 2017. “MSWEP: 3-Hourly 0.25° Global Gridded Precipitation (1979–2015) by Merging Gauge, Satellite, and Reanalysis Data.” Hydrology and Earth System Sciences 21 (1): 589–615. https://doi.org/10.5194/hess-21-589-2017.
- Fu, Y. F. 2019. “Satellite-Borne Active and Passive Instruments for Remote Sensing of Heavy Rain in China: A Review.” Torrential Rain and Disasters 38 (5): 554–563.
- H, J. S., R. L. L, B. Yong, F. Yuan, L.gong, and X. yang. 2014. “Hydrological Evaluation of the TRMM Multi-Satellite Precipitation Estimates Over the Mishi Basin.” Advances in Water Science 25 (5): 641–649.
- H, N. G., L. Z. Y, L. Z. D, D.-W. Yang, and L. Wang. 2008. “Continuous Simulation of Water and Soil Erosion in a Small Watershed of the Loess Plateau with a Distributed Model.” Journal of Hydrologic Engineering 13 (5): 392–399. https://doi.org/10.1061/(ASCE)1084-0699(2008)13:5(392).
- Heng, Z., and X. Jiang. 2019. “An Assessment of the Temperature and Humidity of Atmospheric Infrared Sounder(airs) V6 Profiles Using Radiosonde Data in the Lee of the Tibetan Plateau.” Atmosphere 10 (7): 394. https://doi.org/10.3390/atmos10070394.
- Hu, D., and Y. Q. Li. 2015. “Spatial and Temporal Variations of Nocturnal Precipitation in Sichuan Over the Eastern Tibetan Plateau.” Chinese Journal of Atmosphere Sciences 39 (1): 161–179.
- J, H. G., B. D. T, D. Braithwaite, K. Hsu, R.Joyce, P. Xie. 2018. “Alporithm Theoretical Basis Document(atbd) Version 06: NASA Global Precipitation Measurement(gpm) Integrated Multi-SatellitE Retrievals for GPM(IMERG).” Greenbelt, MD, USA: NASA. https://pmm.nasa.gov/sites/default/document_files/IMERG_ATBD_V06.pdf.
- J, H. G., B. D. T, N. E. J, D. B. Wolff, R. F. Adler, G. Gu, Y. Hong, et al. 2007. “The TRMM Multi-Satellite Precipitation Analysis(tmpa): Quasi-Global, Multiyear, Combined-Sensor Precipitation Eatimates at Fine Scales.” Journal of Hydrometeorology 8 (1): 38–55. https://doi.org/10.1175/JHM560.1.
- J, J. R., J. J. E, A. P. A, and P. Xie. 2004. “CMORPH: A Method That Produces Global Precipitation Estimates from Passive Microwave and Infrared Data at High Spatial and Temporal Resolution.” Journal of Hydrometeorology 5 (3): 287–296. https://doi.org/10.1175/1525-7541(2004)005<0487:CAMTPG>2.0.CO;2.
- K, H. A., R. K. Kakar, S. Neeck, A. A. Azarbarzin, C. D. Kummerow, M. Kojima, R. Oki, K. Nakamura, and T. Iguchi. 2014. “The Global Precipitation Measurement Mission.” Bulletin of the American Meteorological Society 95 (5): 701–722. https://doi.org/10.1175/BAMS-D-13-00164.1.
- Kidd, C., and G. Huffman. 2011. “Global precipitation measurement.” Meteorological Applications 18 (3): 334–353. https://doi.org/10.1002/met.284.
- Kidd, C., and V. Levizzani. 2011. “Status of satellite precipitation retrievals.” Hydrology and Earth System Sciences 15 (4): 1109–1116. https://doi.org/10.5194/hess-15-1109-2011.
- Kirstetter, P., Y. Hong, J. Gourley, M. Schwaller, W. Petersen, and J. Zhang. 2013. “Comparison of TRMM 2A25 Products, Version 6 and Version 7, with NOAA/NSSL Ground Radar–Based National Mosaic QPE.” Hydrometeorol 14 (2): 661–669. https://doi.org/10.1175/JHM-D-12-030.1.
- Kubota, T., S. Shige, H. Hashizurne, K. Aonashi, N. Takahashi, S. Seto, M. Hirose, et al. 2007. “Global Precipitation Map Using Satellite-Borne Microwave Radiometers by the Gsmap Project: Production and Validation.” IEEE Transactions on Geoscience & Remote Sensing 45 (7): 2259–2275. https://doi.org/10.1109/TGRS.2007.895337.
- L, H. X., W. Wu, X. J. H. 2023. “The Application Performance of the ERA5-5-Land Precipitation Datasets in Southwest China.” Plateau Meteorology 42 (6): 1562–1575. https://doi.org/10.7522/j.issn.1000-0534.
- Li, J., B. Yong, and H. Wu. 2023. “Error Evaluation of FY4A and GPM Satellite Precipitation Estimates Over Chinese Mainland.” Remote Sensing Technology and Application: 1–14. Sep 20. http://kns.cnki.net/kcms/detail/62.1099.TP.20230404.1713.002.html.
- Li, Y., D. Li, S. Yang, C. Liu, A. Zhong, and Y. Li. 2010. “Characteristics of the Precipitation Over the Eastern Edge of the Tibetan Plateau.” Meteorology and Atmospheric Physics 106 (1–2): 49–56. https://doi.org/10.1007/s00703-009-0048-1.
- Liu, F. P., C. Yang, and Y. Liu. 2023. “Temporal and Spatial Evolution of Precipitation in Sichuan Province in Recent 60 Years.” Journal of North China University of Water Resources and Electric Power(natural Science Edition) 44 (2): 16–23.
- Lu, X., G. Tang, M. Wei, L. Yang, and Y. Zhang. “Evaluation of Multi-Satellite Precipitation Products in Xinjiang, China.” International Journal of Remote Sensing 2018:1–26. https://doi.org/10.1080/01431161.2018.1461246.
- Ma, B. Y., S. H. Tang, and J. Y. Hu. 2022. “Validation and Application of FY-2H Total Precipitation Water Products in the Belt and Road Region.” Meteorological Monthly 48 (5): 595–604.
- Ma, Y., G. Tang, D. Long, B. Yong, L. Zhong, W. Wan, Y. Hong, et al. 2016. “Similarity and Error Intercomparison of the GPM and Its Predecessor TRMM Multisatellite Precipitation Analysis Using Best Available Guage Network Over the Tibetan Plateau.” Remote Sensing 8 (7): 569. https://doi.org/10.3390/rs8070569.
- Ma, Y., Y. Zhang, D. Yang, and S. B. Farhan. 2015. “Precipitation Bias Variability versus Various Gauges Under Different Climatic Conditions Over the Third Pole Environment (TPE) Region.” International Journal of Climatology 35 (7): 1201–1211. https://doi.org/10.1002/joc.4045.
- Maggioni, V., P. C. Meyers, and M. D. Robinson. 2016. “A Review of Merged High-Resolution Satellite Precipitation Product Accuracy During the Tropical Rainfall Measuring Mission(TRMM) Era.” Journal of Hydrometeorology 17 (4): 1101–1117. https://doi.org/10.1175/JHM-D-15-0190.1.
- Prashant, K., and K. Atul. 2016. “Assimilation of INSAT-3D Hydro-Estimator Method Retrieved Rainfall for Short-Range Weather Prediction.” Quarterly Journal of the Royal Meteorological Society 143 (702): 384–394. https://doi.org/10.1002/qj.2929.
- Qiao, L., Y. Li, J. Fu, C. Tian, B. Bi, and Q. Zhou. 2012. The national intelligent grid meteorological forecasting business standard (provisional). PRC National Standard. China Meteorological Administration and Standardization Administration of China.
- Ren, J., X. G. R, Z. W. G, L. Leng, Y. Xiao, R. Wan, J. Wang, et al. 2021. “Evaluation and Improvement of FY-4A AGRI Quantitative Precipitation Estimation of Summer Precipitation Over Complex Topography of Western China.” Remote Sensing 13 (21): 4366. https://doi.org/10.3390/rsl3214366.
- Sharifie, E., R. Steinacker, and B. Saghafian. 2016. “Assessment of GPM-IMERG and Other Precipitation Products Against Gauge Data Under Different Topographic and Climatic Conditions in Iran: Preliminary Results.” Remote Seinsing 8 (2): 135. https://doi.org/10.3390/rs8020135.
- Shukla, S., A. McNally, G. Husak, and C. Funk. 2014. “A Seasonal Agricultural Drought Forecast System for Food-Insecure Regions of East Africa.” Hydrology and Earth System Sciences 18 (10): 3907–3921. https://doi.org/10.5194/hess-18-3907-2014.
- Song, Y., L. Han, X. Huang, and G. Wang. 2023. “Analysis and Evaluation of the Layered Precipitation Water Vapor Data from the FENGYUN-4A/AGRI Over the Southeastern Tibetan Plateau.” Atmosphere 14 (2): 277. https://doi.org/10.3390/atmos.14020277.
- Sun, W. Y., L. Zhu, and M. H. Wang. 2023. “Characteristics and Mechanisms of the Spatiotemporal Rainfall Distribution During the Warm Season Over Sichuan Province.” JOURNAL of TROPICAL METEOROLOGY 39 (1): 115–128.
- Tan, M., and Z. Duan. 2017. “Assessment of GPM and TRMM Precipitation Products Over Singapore.” Remote Sensing 9 (7): 720. https://doi.org/10.3390/rs9070720.
- Tang, G., D. Long, Y. Hong, J. Gao, and W. Wan. 2018. “Documentation of Multifactorial Relationships Between Precipitation and Topography of the Tibetan Plateau Using Spaceborne Precipitation Radars.” Remote Sensing of Environmentm 208:82–96. https://doi.org/10.1016/j.rse.2018.02.007.
- Tang, G., Y. Ma, D. Long, L. Zhong, and Y. Hong. 2016. “Evaluation of GPM Day-1 IMERG and TMPA Version-7 Legacy Products Over Mainland China at Multiple Spatiotemporal Scales.” Journal of Hydrology 533:153–167. https://doi.org/10.1016/j.jhy-drol.2015.12.008.
- Tapiador, F. J., T. F J, W. Petersen, A. Y. Hou, E. García-Ortega, L. A. T. Machado, C. F. Angelis, et al. 2012. “Global Precipitation Measurement: Methods, Datasets and Applications.” Atmospheric Research 104-105:70–97. https://doi.org/10.1016/j.atmosres.2011.10.021.
- Tong, K., F. Su, D. Yang, and Z. Hao. 2007. “Evaluation of Satellite Precipitation Retrievals and Their Potential Cycle Using Observational and Model Data.” Journal of Hydromoteorology 8 (4): 758–769.
- W, Y. D., X. Z. X, Z. Li, X. Yuan, L. Wang, C. Y. Liao, F. Q. Tian. 2011. “Progress and Prospect of Hydrological Sciences.” Progress in Geography 26 (11): 1162–1172.
- Wang, C. G., and Y. Hong. 2018. “Review on Inversion, Verification and Application of Satellite Remote Sensing of Precipitation.” Water Resources and Hydropower Engineering 49 (8): 1–9.
- Wang, Y., L. Wang, X. Li, and D. Chen. 2018. “Temporal and Spatial Changes in Estimated Near-Surface Air Temperature Lapse Rates on Tibetan Plateau.” International Journal of Climatology 38 (7): 2907–2921. https://doi.org/10.1002/joc.5471.
- Wang, Z. T., S. B. Li, and Z. Y. Zhang. 2021. “Multi-Scale Accuracy Evaluation of GPM Precipitation Products Over the Qinghai-Tibet Plateau.” Yellow River 43 (4): 43–49.
- Wen, Y., Q. Cao, P.-E. Kirstetter, Y. Hong, J. J. Gourley, J. Zhang, G. Zhang, et al. 2013. “Incorporating NASA Spaceborne Radar Data into NOAA National Mosaic QPE System for Improved Precipitation Measurement: A Physically Based VPR Identification and Enhancement Method.” Journal of Hydrometeorology 14 (4): 1293–1307. https://doi.org/10.1175/JHM-D-12-0106.1.
- X, X. Z., Z. Liu, G. Fu, and Y. Chen. 2010. “Trends of Major Hydroclimatic Variables in the Tarim River Basin During the Past 50 Years.” Journal of Arid Environments 74 (2): 256–267. https://doi.org/10.1016/j.jaridenv.2009.08.014.
- Xu, J., Z. Ma, G. Tang, Q. Ji, X. Min, W. Wan, Z. Shi, et al. 2019. “Quantitative Evalustions and Error Source Analysis of Fengyun-2-Based and GPM-Based Precipitation Products Over Mainland China in Summer, 2018.” Remote Sensing 11 (24): 2992. https://doi.org/10.3390/rs11242992.
- Y, K. N., P. S. M, T. Lakhankar, and A. Jha. 2013. “Evaluating Satellite Products for Precipitation Estimation in Mountain Regions: A Case Study for Nepal.” Remote Sensing 5 (8): 4107–4123. https://doi.org/10.3390/rs5084107.
- Y, Z. C., C. S. X, L. Y. Q, G. Z. Peng, S. Q. Yang, and J. Peng. 2011. “Precipitation Variation and Its Impacts in Sichuan in the Last 50 Years.” Acta Geographica Sinica 31 (4): 478–484.
- Yong, B., D. Liu, G. J. J, Y. Tian, G. J. Huffman, L. Ren, Y. Hong, et al. 2015. “Global View of Real-Time TRMM Multisatellite Precipitation Analysis: Implications for Its Successor Global Precipitation Measurement Mission.Bulletin of the American Meteorological Society.” Bulletin of the American Meteorological Society 96 (2): 283–296. https://doi.org/10.1175/BAMS-D-14-00017.1.
- You, R. 2018. “Satellite quantitative precipitation estimation method[C]. China Meteorological Society.” The 35th Annual meeting of the Chinese Meteorological Society S21 Satellite Meteorology and Ecological Remote Sensing, 234.
- Zhang, D. W., Z. T. Cong, and G. H. Ni. 2013. “Comparison of Three Mann-Kendall Methods Based on the China’s Meteorological Data.” Advances Water Science 24 (4): 490–496.
- Zhang, R., B. Yong, S. K. Zeng, W. Li, and X. Tang. 2021. “Evaluation of GPM Satellite Precipitation Products Over Mainland China.” Yangtze River 52 (6): 50–59. https://doi.org/10.2166/nh.2021.029.
- Zhang, Y., M. Xue, B. Li, J. Chen, and Z. Tao. 2016. “Spatial Characteristics of Extreme Rainfall Over China with Hourly Through 24-Hour Accumulation Periods Based on National-Level Hourly Rain Gauge Data.” Advances in Atmospheric Science 33 (11): 1218–1232. https://doi.org/10.1007/s00376-016-6128-5.
- Zhong, Y. L. 2021. “Evaluation and verification of FY-4A satellite quantitative precipitation estimation product.” Journal of Agricultural Catastropholgy 11 (3): 96–98.