
ABSTRACT
Current signal systems for managing road traffic in many urban areas around the world lack a coordinated approach to detecting the spatial and temporal evolution of congestion across control regions within city networks. This severely inhibits these systems’ ability to detect reliably, on a strategic level, the onset of congestion and implement effective preventative action. As traffic is a time-dependent and non-linear system, Chaos Theory is a prime candidate for application to Urban Traffic Control (UTC) to improve congestion and pollution management. Previous applications have been restricted to relatively uncomplicated motorway and inter-urban networks, arguably where the associated problems of congestion and vehicle emissions are less severe, due to a general unavailability of high-resolution temporal and spatial data that preserve the variability in short-term traffic patterns required for Chaos Theory to work to its full potential. This paper argues that this restriction can now be overcome due to the emergence of new sources of high-resolution data and large data storage capabilities. Consequently, this opens up the real possibility for a new generation of UTC systems that are better able to detect the dynamic states of traffic and therefore more effectively prevent the onset of traffic congestion in urban areas worldwide.
1. Background
Traffic congestion is widely recognised as a major problem that makes a significant contribution to global warming, environmental pollution and the depletion of fossil fuels (Manley & Cheng, Citation2010; O'Flaherty, Citation2005; Papageorgiou, Diakaki, Dinopoulou, Kotsialos, & Yibing, Citation2003). For example, vehicle miles has grown by nearly 500% in the USA since 1940, which causes substantial delays, especially in urban areas and adversely affects journey times (US Census Bureau, Citation2005). Congestion has a significant impact on local air quality with road transport being responsible for over 90% of domestic transport emissions and the declaration of air quality management areas in urban areas (Department for Transport, Citation2011). Congestion costs advanced economies such as the USA approximately £72 billion per year (Bloomberg, Citation2011), and the UK between £13 and £20 billion per year (Centre for Economics and Business Research, Citation2014; Goodwin, Citation2004; The Smith Group, Citation1999). One of the root causes of the problem is the mismatch between rates of growth in the demand for road travel and the supply of roadspace. For example, in the UK, the average increase in road traffic has been approximately 4% per annum since 1950, whilst the corresponding increase in road capacity has only been around 0.5% (Department for Transport, Citation2013a, Citation2013b; Goodwin, Citation2004). Therefore, whilst the amount of road traffic has grown rapidly, road capacity has not expanded sufficiently to accommodate the additional demand. Building new roads to increase urban road capacity on a large enough scale is unlikely, as this often tends to be unpopular, economically unaffordable and environmentally unsustainable (Papageorgiou et al., Citation2003).
Globally, various Urban Traffic Control (UTC) systems have become pivotal in trying to manage congestion to improve the efficiency of the urban road network in many countries across the world. Typically, a managed urban network consists of a group of smaller ‘controlled' regions (which may or may not be connected in terms of information exchange), where each region comprises a number of coordinated signals operating at the same cycle time. However, due to their essentially parochial nature, current signal control systems for managing traffic in urban areas lack a coordinated approach to detecting the spatial and temporal evolution of congestion across signal control regions within cities. These systems tend to perform better in undersaturated traffic conditions, as in oversaturated conditions, they are unable to cope with sudden surges in traffic volumes. These occurrences at individual junctions can have “knock-on” effects across the entire network (Papageorgiou et al., Citation2003).
Consequently, congestion still poses a significant challenge for network managers. This is because the traffic that converges to create the congestion on the link in the network needs to be controlled at a strategic position upstream at a time prior to the onset of congestion. The volatility in variables including vehicle speed, flow and density that are used to analyse traffic streams makes it difficult to forecast congestion accurately. However, identifying the emergence of chaos occurrences between free flow and congestion can be used to identify the onset of congestion and thus trigger the implementation of more strategic control action to prevent congestion from occurring.
According to Dreyer and Hickey (Citation1991) writing with regard to dynamical systems, “the term ‘chaotic’ is generally used to describe non-linear, but deterministic systems whose dynamic behaviour proceeds from stable points through a series of stable cycles to a state where there is no discernible regularity or order”. Chaos Theory is capable of dealing with these complexities, by naturally accounting for all of the factors that are responsible for the system's dynamics. It can extract all the system information and relationships without the need to determine first the laws or equations of the underlying dynamics. It relies on identifying a deterministic, non-linear system that has sensitivity to initial conditions. In such systems, the future (and even the past) state of the system can be determined according to the evolutionary equations, based on Chaos analysis, if the initial value is known (Frazier & Kockelman, Citation2004). The pioneering work in Chaos Theory was in 1961 by Edward Lorenz, an American mathematician and meteorologist, who observed that a small change in the initial condition of a system's conditions could have a significant impact on its long-term state. For example, he observed that a change in an initial setting of a weather prediction model by a tiny amount gave rise to a rapid divergence in the final output of the model. This is known popularly as the “butterfly effect” (Gleick, Citation1988). Chaotic behaviour is almost ubiquitous. It is a property of a number of natural or artificial systems that support our daily lives, but often, these systems appear so random that it is impossible to recognise visually any chaotic patterns, although such patterns indeed may exist. Therefore, Chaos Theory techniques enable large arrays of variables of chaotic systems to be represented in phase space (e.g. a multi-dimension plot of a variable in an X–Y–Z plane) so that any possible underlying patterns can be identified to enable forecasting to be undertaken (Uittenbogaard, Citation2011). Clearly, this could play a significant role in the prevention of congestion on urban road networks. However, the key characteristics of traffic behaviour needed to deploy Chaos Theory (e.g. traffic flow and occupancy) can vary over a matter of seconds and within tens of metres across a network. Therefore, to detect these variations, the system must capture relevant data at sufficiently high spatial and temporal resolution to enable an understanding of the prevailing dynamic state and perturbations in traffic on a link, at a given point in time, and the evolution of the resulting congested state in the near and short-term future. Given that low-resolution data fail to preserve the short-term variations in traffic patterns makes the dynamic property of the system unclear; therefore, such data do not adequately support the examination of Chaos Theory.
This paper therefore aims to review the theory and previous applications of Chaos Theory for analysing traffic behaviour, and to explore the potential that now exists due to the increasing availability of high-resolution temporal and spatial data. In order to achieve this, the paper is structured as follows: Section 2 presents a brief review of the practice of traffic signal control. Section 3 discusses the fundamental principles of Chaos Theory, whilst Section 4 presents the algorithms for the phase space reconstruction. Section 5 argues qualitatively that the road traffic system is a chaotic system and identifies the conditions under which chaos can emerge. Section 6 reviews previous applications of the theory in traffic analysis, and identifies how these studies have been restricted to non-urban environments due to the lack of high-resolution data and the complexity of congested urban networks. Section 7 argues that the availability of high temporal resolution data from sources such as Motes, Bluetooth, Split Cycle Offset Optimisation Technique (SCOOT) and Automatic Number Plate Recognition (ANPR) can now overcome these limitations. Section 8 includes a numerical example of applying Chaos Theory to highly resolved traffic data to determine the states of traffic flow. Finally, Section 9 draws conclusions and makes recommendations for applying Chaos Theory, in the future, to manage traffic in urban areas to reduce the problems of congestion and atmospheric pollution, through the incorporation of new chaos-based algorithms within existing Urban Traffic Management and Control (UTMC) systems.
2. Review of the practice of traffic control in urban areas (from the 1920s to date)
Traffic signals are deployed alongside a number of technology-supported applications such as UTC and variable message signs to enhance the strategic operation of local or network-wide area road network (Hounsell & Mcdonald, Citation2001; Hounsell, Shrestha, Piao, & Mcdonald, Citation2009). Early installations in the 1920s were isolated (uncoordinated) fixed-time traffic signals, which had only a fixed amount of green time available irrespective of the number of vehicles waiting to be discharged through the junction. Due to not optimising the green splits in real time, excess green could be available when only a few vehicles are awaiting discharge and vice versa, making fixed-time signals largely unable to tackle the challenges and complexities of urban road congestion. In the late 1950s, the earliest UTC techniques were developed for coordinating the operation of fixed-time signals on a route to achieve a ‘green wave' along a set of connected links such as a radial network. However, this strategy is unable to respond, in real time, to changing traffic conditions, and is prone to causing lengthy delays to traffic on side roads and a lack of coordination in opposing traffic streams. Crucially, fixed-time UTC whether “green wave” or area-wide is not demand-responsive, and therefore unable to handle the complex changes in arrival patterns of vehicles at a stop line, or respond to unplanned incidents such as traffic accidents (Hamilton, Waterson, Cherret, & Snell, Citation2012). Due to these drawbacks, their effectiveness in controlling and managing traffic flow is limited to traffic conditions up to about 90–95% degree of saturation. Such conditions are becoming less likely in urban networks, where the complex nature of the spatial and temporal evolution of congestion across networks makes fixed-time signals inappropriate. Moreover, their signal plans (compiled for different times of the day and for recurring events on the network) degrade in effectiveness rapidly relative to changes in traffic patterns, and require regular updating to be effective (Bell, Citation1983).
In the 1960s, “intelligent” stand-alone (isolated) traffic signals such as Vehicle Actuation (VA) and subsequently Microprocessor Optimised Vehicle Actuation (MOVA) techniques were introduced for the efficient operation of traffic signals (Department for Transport, Citation1999). However, VA is prone to extend the green phase inefficiently, especially when there are long queues waiting at red signals, because consideration is not given to opposing traffic streams. Moreover, it is difficult to set maximum greens effectively, and this can degrade the performance if traffic arrival patterns become platooned which requires coordination of adjacent signals as well as the balance of flows in conflicting traffic streams (Simmonite, Citation2005). MOVA generates its own signal timings cycle-by-cycle, which vary continuously with traffic conditions, and therefore is able to respond dynamically to variations in vehicle arrival rates (Meehan, Citation2003). Simmonite (Citation2005) suggests that MOVA overcomes the problems of VA by implementing a strategy based on delay-and-stops minimisation (under uncongested situations) or capacity-maximisation (under congested conditions). Although VA and MOVA are effective controls, they are generally limited to isolated junctions and generally not feasible at the network level, where it is desirable to coordinate the operation of neighbouring junctions, making them of limited use for urban traffic management. However, isolated junctions nonetheless create congestion problems which can spill back and affect signal coordinated regions and should be considered part of a strategic traffic management capability offered by Chaos Theory.
In the 1970s, the (then) Transport and Road Research Laboratory (TRRL), in collaboration with suppliers of traffic systems in the UK, developed the concept of demand-responsive UTC systems to overcome the limitations of fixed-time UTC (Department for Transport, Citation1999). Current systems include SCOOT (Bourner, Citation1984), Sydney Co-ordinated Adaptive Traffic System (SCATS) (Lowrie, Citation1982), Urban Traffic Optimisation by Integrated Automation (UTOPIA) (Donati, Mauro, Roncolini, & Vallauri, Citation1984), Real Time Hierarchical Optimised Distributed and effective System (RHODES) (Mirchandani & Head, Citation2001), Programming Dynamic (PRODYN) (Farges, Khoudour, & Lesort, Citation1990) and Method for the Optimization of Traffic signals In On-line controlled Networks (MOTION) (Busch, Citation1996). These systems make use of detectors that monitor traffic flows continuously across the network in real time and adjust the green splits, offsets and cycle times to optimise their operations and reduce delays (Hamilton et al., Citation2012). These systems typically monitor the network at the signal control region level (typically 4–12 adjacent junctions), and undertake optimisation procedures to ensure the smooth flow of traffic across a particular section or area of the urban network. These demand-responsive systems manage traffic much better than fixed-time systems, with an estimated reduction of approximately 12–20% (on average) in delays in SCOOT, for example, compared to fixed-time signals (Department for Transport, Citation1999). Consequently, by combining SCOOT with Intelligent Transport Systems such as variable message systems, for example, to redistribute traffic over alternative routes in the event of incidents occurring on the network, UTC systems have led to significant improvements in urban traffic management.
In spite of this success, the optimisation procedures are only effective within network regions in undersaturated and close to saturated traffic conditions, where queues build up during the red phase and dissipate during the green phase or can be stored on longer links in the network by appropriate adjustment of offsets, cycle time or splits. In oversaturated traffic conditions however, they are unable to cope with surges and perturbations in the traffic flow or capacity, which go undetected. Consequently, their ability to respond demand-responsively fails, as their optimisation procedures are unable to produce appropriate manipulations of the signal timings dynamically but instead signal control regresses to a fixed-time modus operandi. Furthermore, UTC systems are unable to control and coordinate traffic flow between signalised regions or isolated junctions that make up the urban road network. Therefore, due to the inability to manage traffic between regions, traffic movement into an already saturated region continues unabated even when congestion begins to emerge leading to the worsening of existing adverse traffic conditions. If the possibility exists to control the amount of inflow into network regions, then it would be possible to manage these inbound flows upstream, perhaps on the outskirts of a town or city, to ensure that network regions remain in undersaturated conditions.
All current demand-responsive signal control systems analyse and process real-time traffic data (such as volume, density, lane occupancy) to carry out their basic operations in order to determine the type of control strategy to implement (Jianming, Chunguang, Jingyan, Zuo, & Jiangtao, Citation2003). The bias in their approach, that also limits their functionality, is that they are only able to implement solutions that tackle adverse network conditions as or after they occur, rather than being pre-emptive of congestion events in order to implement mitigating strategies beforehand. We argue that, in order for UTC systems to be more effective, they must develop this capability to anticipate congestion events and deal with them in advance. Appropriate mitigation plans, when implemented ahead of congestion events, will improve urban traffic management and reduce congestion and associated emissions, but this is only possible when traffic conditions can be forecast spatially and temporally into the future with sufficient accuracy.
Given this background, it is important that modern UTC systems are equipped to forecast network events much more accurately, at least in the short term, as an enhanced benefit of Intelligent Transport Systems (ITS) applications to urban traffic management (Han & Song, Citation2003). It is no surprise, therefore, that the development of traffic condition forecast models has become an area of growing interest amongst researchers and practitioners alike who are exploring ways to understand the dynamics of traffic flow in order to be able to simulate and forecast real-time traffic regimes more accurately (Huang & Sadek, Citation2009; Kesting & Treiber, Citation2008; Qi & Ishak, Citation2014; Vlahogianni, Karlaftis, & Golias, Citation2005). Traffic condition models are able to predict conditions within the coming hour using data from roadway sensors. The ability to predict traffic conditions in real time makes these models much more attractive than traditional methods that can only make predictions based on (e.g.) annual growth factors. These are not only more susceptible to inaccurate projections due to their long forecast horizons but also of little value to the day-to-day operation of traffic networks. The benefits of a short-term prediction horizon should not be underestimated. For example, Cheslow, Hatcher, and Patel (Citation1992) suggest that “the ability to make and continuously update predictions of traffic flows and link times for several minutes into the future using real-time data is a major requirement for providing dynamic traffic control”. In recent years, several traffic condition models have been developed including time series, non-parametric, filtering and various hybrids of them. These are generally restricted in their applicability to congested traffic situations due to inherent weaknesses in replicating, in the modelling process, traffic's non-linear behaviour (Guo, Huang, & Williams, Citation2014; Vlahogianni et al., Citation2005; Zhang, Patuwo, & Hu, Citation1998; Zheng & Mcdonald, Citation2007). In order to overcome the limitations, phase-state models based on Chaos Theory have emerged which have the greater potential for analysing the complexities in perturbing traffic flow, which are due to the various unpredictable and immeasurable quantities within road traffic systems (Jianming et al., Citation2003).
3. The logistic equation
The logistic equation is useful for understanding the characteristic features of dynamic systems. It describes the evolution over time of an arbitrary variable X (e.g. flow), which is a function of its previous value and a parameter k, which is the growth rate or ‘tuning parameter' and the determinant of the steepness of the function. The mathematical function is given by where
and
, and
and
are the previous and current values, respectively. As illustrated in , the parabolic curve of this equation shows an exponential rise in
as
is increased below the mean value, but
decreases as
is increased above the mean value. Another characteristic feature is that there is increased rate of change in
as the k-value is increased.
Figure 1. A stable time path for a logistic growth curve.
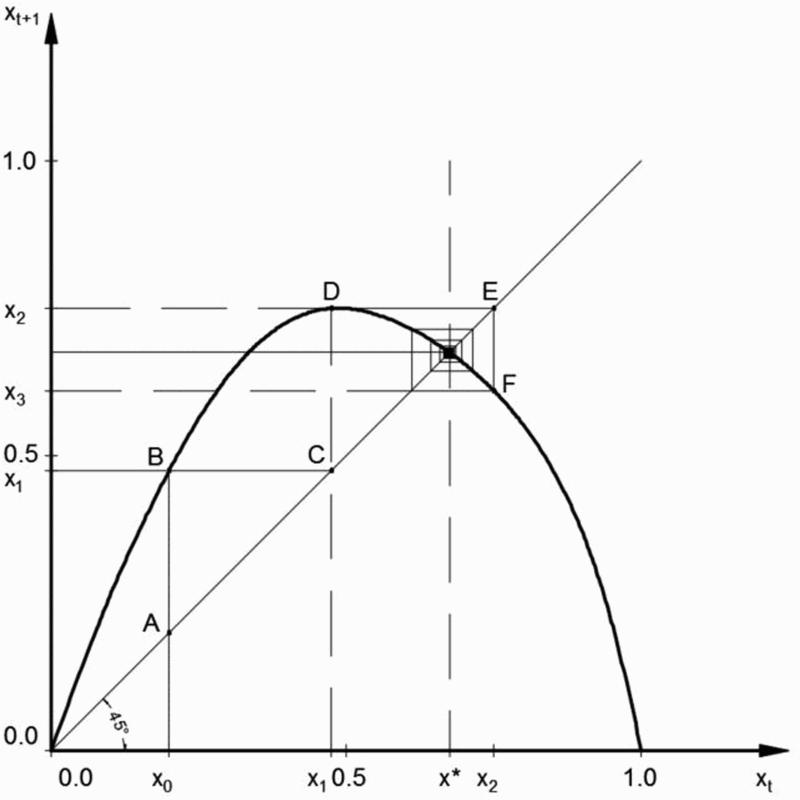
also illustrates the solution of the logistic equation determined graphically through an iterative process. Let us suppose that we require a solution for the logistic equation: , where
. All values of
will lie on the parabolic curve, whilst the 45° line shows the path of points when
. Suppose that the initial value
at time
, then the intercept
on the parabola defines
at the first iteration. At the second iteration,
(this is determined from the intercept of
on the 45° line), point D on the parabola defines the future value (
) of the system. Similarly, for the third iteration, let
and point
on the parabola defines the future value
of the system. This iterative process is repeated a number of times until eventually the variable converges to a steady equilibrium
at 2/3. As long as the
-value is less than three, the system is stable and reaches some other steady -state values other than the mean (Butler, Citation1990).
This equilibrium point, however, becomes unstable as soon as the -value exceeds three and the system starts to bifurcate (doubling of the solution) exhibiting a two-period cycle where the solution alternates between two values. By increasing the
-value gradually, the bifurcations increase further with the periodicity of
(where n = 1, 2, 3…), such that the cycles progress to a four-period cycle (where the system repeats the same sequence after every fifth iteration), then an eight-period cycle, and so on. The bifurcations become more rapid until the point of accumulation with a
-value of approximately 3.57, when the system becomes chaotic, where there can be an infinite number of periodic cycles. This illustrates the characteristic of chaotic systems. The observation reveals that a change in the
-value affects the degree of non-linearity in a deterministic system, which consequently impacts on the output solutions. Xu and Gao (Citation2008) identified the main features of unjammed traffic as period-1 and period-2 attractors, whilst period doubling and chaos are characteristics of heavy traffic flow. Under chaotic traffic conditions, drivers are forced to accelerate and decelerate giving rise to stop–start conditions, which are uncomfortable, increase fuel costs and decrease road capacity. This knowledge of chaotic variables is therefore important to enable traffic operators to provide stable traffic conditions to improve the safety and level of service of the road system.
Butler (Citation1990) further illustrated that the time series plot of versus the number of iterations for the logistic curve shows a fluctuating profile even though the system converges to a stable point. Therefore, in our illustrative example above, it may be misconstrued based on the fluctuating time series profile that the system lacks chaotic properties, if the underlying pattern of the system is unknown. This demonstrates that the fluctuating profile of time series data are not always outputs of completely random systems. Andrews (Citation1996) confirmed this observation indicating that deterministic systems could generate profiles that may be pseudo-random, but this is only due to their sensitivity to initial conditions. This suggests that small changes in the initial conditions may be responsible for disproportionate changes in the future values of the system. The above discussion, in relation to the logistic curve, implies that traffic systems that generate non-linear time series profiles may be possibly products of deterministic rather than stochastic processes. In order to advance the discussion, the algorithms of the phase space reconstruction approach for determining key chaos variables are discussed in the next section.
4. Phase space reconstruction
Takens (Citation1981) provides the mathematical foundation of the phase space reconstruction method for the non-linear analysis of dynamic systems. Using this method, it is possible to construct the underlying dynamics of a non-linear system using the time series of the system's evolution. Through this approach, the characteristics of a dynamic system can be understood based on only the time series information without the need of any additional information (or evolutionary equations).
Suppose a scalar observed time series:(1)
where is a constant sampling interval;
and
are the initial and final times, respectively, within the sampling interval; and
evaluates a specific time for the time series’ observation of interest. According to the delay coordinate embedding method (Jianming et al., Citation2003), each scalar measurement
is a component of a vector
of
-dimensions and
is the delay time (lag), as follows:
(2)
where is the embedding dimension and
is the length of the time series.
Two conventional approaches for calculating the lag are the autocorrelation and mutual information methods (Jianming et al., Citation2003). The G-P Algorithm a method by Grassberger and Procaccis (Xue & Shi, Citation2008; Wang, Shi, & Lu, Citation2005; Zhang & Liu, Citation2007), is widely used to select the desired correlation dimension () and embedding dimension (
), based on the following algorithm:
Let denote the distance between them, so that:
(3)
Given a certain distance r, the ratio of the number of paired phase points whose distance of separation is less than r to all the pairs of phase points is given by the accumulation function:(4)
where is the Heaviside function, which is given by
(5)
Taking the natural log of both sides:(6)
The correlation dimension is a type of fractal geometry, which defines the shape of complex objects generated usually by the trajectory of a chaotic attractor. This is a fraction unlike the dimensions of simple geometrical objects, which are whole numbers (Lorenz, Citation1993). Fractals possess a property of self-similarity at all scales, that is, by magnifying several pieces of the same object, each of the magnified pieces is indistinguishable from the whole system. They provide a statistical index used to judge the degree of complexity of an object according to the ratio of how the detail in the fractal pattern changes with the scale of measurement (Mandelbrot, Citation1983; Shirer, Fosmire, Wells, & Suciu, Citation1997). For example, the Koch curve has a fractal dimension of about 1.26, which suggests that the curve is rougher than a smooth curve or line that has a dimension of one. Since the dimension is less than two, it has no area and therefore poor at filling up space compared to a square. In chaos mathematics, the fractal dimension, as well as a positive Lyapunov exponent, is used to indicate the presence of chaos (Jianming et al., Citation2003).
Chaos Theory helps to explain the evolution of chaotic systems through a measure of the rate of change of a system, known as Lyapunov exponents. In the traffic system, the Lyapunov exponents may be considered as an indicator of the lengthening and shortening of the gap between vehicles in a phase space. As such, it may be used to explain the changing traffic conditions on an urban link.
For any two points in phase space with an initial separation of , if after a time of a certain period t the separation between the two orbits is
, then the Lyapunov exponent (
) is given by
(7)
The next question is to establish whether chaos is present in urban road traffic, and, if so, under what circumstances can it occur?
5. Chaos in road traffic networks
Chaos, amongst other reasons, is due to the combined effect of regular and randomly occurring events such as variability in traffic speeds, buses stopping, pedestrians crossing, vehicles parking and unparking at the roadside and the effect of UTMC traffic systems. This results in the traffic signals discharging only a portion of an entire queue length during the green phase in each cycle, which, over time, leads to severe queuing, which then becomes a recipe for chaotic behaviour to develop (Frazier & Kockelman, Citation2004). The presence of non-linearity does not always guarantee chaos (Gleick, Citation1988); however, it has been established that non-linearity does generate chaos in the traffic system (Lan, Lin, & Kuo, Citation2003; Narh, Thorpe, Bell, & Hill, Citation2014; Shang, Wan, & Kama, Citation2007). Because this activity generates chaos on specific links or at junctions in a network on a day-to-day basis, this opens up the potential for the technique to identify patterns of traffic flow spatially and temporally that lead to the congested state.
Due to its dynamic nature, traffic fluctuates between free flow and congestion, but any future state of the network cannot be determined accurately. Primarily, this is due to the varied mix of human behaviours, which is partly a function of environmental factors, and partly due to the heterogeneity in drivers (e.g. personality mix of males and females of a wide age range), which gives rise to varied reaction times consequent to different driving styles (Dendrinos, Citation1994; Lee, Kwok, & Williams, Citation2014). Studies have attributed the chaotic behaviour in traffic flow to delay in human reactions, some “mass random” phenomenon and the varying physical and human elements, which ultimately pose challenges to forecasting accurately events on the road transport network (Safanov, Tomer, Strygin, Ashkenazy, & Havlin, Citation2002; Xu & Gao, Citation2008; Zhu, Xu, & Yan, Citation2010).
Road traffic networks can be prone to sudden gridlocking even when only minor events occur. A small change in a single driver's behaviour, for example when brakes are applied, may affect network conditions, especially when the traffic volume is increasing and unstable conditions are beginning to emerge. In other situations, fluctuations in speed or the spacing between vehicles, car parking and unparking or pedestrians’ jay walking even when traffic density is much lower than the jam density may result in spontaneous traffic congestion.
Another reason why traffic can be prone to chaos is attributable to the similarity between fluid particles and traffic streams. Fluid systems analysed using Chaos Theory in scientific experiments indicate that particles released in the flow tend to deviate from each other over time, with the distances between pairs of particles growing at an exponential rate, which is normally characterised by the Lyapunov exponents (Károlyi, Pattantyús-Ábrahám, & Józsa, Citation2010). Given the resemblance, the principles applicable to fluids may also be relevant to streams of vehicles. This similarity can be observed, for example, if one focuses on the waves that ripple through the network as vehicles brake or accelerate in succession (Sipress, Citation1999). The transmission of “stop-and-go” movement through a road network, as vehicles change speed, is comparable to the shock waves released when a mass of gas fluid hits a bottleneck and transmits a wave of compressed air back in the opposite direction to the stream of oncoming gas (Sessler, Citation2007). Hence, these characteristics can potentially generate or exacerbate the chaotic state of the road network.
In contributing to this discussion, Dendrinos (Citation1994) proposed a utility maximisation model to explain the interactions of motorists in the environment and how this complexity develops the chaotic state of network. The basic assumption in this model is that motorists tend to choose speed, acceleration and spacing (headways) in order to maximise their utility, or the degree of satisfaction enjoyed by a motorist on the road network. In practice, the utility enjoyed by drivers under certain conditions influences their choice of speed and acceleration, which affects the dynamics of the traffic stream. The driving conditions are also functions of other environmental factors, which may include the maximum allowable speed, road surface conditions, weather and pedestrian activities. All this varying mix of conditions faced by each individual motorist, coupled with the heterogeneity in the driver population, gives rise to varied reaction times.
According to the model, the utility of each individual driver is given by the utility function as(8)
Such that:
where:
is the operating speed of the
The vehicle specific parameters are constrained also by other factors: , which includes the constraint imposed by the local maximum allowable speed, road surface conditions, weather and so on.
In the absence of congestion, drivers operate outside of a platooned environment and are unaffected by both the behaviour of neighbouring vehicles, and the distances from other vehicles. However, as vehicular interaction begins to increase in platooned environments, drivers respond to speed, acceleration and separation of vehicles in front and behind. Consequently, the macro-scale density is affected by the choice of speed by the individual drivers. Under these circumstances, motorists respond to the constantly changing influences of other motorists in attempts to maximise their individual utility. Consequently, there is a constant fundamental feedback as motorists change their driving behaviour in order to maximise utility. Dendrinos (Citation1994) states that, “this interaction alone, in effect, may be responsible for non-equilibrium unstable (possibly chaotic) dynamics, depending on the connectances between speed, acceleration/deceleration and immediate density at each individual's utility and perceived constraint functions, and the system wide environment”.
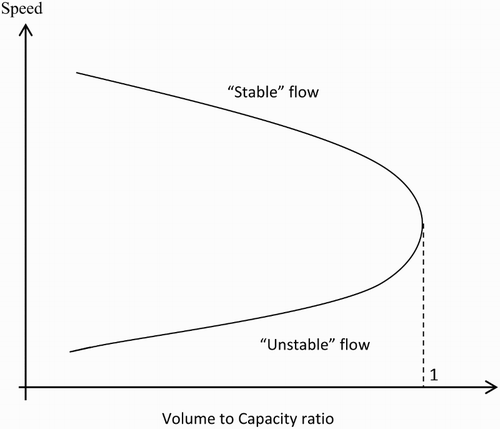
The speed-flow curve in shows an upper region of ‘stable flow’ and lower region of ‘unstable flow’. Motorists enjoy their utility on the upper curve, but less utility on the lower curve is characterised by congestion, increased journey time and significant delays. As illustrated, speed tends to decrease (as flow increases) after an initial period of little change, but at an increased rate of change of speed as flow approaches capacity. This region of a sharp deterioration in speeds defines the onset of an unstable region (chaos) characterised by low speeds as vehicles are forced closer together on the link (Ortuzar & Willumsen, Citation2006). Dendrinos (Citation1994) identifies that the utility of the motorist starts to become noticeably restricted due to the increased rate of interactions as flow approaches capacity, and generates the fundamental feedback interaction that stimulates chaos, which creates conditions for hyper-congestion. Given this background, the next section reviews previous work using real-world data to investigate Chaos Theory in traffic analysis.
Figure 2. The standard static ‘operating speed' versus ‘volume' relationship.
6. Previous applications of Chaos Theory in road traffic analysis
Several studies have shown that traffic data can display chaotic behaviour close to saturated conditions. Kirby and Smith (Citation1991) conducted an exploratory study based on the car-following theory. Their results identified the need to examine non-linear dynamics in more detail and confirmed that various parameters that arise in transport models, such as car following, do bear characteristic features of chaos. The authors concluded that Chaos Theory is suitable for understanding the conditions under which instabilities evolve and propagate through road transport systems. The study also highlighted the need for guidance on how to select the forecasting horizon to make predictions realistic and, finally, recommended a study into ways of analysing and summarising data for timely detection of the transition to chaotic behaviour.
More recently, research into Chaos Theory has mainly focused on motorway networks, as they are relatively simple systems to analyse compared to urban road networks, which can be subject to various interacting elements. Motorways tend to be longer stretches of carriageway, often without a dense deployment of detectors to provide sufficient and appropriate traffic information to be able to understand the evolution and propagation of the dynamic states on links in the network. These studies were based on relatively low temporal resolution data, for example, one-hour intervals, and lacked investigations over a wide spatial area (such as a network of coordinated junctions). Nair, Liu, Rilett, and Gupta (Citation2001) analysed average speed time series data aggregated into 5-minute data from inductive loops installed on the San Antonio freeway system. The non-linear analysis of the traffic data focused on average speed time series aggregated into 5-minute data. Similarly, Shang et al. (Citation2007) identified the existence of a possible geometry (rather than a stochastic character) in traffic speed data sampled at every two minutes in Beijing, and suggested that the traffic flow process could be viewed from a new perspective by reference to its chaotic properties. Both studies identified that traffic data were deterministic and could be modelled based on phase space techniques.
Lan et al. (Citation2003) collected automatic traffic count records sampled at one-minute intervals at 20 selected stations on the Miami Freeway in the USA, for testing and predicting traffic flow dynamics using Chaos Theory. The analysis carried out indicated consistently strong evidence of a chaotic rather than a random structure. Furthermore, short-term traffic flow predictions were possible. In a study in Sacramento, California, Frazier and Kockelman (Citation2004) confirmed that a more generalised view could only be drawn when a wider range of traffic flow rates have been analysed. The study used data from inductive loops collected over a one-month period at 30-second intervals on a section of Interstate 80. Crucially, it concluded that a lack of extensive data, or sampling at the inappropriate frequency, fails to capture accurately the important dynamic features in a system. This has severely inhibited progress applying Chaos Theory to traffic congestion management.
Similarly, Zhang and Liu (Citation2007) confirmed chaotic and fractal properties in traffic data by analysing traffic data for a range of resolutions between 30 seconds and 6 minutes. This study concluded that in order to achieve a reliable forecast, the sample size should be more than ten times that of the correlation dimension of the short-term traffic flow. Krese and Govekar (Citation2013) distinguished between the traffic dynamics of a ring road around Ljubljana in Slovenia and several adjoining highways, based on chaos and the Lyapunov spectrum. The study concluded that the maximal Lyapunov exponents showed the sensitivity of the highway as higher than the ring road, which is an indication that the ring road was capable of responding better to small traffic perturbations than the highway.
In a non-motorway study, research based on UTC–SCOOT data from the Traffic Management Bureau in Beijing carried out traffic flow forecasts from data sampled at an averaging frequency of 15 minutes (Jianming et al., Citation2003). The forecast and actual curves fitted well with a mean square error of 7.09% and equalisation coefficient of 95.44%. It is unclear why the study did not analyse the spatial and temporal evolution of congestion across the network, but this could possibly be due to the low temporal resolution of the data and the sparse distribution of available data for the network. Thus, even in the instance where the study used urban area data, it could not investigate the complexities in the urban flow network to determine whether chaos occurred at the micro-scale level or across a network of interconnected junctions. Therefore, this review suggests that Chaos Theory is relatively data-hungry and requires high temporal and spatial resolution data in order to function appropriately to reveal congestion patterns evolving spatially and temporally over a network.
The above evidence also suggests that earlier studies have only focused on systems with low temporal resolution or simple linear networks such as motorways that are relatively easy to analyse, compared to urban road networks. Chaos Theory is data-hungry and dependent upon the availability of large volumes of data from a densely surveyed network with observations over a long period and possessing a reasonably (high) resolution that preserves the variability in short-term traffic patterns. Suitable data could be, for example, sub-one-minute interval for flow, speed, lane occupancy and traffic noise (Frazier & Kockelman, Citation2004; Lan et al., Citation2003; Nair et al., Citation2001). This quality of data enables a greater ability to identify transients, monitoring variations in congestion in time and space. This facilitates ‘early warning signs' of the state change within the system to be detected giving network managers more time to react. In order to apply Chaos Theory to traffic management in urban areas, there is need to explore road traffic's chaotic behaviour in detail. The optimum approach is to focus research on examining complex networks, for example, a group of interconnected urban junctions, such as a SCOOT region, using highly resolved traffic data. The next section suggests that there are now new and enhanced data sources that overcome previous limitations with applications of Chaos Theory to urban networks.
7. New sources of high-resolution traffic data
The key characteristics of traffic behaviour needed to deploy Chaos Theory (e.g. traffic flow and occupancy) can vary over a matter of seconds and within tens of metres across a network. Therefore, to detect these variations, the system must capture relevant data at sufficiently high spatial and temporal resolution to enable an understanding of the prevailing dynamic state and perturbations in traffic on a link, at a given point in time, and the evolution of the resulting congested state in the near and short-term future. Given that low-resolution data fail to preserve the short-term variations in traffic patterns makes the dynamic property of the system unclear; therefore, such data do not adequately support the examination of Chaos Theory. Recent innovation in monitoring technologies (such as pervasive sensors known as Motes and Bluetooth devices along with sophisticated legacy system data sources (such as SCOOT and ANPR)) can generate high resolved (temporal) traffic data over a sufficiently high spatial density. This provides a new stimulus for further research into gaining a better understanding of characteristics of chaos in traffic data to enhance the current automatic management of urban road traffic. Thus, the benefits of integrating diverse data sources within existing urban control systems are that they will serve a dual function of delivering the traffic management and control function as well as providing the data to enable Chaos Theory to report on the more strategic situational state of the urban network in real time (Downes, Rad, & Aghajan, Citation2006). These data sources are now discussed in more detail, in terms of their overall feasibility, and the requirements for high temporal and spatial resolution data.
7.1. Pervasive devices
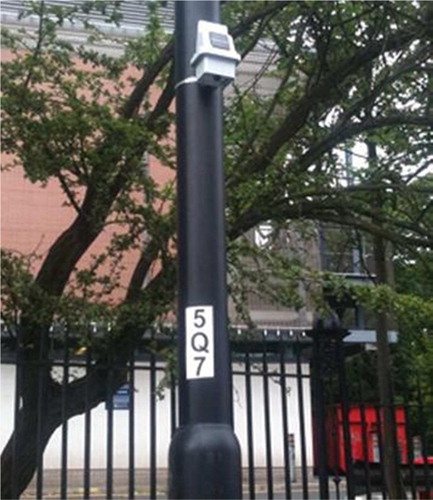
Motes and Bluetooth are relatively inexpensive devices that are easily and flexibly installed with minimal visual intrusion, enabling mass deployment in urban areas at relatively low capital and ongoing maintenance costs. A typical network consists of sensors attached to street furniture, for example, traffic signal poles, lamp columns and railings (). Also, these devices can be programmed to collect traffic and environmental data at any desired level of temporal resolution (including second-by-second).
Figure 3. A typical mote installed on a lamp column.
Motes can be mains or battery-powered, compact and low-cost devices that contain a number of different types of sensors including temperature, humidity, carbon monoxide (CO), nitric oxide (NO), nitrogen dioxide (NO2) and noise that can be programmed to enable continuous monitoring and simultaneous measurement of ambient conditions including vehicle movement and pollution over a networked area (Akyildiz, Su, Sankarasubramaniam, & Cayirci, Citation2002; Bell & Galatioto, Citation2013; Bell, Galatioto, Hill, & Namdeo, Citation2009). Depending on the type of in-built sensor, a mote device can gather traffic information such as traffic flow, lane occupancy and speed when it detects vehicles within its zone of surveillance (Shih et al., Citation2001). The first commercial deployment of the Newcastle MESSAGE mote integrated with SCOOT system was in Medway and Newcastle (). Data are sampled at 5 Hz, and averaged to one minute, and transmitted from sensor to sensor (up to 5 hops) to a gateway which relays data from the whole array (up to 100 sensors) by General Packet Radio Service (GPRS) or LAN/Wi-Fi (North et al., Citation2009).
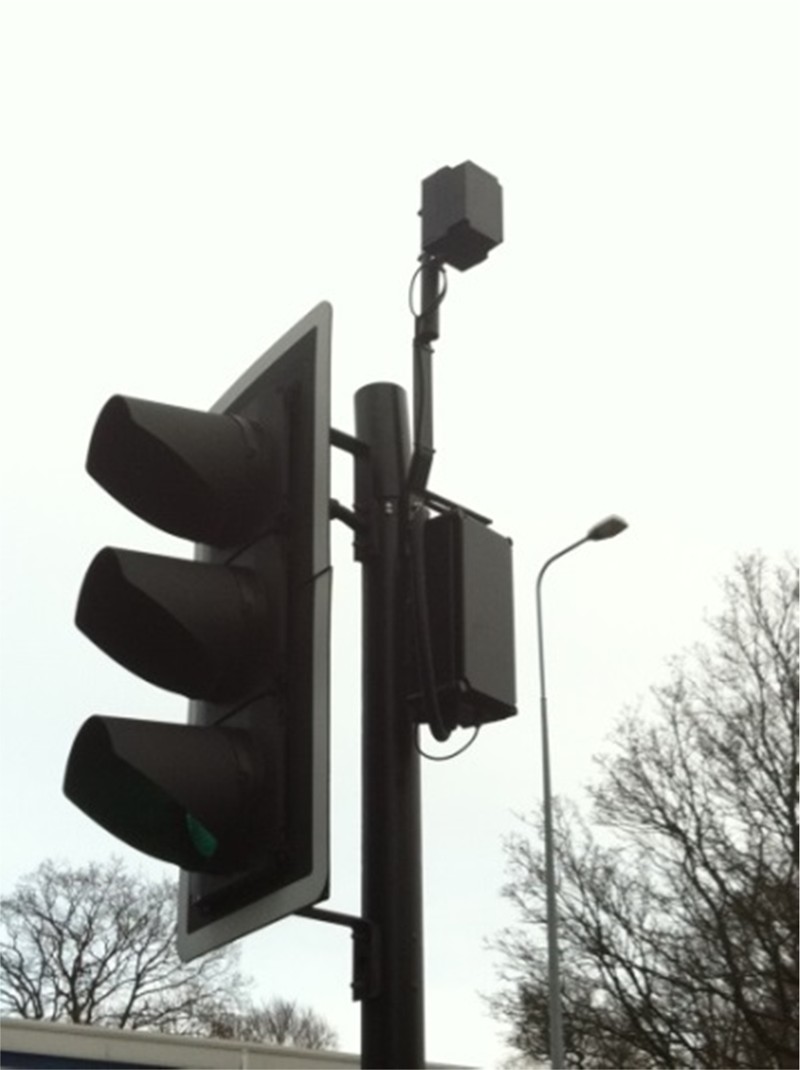
Bluetooth devices use a low-cost transceiver chip to communicate and exchange information with other enabled devices within a global frequency range of 2.45 Hz. shows a typical Hi-Trac® Bluetooth equipment installed on a traffic signal pole. Each device has a unique identification called a MAC (Media Access Control) address, which facilitates the identification of individual vehicles (with an enabled Bluetooth device) passing through the network. Bluetooth scans an enabled in-vehicle device (such as mobile phone, laptop and in-vehicle electronics/engine management systems). When a vehicle passes through the device's detection zone, a data recorder stores the device address and records the data type to the nearest second (Kay & Jackson, Citation2012). Through the matching of MAC addresses at successive detection stations, Bluetooth devices provide a large volume of high-resolution traffic data including traffic volume, occupancy (density), speed and travel time (Blogg, Semler, Hingorani, & Troutbeck, Citation2010). Examples of areas where Bluetooth networks are already deployed for traffic data collection are Queensland (in Australia), Indiana, Pennsylvania and Chicago (in North America), and Altrincham, Manchester, Stockport and Wigan (in England), and Perth and Inverness (in Scotland) (Cragg, Citation2013; Galas, Citation2010).
Figure 4. Typical Bluetooth installed on a traffic signal pole.
Unlike the Motes and Bluetooth detectors, SCOOT and ANPR systems are capital-intensive and not as pervasive (i.e. installations are less frequent) making them less capable of providing high-density spatial data, although they can collect high temporally resolved data.
7.2. SCOOT and ANPR
It must be emphasised here that SCOOT and ANPR systems are not new data sources, but the enhanced ability to analyse the data through increased storage capability and computing power makes them potential sources of data for Chaos Theory. Until recently, SCOOT and ANPR data sets were only available in aggregated form at low-resolution, therefore less suitable for Chaos Theory. Although the raw data are collected in 20-second, 30-second, one- and two-minute intervals, historically, measurements have been aggregated typically in time synchronous intervals of 5 and 15 minutes providing average values for each time period. This procedure reduces the size of the data files for storage in databases (such as ASTRID), thus minimising the required memory and data writing (or retrieval) which can be both expensive and computationally intensive. Once aggregated, any traffic variation within the time interval is lost; therefore, such low-resolution data smoothe the short-term variation in traffic patterns, which ultimately affects the accuracy of short-term forecasts (Zheng & Mcdonald, Citation2007). However, during the past few years, the unprocessed data have started to become available to traffic managers enabling processing to take place at second-by-second intervals. As such, future studies will benefit from data sets whose short-term variations in traffic patterns are known and therefore make possible the opportunity to investigate the underlying non-linear structure available in the detailed measurements. Furthermore, the use of computer technologies such as The Cloud computing system is able to meet the real-time data processing requirements and the computational intensity associated with making these databases more suitable for the Chaos Theory application.
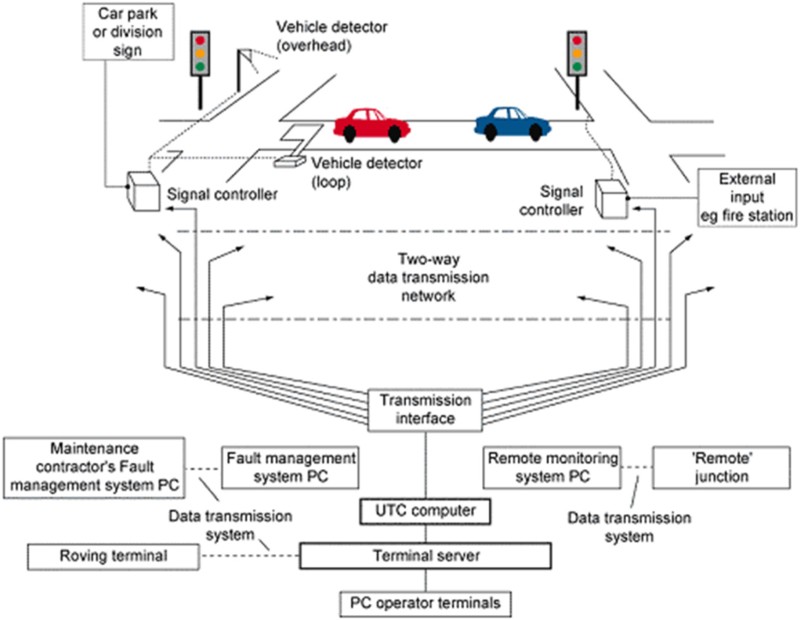
The SCOOT system's layout is shown in . SCOOT is used in signalised urban networks in more than 250 towns and cities worldwide to manage traffic in small areas of the urban network (Transport Research Laboratory, Citation2013). This relatively low number of SCOOT and ANPR networks is due to their large capital cost and does imply that Chaos Theory may be applicable only where high-resolution data are available, but it is unlikely that the data are available at an entire citywide level. On the other hand, the spatial resolution of the data itself could be low depending on the distribution of loop detectors within the network.
Figure 5. The flow of information in a SCOOT-based urban traffic control system.
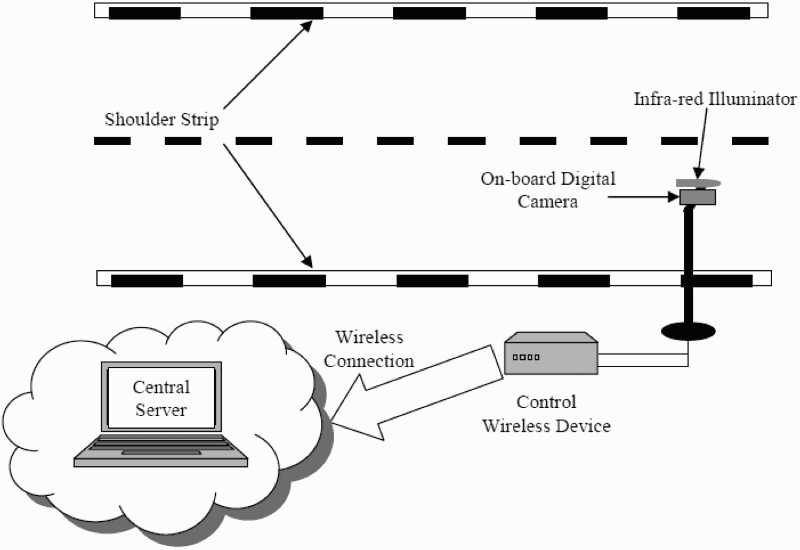
shows the system's layout for ANPR, which provides continuous information from monitoring sites to determine conditions such as flows and journey time on the road network (Hounsell et al., Citation2009). In the UK, a number of regional and national sites (and other local traffic control centres such as the ROMANSE office in Southampton) collate more than six million records of traffic data per day for real-time application (Zheng & Mcdonald, Citation2007). It is possible to process ANPR data at any time resolution and therefore the installed sites could provide high-resolution data. As both SCOOT and ANPR are potential data sources of low spatial density, it will be beneficial combined with Bluetooth and Motes configured to deliver data at appropriate sampling time and at ‘critical locations'. This will enable the problems regarding their network coverage to be resolved for analysing the urban road network using Chaos Theory, provided proxy measures of flow and occupancy can be derived from pollution and noise sensors (Galatioto & Bell, Citation2013). The benefit offered by Chaos Theory is that it can use the wealth of data available as a by-product of existing ITS legacy systems. In an environment of economic restraints, policies of ‘more for less' demonstrating additional spin-off benefits allow local government to justify ongoing maintenance of existing UTMC systems.
Figure 6. The schematic diagram for an ANPR system (Yasin, Karim, & Abdullah, Citation2009).
8. An illustration of using Chaos Theory to detect traffic states
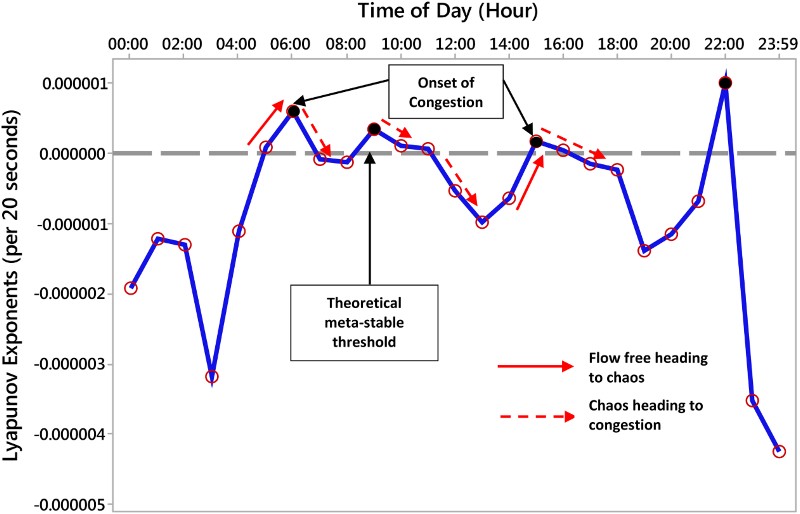
We present in a numerical example of the algorithms of Chaos Theory (Section 4) to demonstrate the potential for Chaos Theory for traffic monitoring applied to a single SCOOT link flow time series data averaged at 20-second intervals for 5 July 1999 from Leicester, UK. Ideally, the region below the Lyapunov exponent of zero (theoretical) reference line indicates that the network is extremely stable (i.e. when the link is free flowing due to low traffic flows or when in a congested state), whilst above the zero threshold indicates unstable states of the link. Therefore, the area below the meta-stable reference line determines the times when the network is less sensitive to perturbations in traffic flow. This is most likely to occur during the overnight period, which is not associated with the onset of prolonged congestion, but can also occur in the following two situations. The first is in free flow conditions when the network control system can respond to the randomness in the traffic arrivals at the stop line, as there is plenty of spare capacity. The second is in the congested state when traffic is generally stationary or very slow moving, in which state the traffic is ‘calmed'. In both of these states, the network is considered to be stable and insensitive, as there are virtually no interactions between vehicles, and the Lyapunov exponent is negative, zero or a small value. The link starts to become sensitive as the degree of interaction between vehicles increases with high positive Lyapunov exponents indicating extreme sensitivity. By observing the time series profile of the Lyapunov exponents, the turning points can reveal the “shoulders of congestion” as a signal of impending congestion to determine when to initiate traffic management plans (Narh, Thorpe, Bell, & Hill, Citation2015).
Figure 7. Typical 24-hour profile of Lyapunov exponents (5 July 1999) for Link 29.
In a real-world application, it is possible that data from a single source will be inadequate for the study of an area-wide network, and therefore supplementing with other data sources may be necessary. As SCOOT and ANPR are capital-intensive and limited to key locations only, pervasive instruments (such as Mote and Bluetooth) may provide additional information, if required. They may also allow existing areas covered by SCOOT and ANPR to operate through a ‘linking deployment' of Motes or Bluetooth sensors. The challenge to the implementation of Chaos Theory is whether these different data sources could easily fuse together through an interoperable system.
In extending the principles of Chaos Theory to real-time applications, a traffic system's chaotic property will need to be determined continuously from the discrete measurement of the dynamic traffic stream variables. Consequently, a further requirement will be an efficient and dynamic means of analysing these variables, for example, through stream processing. Stream processing has the capability to execute data continuously over long periods so long as there is a supply of new data for processing. For example, by constantly analysing the traffic data of network links in space and time, it will be possible through an understanding of the spatial correlation between links to use the Lyapunov exponents to forecast the congested links in real time. This would enable the network manager to implement strategic mitigation plans in advance to avoid or minimise the adverse impacts of congestion. As such, it will be important, therefore, to address any potential memory constraints and computational inefficiencies within a computer system's architecture (Horton & Suh, Citation2005).
9. Conclusions
This paper has identified that current traffic signal control systems perform well in unsaturated and close to saturated traffic conditions, but are unable to handle congested networks due to their inability to detect the onset of congestion and implement effective preventative action. The ability of Chaos Theory to analyse and forecast dynamic systems has been explored, and there is evidence to suggest that this potential can be realised for strategic network-wide control to complement the operation of existing UTC systems, thus improving the effectiveness of managing demand in the urban road network.
Chaos Theory could therefore play a role in delivering a step-change in approach for traffic management, as the debate on how to deliver autonomic properties into traffic control continues to gain momentum amongst academics and traffic practitioners alike. In order to apply Chaos Theory to enhance the understanding of the evolution of the road traffic system, it is important to obtain traffic data that are able to capture the dynamics of how the system is evolving. An essential attribute of such data is that it must be able to preserve the short-term variability in traffic patterns, and data (sub-one minute) must be available at a high level of spatial density.
Previous studies have been limited due to either a lack of sufficiently high-resolution data or confined to relatively simple systems such as motorways and inter-urban links in sparse data environments, or both. However, due to recent developments, new and enhanced data sources such as Motes, Bluetooth, SCOOT and ANPR are now available that should stimulate further research to examine properly the potential for Chaos Theory to help manage the urban road network. Also, it may be envisaged that the UTMC industry will seek to configure their processing to deliver data at higher resolution if it opens up further opportunity for sophistication in congestion management. The numerical example suggests that flow and occupancy 20-second interval data are suitable for understanding chaotic behaviour in urban traffic systems. The suitability of both variables demonstrates that the data source is limited to not only SCOOT but also any system with the capability to provide either flow or link occupancy data.
Currently, network managers aim to optimise a set of parameters and conditions, or continuously learn and apply corrections, to determine the appropriate strategy for managing the transport network and systems. Therefore, incorporating chaos-based algorithms into current systems can be one step towards autonomic applications for traffic systems, which require systems to self-manage their operations with minimal human intervention. Chaos-based algorithms will provide a new and enhanced method for dealing with traffic congestion through an innovative approach that ensures the enactment of appropriate traffic control and management strategies that are ‘one step ahead' rather than ‘one step behind' traffic conditions. Consequently, this will help to minimise delays and improve journey time reliability, as well as alleviate the environmental impacts of congestion. This enhanced approach would be a significant step towards meeting national and international targets for reducing CO2 emissions. Furthermore, it would enable local governments to justify policies for the ongoing maintenance of existing UTMC systems, and investments into the management rather than the expansion of existing network capacity.
Acknowledgement
The authors would like to acknowledge the support of the EPSRC for funding this research and the Instrumented Cities Project in Leicester which made available the traffic data.
Data supporting this publication is not openly available due to commercial considerations. Access may be possible under appropriate agreement. Additional metadata record at 10.17634/154300-10. Please contact Newcastle Research Data Service at HYPERLINK “mailto:[email protected]” [email protected] for further information or access requests.
Disclosure statement
No potential conflict of interest was reported by the authors.
References
- Akyildiz, I. F., Su, W., Sankarasubramaniam, Y., & Cayirci, E. (2002). Wireless sensor networks: A survey. Computer Networks, 38(4), 393–422. doi: 10.1016/S1389-1286(01)00302-4
- Andrews, M. (1996). Introduction to Chaos Theory [Online]. Google. Retrieved December 12, 2012, from http://www.gweep.net/~rocko/sufficiency/node10.html
- Bell, M. C. (1983). A survey of the methods used to define and change signal-plans in the UK (Research Report 50). Newcastle: Transport Operations Research Group.
- Bell, M. C., & Galatioto, F. (2013). Novel wireless pervasive sensor network to improve the understanding of noise in street canyons. Applied Acoustics, 74(1), 169–180. doi: 10.1016/j.apacoust.2012.07.007
- Bell, M. C., Galatioto, F., Hill, G., & Namdeo, A. (2009). Modelling environmental impacts of traffic using a new generation of pervasive sensors. 16th world congress for ITS systems and services. Stockholm: Intelligent Transport Systems.
- Blogg, M., Semler, C., Hingorani, M., & Troutbeck, R. (2010). Travel time and origin-destination data collection using Bluetooth MAC address readers. Australasian transport research forum 2010. Canberra: Australasian Transport Research.
- Bloomberg. (2011). Traffic cost U.S. $114.8 billion in 2009, Texas Institute Says [Online]. Retrieved September 13, 2012, from www.bloomberg.com/news/2011-01-20/traffic-jams-cost-us-114-8-billion-in-time-fuel-in-09-institute-says.html
- Bourner, M. (1984). SCOOT experience in Kent Institution of Electrical Engineers Colloquium Digest No. 1984 (58), London.
- Busch, F. (1996). Traffic telematics in Urban and regional environments inter-traffic conference. Amsterdam: PTRC Education and Research Services Limited.
- Butler, A. (1990). A methodological approach to chaos: Are economists missing the point? Federal Reserve Bank of St. Louis, 72(13), 36–48.
- Centre for Economics and Business Research. (2014). The future economic and environmental cost of gridlock in 2030. An Assessment of the direct and indirect economic and environmental costs of idling in road traffic congestion to households in the UK, France, Germany and the USA. London: Cebr Consultancy.
- Cheslow, M., Hatcher, S. G., & Patel, V. M. (1992). An initial evaluation of alternative intelligent vehicle highway systems architectures. MTR 92W0000063. Bedford, MS: MITRE Corporation.
- Cragg, S. (2013). Bluetooth detection – cheap but challenging. Online. Edinburgh: Transport Scotland.
- Dendrinos, D. S. (1994). Traffic-flow dynamics: A search for chaos. Pergamon: Chaos, Solitons & Fractals, 4(4), 605–617.
- Department for Transport. (1999). The “SCOOT” urban traffic control system. Traffic advisory leaflet, 7(99). London: DfT Publications.
- Department for Transport. (2011). Transport energy and environment statistics 2011. Statistical release. London: DfT Publications.
- Department for Transport. (2013a). Annual road traffic estimates: Great Britain 2012 road traffic statistics statistical release. London: DfT Publications.
- Department for Transport. (2013b). Road length in great Britain: 2012 road length statistics. Statistical release. London: DfT Publications.
- Donati, F., Mauro, V., Roncolini, G., & Vallauri, M. (1984). A hierarchical decentralisated traffic light control system – the first realisation. 9th international FAC world congress, 1984 Budapest. Federation of automotive control.
- Downes, I., Rad, L. B., & Aghajan, H. (2006, March 16). Development of a mote for wireless image sensor networks. Proc. of COGnitive Systems with Interactive Sensors (COGIS). Paris.
- Dreyer, K., & Hickey, F. R. (1991). The route to chaos in a dripping water faucet. American Journal of Physics, 59(7), 619–627. doi: 10.1119/1.16783
- Farges, J., Khoudour, I., & Lesort, J. (1990, May 1). PRODYN: On site evaluation. 3rd international conference on Road Traffic Control 1990 Stevenage. IEE Publications (pp. 62–66).
- Frazier, C., & Kockelman, K. M. (2004). Chaos Theory and transportation systems: An instructive example 83rd annual meeting of the transportation research board. Washington, DC: TRB Publications.
- Galas, J. (2010). Traffic data collection with Bluetooth [Online]. Illinois Department of Transport. Retrieved August 13, 2013, from http://www.conferences.uiuc.edu/traffic/2010PDF/File_10_Galas.pdf
- Galatioto, F., & Bell, M. C. (2013). Exploring the processes governing roadside pollutant concentrations in urban street canyon. Environmental Science and Pollution Research, 20(7), 4750–4765. doi: 10.1007/s11356-012-1428-5
- Gleick, J. (1988). Chaos – making a new science. London: Great Britain William Heinemann.
- Goodwin, P. (2004). The economic costs of road traffic congestion a discussion paper. University College London, London. Retrieved from http://discovery.ucl.ac.uk/1259/1/2004_25.pdf
- Guo, J., Huang, W., & Williams, B. M. (2014). Adaptive Kalman filter approach for stochastic short-term traffic flow rate prediction and uncertainty quantification. Transportation Research Part C: Emerging Technologies, 43(Part 1), 50–64. doi: 10.1016/j.trc.2014.02.006
- Hamilton, A., Waterson, B., Cherret, T. A. R., & Snell, I. (2012). Urban traffic control evolution 44th universities transport studies group conference. Aberdeen: Universities Transport Studies Group.
- Han, C., & Song, S. (2003, October 12–15). A review of some main models for traffic flow forecasting. IEEE international conference on intelligent transport systems, Institute of Electrical and Electronic Engineers, Shanghai (pp. 216–219).
- Horton, M., & Suh, J. (2005, June 12–17). A vision for wireless sensor networks. Microwave symposium digest, 12th-17th June 2005 IEEE MTT-S International, California.
- Hounsell, N. B., & McDonald, M. (2001). Urban network traffic control. Journal of Systems and Control Engineering: Part I Proceedings of the Institution of Mechanical Engineers, 215(4), 325–334.
- Hounsell, N. B., Shrestha, B. P., Piao, J., & McDonald, M. (2009). Review of urban traffic management and the impacts of new vehicle technologies. Intelligent Transport Systems, Institution of Engineering and Technology, 3(4), 419–428. doi: 10.1049/iet-its.2009.0046
- Huang, S., & Sadek, A. W. (2009). A novel forecasting approach inspired by human memory: The example of short-term traffic volume forecasting. Transportation Research Part C: Emerging Technologies, 17(5), 510–525. doi: 10.1016/j.trc.2009.04.006
- Jianming, H., Chunguang, Z., Jingyan, S., Zuo, Z., & Jiangtao, R. (2003). An applicable short-term traffic flow forecasting method based on chaotic theory. IEEE international conference on intelligent transport systems, Institute of Electrical and Electronic Engineers, Shanghai (pp. 608–613).
- Károlyi, G., Pattantyús-Ábrahám, M., & Józsa, J. (2010). Finite-size Lyapunov exponent: A new tool for lake dynamics. Engineering and Computational Mechanics, 163(EM4), 251–259.
- Kay, A., & Jackson, P. (2012, May 12). An appraisal of emerging bluetooth traffic survey technology. Scottish Transport and Applications Research conference, The Lighthouse, Glasgow.
- Kesting, A., & Treiber, M. (2008). How reaction time, update time, and adaptation time influence the stability of traffic flow. Computer-Aided Civil and Infrastructure Engineering, 23(2), 125–137. doi: 10.1111/j.1467-8667.2007.00529.x
- Kirby, H. R., & Smith, M. J. (1991, January). Can chaos theories have transport applications? 23rd Universities Transport Studies Group conference, Universities Transport Studies Group, Nottingham.
- Krese, B., & Govekar, E. (2013). Analysis of traffic dynamics on a ring road-based transportation network by means of 0–1 test for chaos and Lyapunov spectrum. Transportation Research Part C: Emerging Technologies, 36, 27–34. doi: 10.1016/j.trc.2013.08.001
- Lan, L. W., Lin, F. Y., & Kuo, A. Y. (2003). Testing and prediction of traffic flow dynamics with chaos. Journal of the Eastern Asia Society for Transport Studies, 5, 1975–1990.
- Lee, J. F. J., Kwok, P. K., & Williams, J. (2014). Heterogeneity among motorists in traffic-congested areas in Southern California. Transportation Research Part A: Policy and Practice, 70, 281–293.
- Lorenz, E. N. (1993). The essence of chaos. London: UCL Press.
- Lowrie, P. R. (1982, March 30–April 1). The Sydney co-ordinated adaptive traffic system: Principles, methodology, algorithms. IEE international conference on Road Traffic Signalling, Institution of Electrical Engineers, London.
- Mandelbrot, B. B. (1983). The fractal geometry of nature. New York, NY: W. H. Freeman and Company.
- Manley, E., & Cheng, T. (2010, April 6–9). Understanding road congestion as an emergent property of traffic networks. International multiconference on Complexity, Informatics and Cybernetics, Orlando (pp. 109–114).
- Meehan, D. (2003). We know it's good, but just how good is it? Traffic Engineering and Control, 44(8), 295–298.
- Mirchandani, P., & Head, L. (2001). A real-time traffic signal control system: Architecture, algorithms, and analysis. Transportation Research Part C: Emerging Technologies, 9(6), 415–432. doi: 10.1016/S0968-090X(00)00047-4
- Nair, A. S., Liu, J. C., Rilett, L., & Gupta, S. (26–29 August 2001). Non-linear analysis of traffic flow. IEEE intelligent transportation systems conference, Institution of Electric and Electronic Engineers, Oakland, CA.
- Narh, A. T., Thorpe, N., Bell, M. C., & Hill, G. A. (2014). Using Chaos Theory to examine the dynamical states of road traffic in signalised urban networks. 46th Universities Transport Studies Group. Newcastle upon Tyne: Universities Transport Studies Group.
- Narh, A. T., Thorpe, N., Bell, M. C., & Hill, G. A. (2015). Can Chaos Theory be used to manage traffic in signalised urban networks. 47th Universities Transport Studies Group. London: Universities Transport Studies Group.
- North, R., Cohen, J., Wilkins, S., Richards, M., Hoose, N., Polak, J., … Hill, G. (2009). Field deployments of the MESSAGE system for environmental monitoring. Traffic Engineering and Control, 50(11), 484–488.
- O'Flaherty, C. A. (2005). Traffic planning strategies. In C. A. O'Flaherty (Ed.), Transport planning and traffic engineering, (pp. 132–153). Oxford: Butterworth-Heinemann.
- Ortuzar, J. D. D., & Willumsen, L. G. (2006). Assignment modelling transport (3rd ed.). London: John Wiley & Sons.
- Papageorgiou, M., Diakaki, C., Dinopoulou, V., Kotsialos, A., & Yibing, W. (2003). Review of road traffic control strategies. Proceedings of Insitution of Electrical and Electronic Engineers, 91(12), 2043–2067. doi: 10.1109/JPROC.2003.819610
- Qi, Y., & Ishak, S. (2014). A hidden Markov model for short term prediction of traffic conditions on freeways. Transportation Research Part C: Emerging Technologies, 43(Part 1), 95–111. doi: 10.1016/j.trc.2014.02.007
- Safanov, L. A., Tomer, E., Strygin, V. V., Ashkenazy, Y., & Havlin, S. (2002). Delayed-induced chaos with multi-fractal attractor in a traffic flow model. Europhysics Letters, 57, 151–157. doi: 10.1209/epl/i2002-00555-0
- Sessler, P. (2007). Traffic on the roads and links to the Chaos Theory [Online]. Helium. Retrieved October 16, 2012, from http://www.helium.com/items/717680-traffic-on-the-roads-and-links-to-the-chaos-theory.
- Shang, P., Wan, M., & Kama, S. (2007). Fractal nature of highway traffic data. Computers and Mathematics with Applications, 54, 107–116. doi: 10.1016/j.camwa.2006.07.017
- Shih, E., Cho, S. H., Ickes, N., Min, R., Sinha, A., Wang, A., & Chandrakasan, A. (2001, August 16–21). Physical layer driven protocol and algorithm design for energy-efficient wireless sensor networks. 7th annual international conference on mobile computing and networking, Association of Computing Machinery, Rome (pp. 272–287).
- Shirer, H. N., Fosmire, C. J., Wells, R., & Suciu, L. (1997). Estimating the correlation dimension of atmospheric time series. Journal of the Atmospheric Sciences, 54(1), 211–230. doi: 10.1175/1520-0469(1997)054<0211:ETCDOA>2.0.CO;2
- Simmonite, B. (2005). An introduction to traffic signals. Bristol: JCT Consultancy.
- Sipress, A. (1999, August 5). Lab studying science behind traffic patterns. Washington Post.
- Takens, F. (1981). Detecting strange attractors in turbulence. Dynamic Systems and Turbulence: Lecture Notes in Mathematics, 898, 366–81.
- The Smith Group. (1999). Clearing the way – practical solutions for urban road user charging. London: Author.
- Transport Research Laboratory. (2013). SCOOT. Split cycle offset optimisation technique. Wokingham: Transport Research Laboratory.
- Uittenbogaard, A. (2011). Chaos Theory for beginners [Online]. Retrieved December 12, 2012, from http://www.abarim-publications.com/ChaosTheoryIntroduction.html
- US Census Bureau. (2005). Trends in vehicle miles travelled [Online]. Retrieved September 9, 2012, from www.pewclimate.org/global-warming-basics/facts_and_figures/us_emissions/vmt.cfm
- Vlahogianni, E. I., Karlaftis, M. G., & Golias, J. C. (2005). Optimized and meta-optimized neural networks for short-term traffic flow prediction: A genetic approach. Transportation Research Part C: Emerging Technologies, 13(3), 211–234. doi: 10.1016/j.trc.2005.04.007
- Wang, J., Shi, Q., & Lu, H. (2005, June 6–8). The study of short term traffic flow forecasting based on theory of chaos. Intelligent vehicles symposium, Institute of Electrical and Electronic Engineers, Nevada, USA.
- Xu, M., & Gao, Z. (2008). Nonlinear analysis of road traffic flows in discrete dynamical system. Journal of Computational and Nonlinear Dynamics, 3(2), 0212061–0212066. doi: 10.1115/1.2833905
- Xue, J., & Shi, Z. (2008). Short-time traffic flow prediction based on chaos time series theory. Journal of Transportation Systems Engineering and Information Technology, 8(5), 68–72. doi: 10.1016/S1570-6672(08)60040-9
- Yasin, A. M., Karim, M. R., & Abdullah, A. S. (2009). Travel time measurement in real-time using automatic number plate recognition for Malaysian environment. Journal of the Eastern Asian Society for Transportation Studies, 8, 1738–1751.
- Zhang, G., Patuwo, B. E., & Hu, M. Y. (1998). Forecasting with artificial neural networks: The state of art. International Journal of Forecasting, 14, 35–62. doi: 10.1016/S0169-2070(97)00044-7
- Zhang, J., & Liu, J. (2007, August 18–21). Non-linear characteristics of short-term traffic flow and their influences to forecasting. IEEE international conference on Automation and Logistics, Institute of Electrical and Electronic Engineers, Jinan (pp. 847–851).
- Zheng, P., & McDonald, M. (2007). Optimal traffic data archive scheme. Intelligent Transport Systems, IET, 1(20), 144–149. doi: 10.1049/iet-its:20060082
- Zhu, C., Xu, X., & Yan, C. (2010, December 4–6). The research of method of short-term traffic flow forecast based on GA-BP neural network and Chaos Theory. 2nd International Conference on Information Science and Engineering (ICISE), Institute of Electrical and Electronic Engineers, Hangzhou (pp. 1617–1620).