
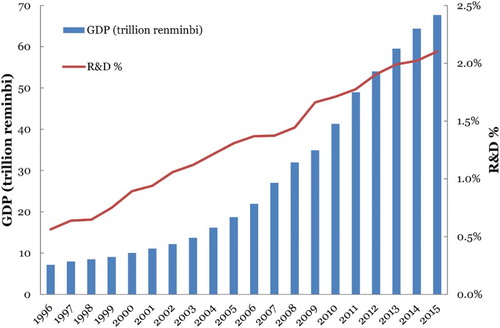
China’s economy has improved dramatically over the past two decades, from a gross domestic product (GDP) of RMB7 trillion (around USD1 trillion) in 1996 to RMB68 trillion (around USD10 trillion) in 2015, representing an almost 10-fold increase in two decades (National Bureau of Statistics of China, Citation1996–Citation2015). This level of growth is unprecedented in the history of mankind. Over the same period, the percentage of GDP devoted to research and development (R&D%) increased from 0.6% to 2.1%, representing a fourfold increase (National Bureau of Statistics of China, Citation1996–Citation2015). shows the trends of both GDP and R&D% over the past 20 years. Although the growth in GDP has slowed down slightly in recent years, the R&D% continues to grow steadily, representing a 9.3% increase in R&D funding, from RMB1.30 trillion in 2014 to RMB1.42 trillion in 2015. These figures indicate the Chinese government’s strong commitment to R&D, despite the challenges in sustaining high economic growth.
Figure 1. China’s GDP and percentage of GDP devoted to R&D 1996–2015.
With an annual investment of over RMB1 trillion (around USD150 billion) in R&D in recent years, China is now considered a major contributor to science and technology in the world. However, China still faces various challenges (Xie, Zhang, & Lai, Citation2014). For example, the amount of R&D funding allocated to basic research, which is about 5% of the total R&D fund, is still far below that of the most developed countries at 15–25% (Qiu, Citation2012). Moreover, it has been observed that R&D in China is heavily science based (Editorial, Citation2010). There has also been speculation about the short- to medium-term growth of China’s general research strengths (Casassus, Citation2014; Yang, Citation2015; Zhou, Citation2015). For the benefit of the Transport Reviews readership, this Editorial reviews the current situation in transport research, and considers whether it exhibits the same trend and pattern as those in the wider research community.
In this Editorial, I analyse China’s transport research progress over the past two decades, based on the Web of Science (WoS) database published by Thomson Reuters.Footnote1 Despite criticism of the metrics, such as the impact factor, produced by this database (Banister, Citation2015), the aggregate information generated can still provide a rough indication of the status of research in the transport research community. Although there are numerous important publication outlets that are not listed in WoS, the data extracted from this database still serve as a good, representative sample of essential research outputs. In the following, I examine variations in publications, impact, sources of support and subjects based on the WoS database.
Publications
To sample the list of transport-related journals, I consider two categories in Thomson Reuters’ Journal Citation Reports: “Transportation Science and Technology” in the Science Edition (SE), and “Transportation” in the Social Science Edition (SSE) in 2015 (see the full list of 54 selected journalsFootnote2). This is by no means exhaustive, but it serves as a representative sample of research publications in the transport field. shows the numbers of annual publications in these 54 journals in the past 2 decades. Due to the increasing size of established journals, and the launching of some of these journals during the census period, there has been a steady organic growth in publication outputs in the past 20 years. More than 56,000 articles were published from 1996 to 2015. It is interesting to note that the increase in the first decade from 1996 to 2005 is quite steady from 1 to 2 thousand papers per year, whereas the increase in the second decade from 2006 to 2015 is more rapid from 2 to 6 thousand papers per year, which may be attributable to the recent technological advancements, such as Internet and other communication means. shows the geographical distribution of these publications.
Figure 2. Trends of the number of publications and the market shares of China and the USA from 1996 to 2015.
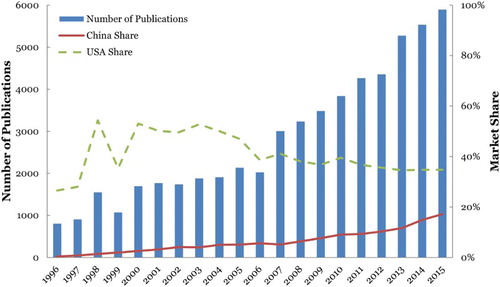
Table 1. Geographical distribution of publications from 1996 to 2015.
The USA is ranked first, with the greatest market share of 39.6%, followed by China with a share of 8.6%. To neutralise the effect of organic growth in publications, I compare the market share of publications, rather than the actual number of publications, between China and the USA. The USA was chosen for comparison because it has the greatest market share, reflecting the global dominance of its research strength, and is thus a representative country reflecting the world trend. Further, the WoS version that my institution subscribes to has a limitation on the number of records that can be analysed. The trends of the market shares of China and the USA are illustrated in .Footnote3 The USA share went up and down in the first 10 years, but has remained quite steady at around 40% of all publications in recent years. During the same period, China’s share increased tremendously, from less than 1% in 1996 to 17.2% in 2015. In the past decade (2006–2015), China’s market share has increased rapidly at a rate of almost 1.3% per annum, from a share of 5.6% in 2006 to 17.2% in 2015, which is an extraordinary achievement in a rapidly expanding market. Nevertheless, despite the speculation that China would overtake the USA in terms of R&D spending by 2020 (Casassus, Citation2014), it is apparent that it will take somewhat longer for research outputs to catch up, at least in the discipline of transport research, if the trend prevails.
Impact
It is extremely difficult, if not impossible, to analyse the impact of research outputs. Citation records are generally considered a reasonable proxy in the academic community, although it is also argued that this method is agnostic and needs to be interpreted cautiously. Nevertheless, citation information may still serve as an indicator of works that are relevant and worth acknowledging when researchers are pursuing similar topics of research. Moreover, I use a highly aggregate approach in this Editorial, which will hopefully reduce the irrational effects of awkward cases. As shown in , the research environments in China and the USA were completely different 20 years ago; the USA had already reached a mature status, whereas China was still in the early stage of building its research strengths. Therefore, I choose the past five years of citation records to illustrate the differences between China and the USA; the research environments in this census period are similar, and it is sufficiently long to reduce short-term fluctuations.
shows the citation records from 2011 to 2015. At first glance, China has a higher number of citations per publication (4.8) than the USA (4.0). However, it is also worth noting that 51% of China’s citations are own-country citations, compared with 40% for the USA. This indicates that for those citations to papers with an author from China, 51% of them are from papers with an author from China, and 49% are from papers without any author from China. This distinction is useful in differentiating the endogenous and exogenous impacts of a research output. Based on these percentages, I further divide the citation records into the number of citations from the same country per publication, which indicates the endogenous impact – the influence of a research output on researchers from the same country; and the number of citations from outside of the country per publication, which indicates the exogenous impact – the influence of a research output to researchers elsewhere. shows that the exogenous impacts of China (2.3) and the USA (2.4) are very similar, which seems to indicate that they have a similar level of influence on the international research community. However, China has a much higher endogenous impact (2.5) than the USA (1.6). It appears that China’s research community tends to recognise the work of other researchers within their own community. The probable reason may be that many researchers are concentrated on a relatively small subset of transport problems and technologies in a highly strategic manner within China, governed by a top-down approach that aims to guide the R&D pathways to tackle more focused and localised areas of interest in China. For example, China’s academic papers may concentrate on unique transport problems in China, such as high-density urbanisation and mass movements of people and goods. These works, therefore, draw greater attention from the same research community in China than elsewhere. This is also reflected in China’s highly strategic funding sources, as discussed in the next section. To the contrary, the R&D environment in the USA apparently has a more diverse range of interests in the context of transport research.
Table 2. Citation records 2011–2015.
Support
Although over RMB1 trillion is spent on R&D, it is unclear how much of this amount is related to the transport sector. An indirect method of revealing funding support is to look at the funding acknowledgements of research publications. shows the top 10 funding sources acknowledged in publications in the past 5 years (2011–2015). The reasons for choosing this period are similar to those in the analysis of citation records.
Table 3. Top 10 funding sources acknowledged in publications 2011–2015.
Three of the top 10 funding sources are from China: the National Natural Science Foundation of China, or a slight variation, the National Science Foundation of China (NSFC); the Fundamental Research Funds for the Central Universities (FRFCU); and the National Basic Research Program of China (NBRPC). While China’s publications comprise only 13% of all research outputs in this 5-year period, these 3 China funding sources account for 6.5% of all funded publications in the top 10 positions. This may indicate that the funding provision in China is more concentrated in a few key large funding agencies than in other jurisdictions, particularly those with a more mature research environment (for example, the other 7 funding sources in the USA, Canada and the European Union account for only 4.2% of all funded publications in the top 10 positions).
Subject variations
Thomson Reuters produces two major Journal Citation Reports, the Science Edition (SE) and the Social Science Edition (SSE). The most relevant categories are “Transportation Science and Technology” in the SE and “Transportation” in the SSE. Journals are grouped under these two editions according to their aims, scope and publication records. Generally, the SE includes journals focusing on the hardcore of science and technology, whereas the SSE journals focus on the social, humanistic and cultural aspects of transport research. Some journals that publish both types of articles are covered in both editions. However, this is a very crude classification, as there are cases that may not fit well with this classification framework. Nonetheless, the data still provide some indicative patterns about the R&D outputs in these two broad-brush categories of subjects, that is, the SE for science- and technology-based research subjects, and the SSE for social-, humanistic- and cultural-based research subjects.
As some journals are included in both editions, and it is extremely difficult (if not impossible) to identify individually the distribution of articles in these two broad categories of subjects, these journals are excluded from the analysis. There are 23 and 22 journals selected for the SE and SSE, as listed in,Footnote4, Footnote5 respectively.
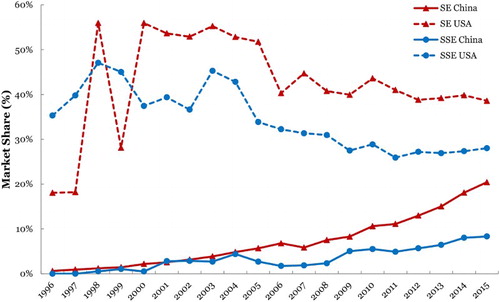
shows the publication trends of SE and SSE subjects. The USA still dominates with high market shares in both subjects; these shares fluctuate at the beginning of the analysis period but become steady in later years. In 2015, the USA market shares of SE and SSE subjects were 39% and 28%, respectively. China has caught up rapidly in both subjects, but the market share in SE subjects clearly increased more than that of SSE subjects. In 2015, China’s SE market share was 20%, about half that of the USA, whereas China’s SSE market share at only 8% was far behind the USA. Moreover, in the past 10 years, China’s SE market share has increased at an extraordinary rate of 1.6% per annum on average, whereas the SSE market share, while still promising, increased at only half this rate, 0.8%. If these trends prevail, China’s transport science and technology research will continue to improve more rapidly than the social or soft aspects of transport research. This observation echoes a previous Editorial (Citation2010), which noted that China has focused heavily on science-based R&D in recent years. Although the social or soft aspects of transport research seem to be lagging behind, the annual increase of 0.8% in market share is still incredible by world standards.
Figure 3. The SE and SSE market share trends of China and the USA from 1996 to 2015.
Using the same approach as for the impact analysis, compares the results between SE and SSE subjects. The citation pattern of SE subjects is very similar to that of the overall pattern in the foregoing discussion, with China’s endogenous impact much higher than that of the USA. However, this difference is not observed for SSE subjects, probably because the soft aspects of transport research are similarly concerned with human nature, and the interests are more diverse across jurisdictions. For SE subjects, the resources may be channelled to deal with more focused and localised areas of interest in a strategic manner, thus attracting more researchers to trace funding opportunities on similar topics.
Table 4. SE and SSE citation records from 2011 to 2015.
The heavy investment in science-based R&D is also revealed by the distributions of the top 10 funding sources in SE and SSE subjects in . The pattern for the SE is very similar to the overall funding situation in , in which 3 of 10 funding sources are from China. However, for the SSE, the NSFC is the only funding source in the top 10. Furthermore, the three funding sources, the NSFC, FRFCU and NBRPC, are acknowledged in 9.1% of all SE publications in 2011–2015, whereas for the SSE the NSFC is acknowledged in only 0.7% of all SSE publications, among the top 10 positions shown in . The lower research input to SSE subjects possibly explains why the growth of SSE publications has fallen behind that of SE publications, as shown in .
Table 5. Top 10 funding sources acknowledged in SE and SSE publications from 2011 to 2015.
This Editorial attempts to analyse the publication, impact, support and subject variations of R&D efforts in China based on Thomson Reuters’ WoS database, using the USA as a reference country to benchmark the progress and status of China’s R&D achievements. In response to the significant increase in R&D input in the past two decades, China’s R&D output in transport research shows a correspondingly astonishing improvement. China’s market share has grown from an almost invisible level 20 years ago to a 17.2% share last year, with an extraordinary 1.3% annual increase in the market share of publications. These figures indicate that China is a power engine fuelling the knowledge growth in transport R&D.
In terms of impact, the citation records of China’s publication are on a par with those in developed economies such as the USA. However, it is interesting to observe that China seems to have a higher endogenous impact than the mature research community. The analysis indicates that this phenomenon is mainly due to science-based research. It is also apparent that the support for China’s R&D comes from a few major strategic sources. Compared with transport science and technology-based research, research on the social or soft aspects is lagging behind in China notwithstanding the remarkable achievements in the past two decades. As the hard and soft sides of R&D are equally important in advancing the understanding, knowledge and know-how needed to improve transport systems, there seems to be room for improvement in supporting and promoting social, humanistic and cultural aspects of transport research in China.
The analyses in this Editorial are very crude due to the limited information and resources, and thus the results and findings need to be interpreted with caution. Nevertheless, I do hope that this piece of preliminary work will encourage a few observations and questions that warrant further investigations, such as the sustainability of the market share increase, the relatively high endogenous impact compared with more mature economies, the R&D funding strategies and the subject variations in China’s transport research development. Moreover, in the absence of data and information, many of the arguments in this Editorial are only speculative, and represent my subjective views on the analysis results. Therefore, this Editorial proposes hypotheses that may be either proved or disproved through more in-depth studies. Nonetheless, it is an indisputable fact that China’s transport-related R&D has risen significantly in the past two decades, and it is apparent that this momentum will continue provided that the improving research environment prevails.
Notes
1. The data extracted from the WoS database were accessed at different times from June to August 2016.
2. All 54 selected journals: “Accident Analysis and Prevention”, “Computer-aided Civil and Infrastructure Engineering”, “European Journal of Transport and Infrastructure Research”, “IEEE Intelligent Transportation Systems Magazine”, “IEEE Transactions on Intelligent Transportation Systems”, “IEEE Transactions on Vehicular Technology”, “IEEE Vehicular Technology Magazine”, “IET Intelligent Transport Systems”, “International Journal of Automotive Technology”, “International Journal of Engine Research”, “International Journal of Heavy Vehicle Systems”, “International Journal of Shipping and Transport Logistics”, “International Journal of Sustainable Transportation”, “International Journal of Transport Economics”, “International Journal of Vehicle Design”, “ITE Journal-Institute of Transportation Engineers”, “Journal of Advanced Transportation”, “Journal of Air Transport Management”, “Journal of Intelligent Transportation Systems”, “Journal of Public Transportation”, “Journal of Safety Research”, “Journal of Transport & Health”, “Journal of Transport and Land Use”, “Journal of Transport Economics and Policy”, “Journal of Transport Geography”, “Journal of Transportation Engineering”, “Maritime Economics & Logistics”, “Maritime Policy & Management”, “Mobilities”, “Networks & Spatial Economics”, “Proceedings of the Institution of Civil Engineers-Transport”, “Proceedings of the Institution of Mechanical Engineers Part D – Journal of Automobile Engineering”, “Proceedings of the Institution of Mechanical Engineers Part F-Journal of Rail and Rapid Transit”, “Promet-Traffic & Transportation”, “Research in Transportation Economics”, “Road & Transport Research”, “Traffic Injury Prevention”, “Transport Policy”, “Transport Reviews”, “Transport”, “Transportation Journal”, “Transportation Letters – The International Journal of Transportation Research”, “Transportation Planning and Technology”, “Transportation Research Part A – Policy and Practice”, “Transportation Research Part B – Methodological”, “Transportation Research Part C – Emerging Technologies”, “Transportation Research Part D – Transport and Environment”, “Transportation Research Part E – Logistics and Transportation Review”, “Transportation Research Part F – Traffic Psychology and Behaviour”, “Transportation Research Record”, “Transportation Science”, “Transportation”, “Transportmetrica A – Transport Science”, “Transportmetrica B – Transport Dynamics”.
3. The extraction of data is based on the address field in the WoS database using “China” and “USA”. This is a rough analysis because it does not take into account the collaborative efforts between China and the USA, and between these countries and other jurisdictions. Nevertheless, the trend obtained from this analysis may still help illustrate temporal and geographical changes.
4. 23 SE journals: “Computer-Aided Civil and Infrastructure Engineering”, “IEEE Intelligent Transportation Systems Magazine”, “IEEE Transactions on Intelligent Transportation Systems”, “IEEE Transactions on Vehicular Technology”, “IEEE Vehicular Technology Magazine”, “IET Intelligent Transport Systems”, “International Journal of Automotive Technology”, “International Journal of Engine Research”, “International Journal of Heavy Vehicle Systems”, “International Journal of Vehicle Design”, “ITE Journal – Institute of Transportation Engineers”, “Journal of Advanced Transportation”, “Journal of Intelligent Transportation Systems”, “Journal of Transportation Engineering”, “Networks & Spatial Economics”, “Proceedings of the Institution of Civil Engineers – Transport”, “Proceedings of the Institution of Mechanical Engineers Part D – Journal of Automobile Engineering”, “Proceedings of the Institution of Mechanical Engineers Part F – Journal of Rail and Rapid Transit”, “Promet-traffic & Transportation”, “Transport”, “Transportation Planning and Technology”, “Transportation Research Part C – Emerging Technologies”, “Transportation Research Record”.
5. 22 SSE Journals: “Accident Analysis and Prevention”, “European Journal of Transport and Infrastructure Research”, “International Journal of Shipping and Transport Logistics”, “International Journal of Sustainable Transportation”, “International Journal of Transport Economics”, “Journal of Air Transport Management”, “Journal of Public Transportation”, “Journal of Safety Research”, “Journal of Transport & Health”, “Journal of Transport and Land Use”, “Journal of Transport Economics and Policy”, “Journal of Transport Geography”, “Maritime Economics & Logistics”, “Maritime Policy & Management”, “Mobilities”, “Research in Transportation Economics”, “Road & Transport Research”, “Traffic Injury Prevention”, “Transport Policy”, “Transport Reviews”, “Transportation Journal”, “Transportation Research Part F – Traffic Psychology and Behaviour”.
References
- Banister, D. (2015). Journal impact factors and paper citations. Transport Reviews, 35(6), 675–678. doi: 10.1080/01441647.2015.1090775
- Casassus, B. (2014). China predicted to outspend the US on science by 2020. Nature News. doi:10.1038/nature.2014.16329. Retrieved from http://www.nature.com/news/china-predicted-to-outspend-the-us-on-science-by-2020–1.16329
- Editorial. (2010). China: A life science giant. Nature Reviews Microbiology, 8, 310. doi: 10.1038/nrmicro2364
- National Bureau of Statistics of China. (1996–2015). National Data, People’s Republic of China. Retrieved from http://data.stats.gov.cn/index.htm
- Qiu, J. (2012). China’s budget backs science. Nature, 483, 258. doi: 10.1038/483258a
- Xie, Y., Zhang, C., Lai, Q. (2014). China’s rise as a major contributor to science and technology. Proceedings of the National Academy of Sciences of the United States of America, 111(26), 9437–9442. doi: 10.1073/pnas.1407709111
- Yang, B. (2015). China rising. Nature Jobs Career Guide, Asia Pacific, 524, S8.
- Zhou, Y. (2015). The rapid rise of a research nation. Nature Index, China, 528, S170–S173.