
ABSTRACT
Surrogate indicators are meant to be alternatives or complements of safety analyses based on accident records. These indicators are used to study critical traffic events that occur more frequently, making such incidents easier to analyse. This article provides an overview of existing surrogate indicators and specifically focuses on their merit for the analyses of vulnerable road users and the extent to which they have been validated by previous research. Each indicator is evaluated based on its ability to consider the collision risk, which can be further divided into the initial conditions of an event, the magnitude of any evasive action and the injury risk in any traffic event. The results show that various indicators and their combinations can reflect different aspects of any traffic event. However, no existing indicator seems to capture all aspects. Various studies have also focused on the validity of different indicators. However, due to the use of diverse approaches to validation, the large difference in how many locations were investigated and variations in the duration of observation at each location, it is difficult to compare and discuss the validity of the different surrogate safety indicators. Since no current indicator can properly reflect all the important aspects underlined in this article, the authors suggest that the choice of a suitable indicator in future surrogate safety studies should be made with considerations of the context-dependent suitability of the respective indicator.
Introduction
Accident analysis is the most direct and common method of evaluating traffic safety, but it has at least two limitations. First, the relative rarity and randomness of accidents make them difficult to study without a significant amount of historical data (Elvik, Citation1988, Citation2009). Second, not all accidents are reported, and the level of underreporting depends on the severity of the accidents and the type of road users involved (Elvik & Mysen, Citation1999; Hauer & Hakkert, Citation1988). The latter limitation is particularly a problem for vulnerable road users (VRUs; Alsop & Langley, Citation2001; Amoros, Martin, & Laumon, Citation2006; Elvik, Høye, Vaa, & Sørensen, Citation2009; Englund, Gregersen, Hydén, Lövsund, & Åberg, Citation1998). For these reasons, surrogate safety indicators can be used as alternative or complementary methods of identifying safety issues.
The term surrogate implies that the indicators do not rely on accident data. Instead, they are meant to be alternatives or complements of analyses based on accident records. Throughout the 1970s and the 1980s, many different indicators were developed and frequently used. Lately, more indicators have been suggested and used, focusing on VRUs, perhaps caused by the problem of underreporting of VRU accidents and an increased interest in travel modes involving VRUs.
Earlier large-scale reviews about the usage of surrogate safety indicators as a method (Chin & Quek, Citation1997; Zheng, Ismail, & Meng, Citation2014c) provide a good overview of theoretical considerations, such as reliability and validity, as well as discussing observation methods, such as the use of human observers compared to the video analysis-based system. This article builds on a third review by Laureshyn et al. (Citation2016), further concentrating on the applicability of surrogate safety indicators for studies on VRUs, defined here as pedestrians and bicyclists.
Surrogate indicators of safety from a theoretical perspective
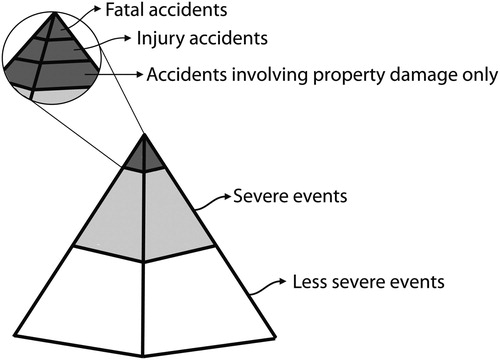
The basic concept of surrogate safety indicators assumes that all traffic events involving nearness of some kind between two or more road users are related to safety. These events differ in their degree of severity (unsafety), and a relationship exists between the severity and the frequency of events (Hydén, Citation1987). If this relation is known, it is theoretically possible to calculate the frequency of the very severe but infrequent events (accidents) based on the known frequency of the less severe but more frequently occurring events (Svensson & Hydén, Citation2006). illustrates this relationship where fatal accidents are regarded as the most severe events.
Figure 1. Severity levels of traffic events. Adapted from Hydén (Citation1987) and Svensson (Citation1998).
A more thorough discussion concerning severity was presented by Laureshyn, Svensson, and Hydén (Citation2010), who suggested that the concept of severity of an event could be divided into two categories – collision risk and injury risk of an event – and that severity could be estimated by combining these two aspects. This division makes it possible to differentiate between the factors affecting collision risk and those influencing injury risk as shown in (Svensson, Citation1998).
Table 1. Factors affecting collision risk and injury risk, respectively.
The above framework is a common approach used to present the concept of surrogate indicators. However, Davis, Hourdos, Xiong, and Chatterjee (Citation2011) suggested a different model to understand the relation between traffic events and accidents. Their model () outlines that the probability for each traffic event to develop into an accident depends on two inputs.
Figure 2. Causal model. Adopted from Davis et al. (Citation2011).
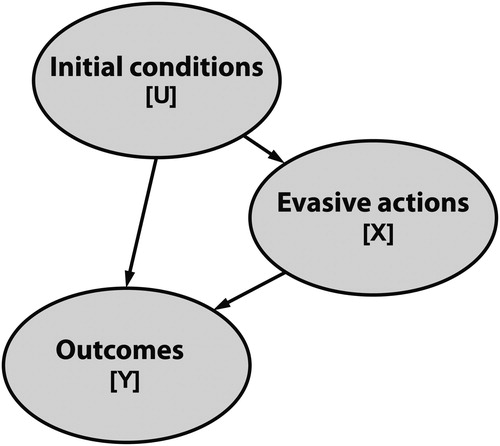
A set of initial conditions [U] defines a set of evasive actions [X] and their respective probabilities. The final outcome [Y] is then a probabilistic function of both the initial conditions and the evasive actions. A critical event denotes a set of initial conditions in which the final probability of a crash is above zero. Indicators that measure the initial conditions identify critical events based on the closeness of the involved road users, using metrics such as the physical distance between road users or the time separating two road users. Indicators that measure evasive actions identify critical events based on the magnitude of any evasive action, using metrics such as braking, running or swerving (Davis et al., Citation2011).
A surrogate safety indicator should ideally reflect both aspects of the model to accurately estimate a collision risk. It means that critical events are identified in several steps. The first is by estimating the severity of the initial conditions or the closeness to the accident. The second is by assessing the effectiveness of any potential evasive action of the involved road users based on the initial conditions. Finally, these aspects are combined into a final estimation of the collision risk in a certain traffic event.
Requirements for “ideal” surrogate safety indicators
Surrogate indicators can be used in various settings involving different road users and types of infrastructure. However, not all indicators are necessarily equally suitable for all kinds of settings and events. Three main aspects of a surrogate safety indicator can be used to discuss the suitability of different indicators in various settings. First, a surrogate safety indicator should include the theoretical aspects important for different settings. Second, it should have robust validity and third, reliability.
Following the theoretical perspective, the severity of an event can be estimated with a combination of injury risk and collision risk. A collision risk can be further reduced into a combination of initial conditions and evasive actions, meaning that the collision risk can be estimated using either or both aspects. An indicator should preferably reflect both parts of a collision risk, as well as of an injury risk in all settings where the indicators are being used. For example, an indicator that is used to study VRUs’ safety should be able to consider the nearness of the road users, the potential evasive actions (such as braking, stopping or swerving) of the involved road users and the fragile nature of the VRUs.
A surrogate safety indicator should also have robust validity. As defined in this article, validity measures the consistency of the relation between critical events and accidents. Several approaches have been used to validate surrogate indicators, which can be divided into two main categories – product validation and process validation.
Product validation focuses on the correlation between critical events and accidents by using different statistical methods. The list below briefly describes several approaches applied:
linear correlation between observed critical events and recorded accidents, e.g. Baker (Citation1972),
minimisation of the variance of the ratio between accidents and critical events, e.g. Hauer and Gårder (Citation1986) and Hydén (Citation1977),
linear correlation between critical events and the expected number of accidents calculated from a flow-based safety performance function (SPF; Lord, Citation1996),
estimation of the expected number of accidents from a critical event-based SPF (El-Basyouny & Sayed, Citation2013),
comparison of the expected number of accidents calculated from the accident history, with the expected number of accidents calculated from an extreme value theory approach using critical events (Songchitruksa & Tarko, Citation2006) and
comparison between a critical incident-based and accident-based before and after study (Sacchi, Sayed, & de Leur, Citation2013).
Process validation focuses on potential similarities between the process leading to accidents and the course of events in critical situations, respectively. The data about the process leading to accidents are either based on in-depth accident studies (Hydén, Citation1987) or gathered from observed accidents (e.g. Saunier, Mourji, & Agard, Citation2011; van der Horst, Citation2013).
The final requirement is that any indicator must be reliable; it should produce an accurate estimation of the severity regardless of the observation method and the setting. The estimation should also be replicable; the severity of multiple identical events should be the same irrespective of errors and variation in the observations made of each of the identical events.
Research questions
This article aims to identify and categorise different surrogate safety indicators and critically discuss their merits in general and particularly for VRU safety studies. The aim can be broken down into the following questions:
What surrogate safety indicators exist, and do they reflect both the collision risk and the injury risk in general?
Can the different surrogate indicators estimate the collision risk and the injury risk in events involving VRUs?
To what extent are the different indicators validated, and to what extent have previous validation attempts included VRUs?
Method
This article builds on the comprehensive review by Laureshyn et al. (Citation2016), which aimed to provide a wide-ranging overview of available surrogate safety indicators by performing a systematic literature review. The following databases were searched: Science Direct, Transport Research International Documentation (TRID), Web of Science, Engineering Village and Scopus. The following keywords were used: traffic conflict, traffic conflict techniques, surrogate safety, safety critical event, indirect safety, near-accident and near-miss, combined with traffic and traffic safety. Only papers in English, Swedish or Dutch were included in the review. Snowballing was also used for references deemed of high importance based on the papers mentioned in the found literature or on the authors’ previous knowledge about surrogate indicators.
The original search yielded 2445 hits. After considerable screening, in which only papers dealing with on-site observation studies were included, excluding naturalistic driving and simulation-based studies, the total number of hits was reduced to 239 articles, reports and dissertations.
Surrogate indicators of safety
The following overview summarises the different surrogate indicators of safety that were found in the literature review. Due to numerous variations of similar indicators and this article’s length limit, some indicators are combined into categories, containing the main indicator and various alternatives based on the same concept. See also for a list of all the separate indicators with a short description and their respective abbreviation. Any previous validation studies found in the review are also presented after each indicator.
Time to collision
Time to collision (TTC) is an indicator that calculates the time remaining before the collision if the involved road users continue with their respective speeds and trajectories. This continuous variable can only be calculated while the road users remain on the collision course. The two most commonly used indicators based on TTC are TTCmin, which is the minimum TTC value calculated in an event, and time to accident (TA), which is the TTC value the moment an involved road user takes an evasive action. Usually, both indicators use a threshold value to differentiate between a severe and a not severe event.
Other indicators based on or similar to TTC are time to zebra (TTZ; Várhelyi, Citation1998), the time-to-lane crossing (TTL) and the reciprocal of TTC (i.e. 1/TTC; Chin, Quek, & Cheu, Citation1992). To consider not only the momentary TTC value but, to some degree, also the duration of the safety-critical situation, Minderhoud and Bovy (Citation2001) proposed time-exposed TTC (TET), which is the time during an encounter when the TTC is below a certain threshold value, and time-integrated TTC (TIT), which is the area between the threshold level and the TTC curve when it drops below the threshold.
Finally, suggested by Laureshyn et al. (Citation2010), the T2 indicator is the predicted arrival time of the second road user, calculated while the first road user has not left the conflict point yet. When the road users are on a collision course, T2 is equal to TTC.
Five studies attempted to validate TTC-based indicators (). While all the studies use different methods to evaluate the relationship between critical events and accidents, they all find a strong correlation between the two. Four out of five studies include VRUs to some extent. However, only the study by Lord (Citation1996) explicitly focused on pedestrians while the report by Hydén (Citation1977) separates the result for VRUs and motor vehicles. The studies by El-Basyouny and Sayed (Citation2013) and Sacchi and Sayed (Citation2016) both include VRUs but only 4.6% of all conflicts they use include VRUs. Note that both of these studies use older data from that of Sayed and Zein (Citation1999).
Table 2. Validation studies of TTC-based indicators.
Post-encroachment time
Initially introduced by Allen et al. (Citation1978), the post-encroachment time (PET) is calculated as the time between the moment when the first road user leaves the path of the second and the moment when the second reaches the path of the first (i.e. the PET indicates the extent to which they miss each other).
Indicators based on or similar to PET include gap time (GT), the time between the entries into the conflict spot of two vehicles and encroachment time (ET), the time when the first vehicle entering the conflict area infringes on the predicted path of the second vehicle (Allen et al., Citation1978).
Originally proposed by Hansson (Citation1975), the time advantage (TAdv) can be considered an extension of the PET concept (Laureshyn et al., Citation2010). The TAdv is the predicted PET value, provided that the road users continue with their paths and speeds. Alhajyaseen (Citation2015) suggested the conflict index (CI) indicator which combines PET with the speed, mass and angle of the involved road users to estimate the released kinetic energy in a collision.
In total, seven studies with eight different attempts to investigate the PET’s validity were found (). Note that Cooper (Citation1984) includes two different studies, both focusing on the PET’s validity. Similar to TTC, most of the studies indicate a correlation between conflicts and accidents with the notable exception in the study by Lord (Citation1996) in which the PET definition showed no correlation and was discarded from further study. Furthermore, the studies that used extreme value theory (Songchitruksa & Tarko, Citation2006; Zheng, Ismail, & Meng, Citation2014a, Citation2014b) all focused primarily on the method and all noted that further research is required to gain more reliable results.
Table 3. Validation studies of PET-based indicators.
Deceleration
Deceleration is the most common evasive action taken by vehicle drivers to avoid a collision in urban areas (Hydén, Citation1987). Several deceleration-based indicators have been suggested to describe the severity of a traffic situation. The deceleration rate (DR) or the initial DR quantifies the magnitude of the deceleration action of a driver the moment he or she begins an evasive braking manoeuvre. Additionally, the deceleration to safety time (DST) describes the nearness to a collision through the minimal necessary deceleration for a driver to avoid the collision (to turn a collision-course situation into a PET situation) (Hupfer, Citation1997).
Tageldin, Sayed, and Wang (Citation2015) suggested observing the jerk profile (the time derivative of acceleration) and the yaw rate (the angular velocity of the road users’ rotation) as a method of identifying evasive actions by motorcyclists. The jerk profile is meant to estimate the intensity of the braking action by observing the change in acceleration. The yaw rate is intended to quantify the swerving behaviour of the motorcyclists by calculating the change in the heading angle of the motorcycle.
No previous validation studies were found for deceleration-based indicators.
Other indicators
Several indicators do not fit into any of the indicator categories presented above. These indicators estimate severity differently, but they have all been suggested as alternatives to the more commonly used indicators. No previous validation studies were found for any of these indicators.
Tageldin and Sayed (Citation2016) suggested that evasive action-based indicators, such as pedestrians’ step frequency and step length or specifically, the maximum absolute rate of change in the step frequency, could be used to identify severe events involving pedestrians. They also recommended using the jerk profile for drivers of cars and motorcycles, similar to the method of Tageldin et al. (Citation2015).
Cafiso, García, Cavarra, and Rojas (Citation2011) presented the pedestrian risk index (PRI). The PRI combines the TTZ crossing with assumptions about the driver’s reaction time and the braking capabilities of the vehicle to estimate the collision risk, as well as its potential severity. The collision risk is calculated as the time difference between the TTZ and the estimated time needed to stop; the severity is estimated as the potential impact speed squared. The final PRI is the collision risk multiplied by the severity summed during the duration of a potential collision course.
Bagdadi (Citation2013) defined conflict severity (CS) as a combination of the indicators DeltaV, TA and the assumed maximum average deceleration. The DeltaV indicator is the change in velocity forced on the road users because of a collision and depends on the speed and the mass of each road user and the angle at which the road users approach each other (Shelby, Citation2011). The TA and the maximum average deceleration are used to estimate the effectiveness of the evasive actions taken by the involved road users. Another indicator that also uses DeltaV is the extended DeltaV indicator suggested by Laureshyn, De Ceunynck, Karlsson, Svensson, and Daniels (Citation2017). It combines DeltaV with the T2 indicator and a deceleration constant to capture the nearness to a collision, as well as the potential consequences of an event.
Kuang, Qu, and Wang (Citation2015) developed an indicator called the aggregated crash index (ACI) based on the causal model presented by Davis et al. (Citation2011). This indicator is meant for car-following scenarios and comprises four conditions in a tree structure. The conditions estimate both the initial conditions of a conflict and the potential for evasive action. The ACI is then calculated as the accumulation of the collision probabilities of all possible outcomes.
Ogawa (Citation2007) discussed a space occupancy index based on personal space, which expresses the spatial sizes necessary to maintain road safety for pedestrians, bicyclists and vehicle drivers. An area around the road user is defined based on the characteristics of each road user type. The number of conflicts is then estimated by the number of personal space incursions.
Combination of indicators
To better capture the severity of an event, indicators are frequently combined with other indicators or variables (such as speed) that can provide a better understanding of the situation. The rationale behind this approach is that many indicators are not sufficiently universal and cannot be applied to all traffic events. It is thus plausible that various indicators represent partial images of the true severity of a traffic event (Ismail, Sayed, & Saunier, Citation2011).
The most prevalent examples of this approach are the various traffic conflict techniques (TCTs) that were mostly developed in the 1970s and the 1980s. A TCT is a framework for observation-based safety studies, including observation methods, instructions on how to use the technique, as well as a set of indicators used to identify conflicts (severe events). However, there are also several examples of combining indicators outside of the well-defined TCTs. For example, Lu, Liu, Wang, and Yu (Citation2012) combined the incomplete braking time and the TTC to calculate CS. Wang and Stamatiadis (Citation2014) used the required braking rate, the maximum available braking rate and the TTC to create an aggregate crash propensity metric. Ismail, Sayed, and Saunier (Citation2010) integrated the DST, the PET and the TTCmin.
The following sections briefly present various TCTs and how they estimate the severity of an event.
The American conflict technique
The American TCT defines conflicts as the occurrences of evasive actions, recognisable by braking and/or weaving manoeuvres (Parker & Zegeer, Citation1989). Different types of conflicts based on manoeuvre types are used, but no distinction is made between more and less severe conflicts. Five studies that focused on the validity of the American TCT were found (). Note that the study by Migletz, Glauz, and Bauer (Citation1985) used an alternative version of the American TCT, which also used the TTCmin to identify critical events.
Table 4. Validation studies of the American TCT
All the studies found a strong correlation between conflicts and accidents. However, none of the three large studies included VRUs.
The Canadian conflict technique
The Canadian TCT uses the TTCmin in conjunction with a subjective component named the risk of collision (ROC) to determine the severity of a conflict. Three levels of severity are used for both TTCmin and ROC, and the final severity is estimated by adding them together. The ROC levels are low, moderate and high, and the TTCmin levels are less than 2 s, less than 1.6 s and less than 1 s, respectively (Brown, Chau, DeCastilho, & Navin, Citation1984).
Three studies focused on the validity of the Canadian TCT (). Note that the Brown (Citation1994) study used the TA indicator instead of the TTCmin. The validation studies all found a clear correlation between conflicts accidents. However, while all the studies included VRUs to some extent, none of them focused on VRUs.
Table 5. Validation studies of the Canadian TCT.
The Dutch conflict technique
The Dutch Objective TCT for Operation and Research (DOCTOR) defines a conflict as a critical traffic situation in which two or more road users approach each other in such a manner that a collision is imminent, and a realistic probability of personal injury or material damage is present if their courses and speeds remain unchanged. The severity of a conflict is estimated in several steps. First, a general subjective severity is assessed by a trained observer. The event is then broken down into the probability of collision and the potential injury severity. The probability of collision is calculated by using the TTCmin value (less than 1.5 s is considered critical) or the PET value (less than 1 s is considered critical), and the potential injury severity is estimated subjectively from the lowest to the highest (Kraay, van der Horst, & Oppe, Citation2013).
Two studies focused on the validity of the Dutch TCT were located (). Both studies indicated a significant similarity between conflicts and accidents. While the study by van der Horst, Rook, Amerongen, and Bakker (Citation2007) only focused on a motor vehicle, the study by van der Horst, Thierry, Vet, and Rahman (Citation2016) did have a large focus on pedestrians.
Table 6. Validation studies of the Dutch TCT
The research by van der Horst et al. (Citation2007) is one of the only two studies found in this review that attempted to process validation.
van der Horst et al. (Citation2007) compared the observed conflicts from four different locations with video-recorded accidents from the same locations. The accident observation was carried out over a period of 22 months, while the conflicts were observed for 24 hours.
The Swedish conflict technique
The severity of a traffic event in The Swedish TCT is calculated based on two variables: TA and conflicting speed (CS). The TA is the time from the start of the evasive action until a collision occurs if the road users’ speeds and directions remain unchanged, whereas the CS is the speed of the vehicle before the evasive action starts (Hydén, Citation1987).
Three studies investigated the validity of the Swedish TCT (), including the second attempt of a process validation. Hydén (Citation1987) compared the TA values and the CS of conflicts and accidents. The TA and the CS were estimated based on the data from in-depth studies on accidents in the same city.
Table 7. Validation studies of the Swedish TCT.
All three studies indicated a significant relationship between conflicts and accidents for VRUs. While the studies by Hydén (Citation1987) and Svensson (Citation1992) did a separate analysis for VRUs, a Ph.D. thesis by Shbeeb (Citation2000) focused specifically on conflicts involving pedestrians.
TCTs using only a subjective severity rating
Both the Canadian TCT and the DOCTOR use a combination of an objective indicator and a subjective severity rating. However, several techniques solely rely on a subjective severity rating to identify critical events. These TCTs are the British (Baguley, Citation1984; Kaparias et al., Citation2010), the French (Muhlrad & Dupre, Citation1984), the German (Erke, Citation1984), the Austrian (Risser & Schutzenhofer, Citation1984) and the Czech techniques (Kocárková, Citation2012). These techniques use a number of predefined subjective severity grades to identify critical events that are often based on the closeness of road users and the occurrence of uncontrolled evasive actions.
Three studies investigated the validity of the British TCT (). All three studies found a strong correlation between conflicts and accidents but none of them included conflicts involving VRUs.
Table 8. Validation studies of TCTs using only a subjective severity rating.
Summary of surrogate safety indicators
This section provides a summary of all presented indicators (). It shows whether the indicators do reflect each of the ideal requirements for a surrogate safety indicator. Introduced in the beginning of this article as, collision risk divided into initial conditions and evasive actions and injury risk. While the model by Davis et al. (Citation2011) suggests that an indicator should reflect both initial conditions and evasive actions, it is also possible for surrogate indicators to be outcomes of a traffic event. Therefore, outcomes have also been added as a column under collision risk in . The number of validation studies overall and the number of validation studies that included VRUs are also noted in the summary table.
Table 9. Summary of surrogate safety indicators and their relation to collision risk and injury risk.
Discussion
The result shows a wide range of different indicators that can be used to identify safety-critical events in traffic. This section will attempt to discuss these different indicators from the perspectives of their suitability for studying VRU’s safety, universal and specific indicators, their validity and finally, their reliability.
Suitability of surrogate safety indicators for studying VRU’s safety
Based on the theoretical perspective described in the beginning of this article, a surrogate indicator should estimate both the ROC and the risk of injury. Collision risk can be further divided into a set of initial conditions and a set of evasive actions. However, based on the results, it seems that many of the commonly used surrogate indicators do not distinguish these aspects of a traffic event.
Both the TTC-based indicators and the PET indicators instead identify critical events based on the outcome of a traffic event. That is, the severity according to these indicators depended both on the initial conditions and any evasive actions taken during the event, but the indicators make no attempt at separating them. The TA indicator is an exception to this case since it measures the TTC at the onset of evasive action, which can be regarded as the starting point for the conflict.
Estimating the severity of a traffic event based on the outcome of the event can potentially have some problems. It is possible that an event with severe initial conditions followed by an effective evasive action can lead to a non-severe outcome, and therefore not be identified as a conflict. For example, a motor vehicle braking in front of a pedestrian (who then waits a few seconds before continuing) can create a high PET value (indicating low severity), even though the situation was severe. Another example might include a swerving cyclist which can quickly remove him/herself from a collision course with a motor vehicle before the situation would become critical according to TTCmin.
While TTC- and PET-based indicators measure the outcome of events, other indicators estimate the severity of traffic events based solely on the magnitude of evasive actions. These indicators frequently focus on identifying critical braking but there are also some indicators that focus on swerving and running (Tageldin et al., Citation2015; Tageldin & Sayed, Citation2016). Relying solely on evasive actions can give some potential problems. It is possible to observe braking, swerving, stopping or running without severe initial conditions. For example, a running pedestrian is not necessarily avoiding a collision, but could instead be in a hurry or running to quickly allow the motor vehicles to pass. Relying on evasive actions also disregards situations without evasive actions which might still be severe. For example, it is possible for two road users to be very close to colliding without anyone of them reacting or even seeing the other.
Relatively few indicators estimate the initial condition in a conflict situation. The TA indicator measures the TTC at the start of an evasive action. While not strictly measuring the initial conditions of a situation, TA does estimate the conditions for any evasive actions which is similar to the function of the initial conditions described by Davis et al. (Citation2011). Both the Swedish TCT and the CS indicator (Bagdadi, Citation2013) rely on TA but both combine TA with speed and assumptions of the road users deceleration to estimate the severity of the initial conditions. However, none of them considers any other type of evasive action. A potential solution to this problem is to limit the type of traffic situations in which an indicator can be applied. Both the ACI and the PRI (Cafiso et al., Citation2011) rely solely on deceleration but they are only usable in very specific situations. However, note that the PRI does not consider any evasive actions taken by the pedestrians.
Finally, some of the indicators (the PRI, the Dutch and British TCT) manage to include all three of the aspects discussed in this review, the initial conditions, the evasive actions and risk of injury.
However, these indicators either limit themselves to a very specific situation, such as the PRI, or rely on the subjective evaluation of the severity by human observers, such as the Dutch and British TCT.
Universal and specific indicators
Certain indicators are designed to only be used in very specific settings while others are meant to be more universal. The ACI (Kuang et al., Citation2015), PRI (Cafiso et al., Citation2011) and the space occupancy index (Ogawa, Citation2007) are examples of indicators meant to be used only in very specific settings such as the ACI on motorways and the space occupancy index on protected bikeway paths.
Other indicators (such as TTC-, PET- and DeltaV-based indicators) aim to provide a universal estimation of severity regardless of the involved road users or the specific setting. Most of the indicators of the first (universal) kind focus on cars. Indicators such as the Swedish TCT, the CS, the extended DeltaV and the different deceleration-based types include assumptions regarding the deceleration of cars. Even TTC- and PET-based indicators concentrate on cars since the commonly used threshold values are chosen based on the observation of cars (Hayward, Citation1971; van der Horst, Citation1991).
Both universal and specific indicators have their advantages and disadvantages. Universal indicators can be applied in a variety of different types of setting which makes them very useful. However, specific indicators can more easily consider all important factors in their specific setting which allows for a more comprehensive indicator within that setting.
Validity
The extent of validity of the different indicators is difficult to appraise due to the widely different methods used. However, almost all the validation studies found in this review do show a significant correlation between numbers of critical events and accidents, regardless of what indicator is being used. The result also shows that while many validation studies have solely focused on motor vehicles, some studies have included VRUs. However, not all of these studies have done a separate analysis for VRUs and only one study (Lord, Citation1996) has focused on pedestrians and no validation study has especially focused on cyclists.
The findings show various approaches used to validate surrogate indicators, and it is unclear whether any particular method is preferable. The number of studied locations and the duration of the study at each location also vary among the studies, further complicating any attempt to compare the extent of validation among the different indicators. Another question, which is discussed by some of the studies and further discussed by Güttinger (Citation1982), is how strong the connection between critical events and accidents must be to be considered good enough?
The report by Migletz et al. (Citation1985) notes that the conflicts are good estimates of safety since they produce estimates of the expected number of accidents better or equally as good as historic accident data. Güttinger (Citation1982) suggests that the relation between critical events and accidents must be stronger than the relationship between exposure variables and accident as well as stronger than the subjective safety assessment of the residents of the locations under study.
Reliability
The most apparent reliability concern is the use of subjective observation. Indicators based on human judgement can potentially allow for the consideration of the initial conditions, the potential evasive actions and risk of injury in more detail than any other indicators.
However, the use of a subjective component also has several drawbacks, especially the potential reliability concerns and the difficulty of incorporating such components into automated systems. The use of subjective components and trained observers has historically been common in TCTs.
Some of the literature indicates the possibility to achieve satisfactory levels of reliability among different observers (Grayson, Citation1984; Kruysse, Citation1991; Kruysse & Wijlhuizen, Citation1992; Shinar, Citation1984).
The so-called Malmö calibration study (Grayson, Citation1984) also provides a good comparison between several TCTs and objectively measured values using computer vision. The comparison showed that teams applying different TCTs agreed well on their allocation of conflicts regardless of road user type.
Besides human observers and subjective assessment, it is also possible to discuss reliability between different computer-based systems. This is especially relevant for the trajectory prediction which is necessary to identify a collision course. Predicting the future path and speed of a road user can be done using several methods. From a simple approach which relies on constant speed and assumptions about how the road user intends to travel to more complex methods based on observed behaviour at the studied locations (St-Aubin, Saunier, & Miranda-Moreno, Citation2014). The choice of method for predicting the path of road users will influence what situations are identified as conflicts regardless of the indicator which is used. This makes it further complicated to compare surrogate safety indicators, even if they are based on objective values such as TTCmin. This is particularly relevant whenever swerving is used as an evasive action since this makes it very difficult to accurately predict the path of the road users.
Limitations of this study
This study’s main limitation is that a relatively large number of documents (177) that seemed relevant (based on their abstracts) could not be located. The main reason for this result is the initial inclusion of reports, dissertations and conference proceedings in the search for literature, instead of focusing only on journal articles.
A consequence of this lack of material is that the listing of indicators and techniques may not be fully comprehensive since some indicators and techniques have possibly been missed.
Conclusions
There are many different surrogate safety indicators suggested in the literature. However, few of them focus on aspects that are important when studying VRUs. This article has attempted to assess the different indicators based on their ability to consider both collision risk (divided into the initial condition and evasive actions) and injury risk.
The results show that many indicators focus on braking as an indicator to identify critical events and do not consider swerving or running. Swerving also creates concerns for the indicators that rely on a collision course since predicting the path of a swerving cyclist seems very difficult compared to predicting the path of a braking motor vehicle.
Few indicators try to estimate the injury risk. The large difference in mass and the lack of a protective shell for the VRUs makes the risk of injury very different for events involving only motor vehicles compared to events which involve VRUs. Overall, very few indicators manage to consider all the relevant aspects of importance taken up in this article, and those who do either use subjective evaluation, such as the Dutch and British TCTs, or are limited to a very specific setting, such as the PRI. However, it should be noted that while the PRI does technically consider all aspects, it does not consider any evasive actions from the pedestrians which might be relevant for a complete safety analysis.
Nevertheless, even though the indicators do not reflect all of the relevant aspects pointed out in this article, all aspects are covered by some of the indicators. Deceleration, jerk, yaw rate and change in step frequency all attempt to capture evasive actions from different types of road users.
TA, PRI and space occupancy index attempt to identify severe initial conditions and DeltaV attempts to evaluate the injury risk dependent on the types of road users involved in a critical traffic event. Further research focusing on combining the many different indicators could help to strengthen the theoretical base for surrogate safety indicators.
Finally, the results show that there are some validation studies that have included VRUs. However, the many different approaches used, the length of observations and the number of locations studied in the validation studies make comparing the extent of validity between the indicators difficult. However, there seems to be a consistent and significant correlation between numbers of critical events and accidents regardless of which indicators are used and comparisons between TCTs seem to indicate significant similarities between the results from different indicators. Further research into the validity of surrogate safety indicators is needed. The research should also attempt to answer what extent of validation is good enough and to what extent validation of one indicator can be used to evaluate other indicators.
This research can also help road safety practitioners who endeavour to use surrogate safety indicators. Even though strong correlation to accidents seems to be found regardless of indicator no current indicator seems to reflect all aspects of all situations. Practitioners should therefore choose a suitable indicator based on the context of the situation. For example, yaw rate might be more suitable than TTCmin in a situation which contains many swerving cyclists. However, since yaw rate does not consider any initial conditions, some other indicators, such as TA, can also be used to find relevant events and make sure that the swerving was an evasive action. Similar arguments based on the shortcomings of the different indicators discussed in this article could be used for a better choice of a suitable indicator for the given traffic situation.
Disclosure statement
No potential conflict of interest was reported by the authors.
Additional information
Funding
References
- Alhajyaseen, W. K. M. (2015). The integration of conflict probability and severity for the safety assessment of intersections. Arabian Journal for Science and Engineering, 40(2), 421–430. doi: 10.1007/s13369-014-1553-1
- Allen, Brian, Shin, Tom, & Cooper, Peter. (1978). Analysis of traffic conflicts and collisions. Transportation Research Record, 667, 67–74.
- Alsop, J., & Langley, J. (2001). Under-reporting of motor vehicle traffic crash victims in New Zealand. Accident Analysis & Prevention, 33(3), 353–359. doi: 10.1016/S0001-4575(00)00049-X
- Amoros, E., Martin, J.-L., & Laumon, B. (2006). Under-reporting of road crash casualties in France. Accident Analysis & Prevention, 38(4), 627–635. doi: 10.1016/j.aap.2005.11.006
- Bagdadi, O. (2013). Estimation of the severity of safety critical events. Accident Analysis & Prevention, 50, 167–174. doi: 10.1016/j.aap.2012.04.007
- Baguley, C. J. (1984). The British traffic conflicts technique. NATO advanced research workshop on international calibration study of traffic conflict techniques, Copenhagen.
- Baker, William T. (1972). An evaluation of the traffic conflicts technique. 51st Annual Meeting of the Highway Research Board. Washington District of Columbia, United States.
- Balasha, D., Hakkert, A. S., & Livneh, M. (1979). A quantitative definition of the near accident concept. Second International Traffic Conflicts Technique Workshop, Paris.
- Brown, G. R. (1994). Traffic conflicts for road user safety studies. Canadian Journal of Civil Engineering, 21(5), 1–15. doi: 10.1139/l94-001
- Brown, G., Chau, A., DeCastilho, B., & Navin, F. (1984). Land transport safety series, The University of British Columbia, Department of Civil Engineering.
- Cafiso, S., García, A. G., Cavarra, R., & Rojas, M. A. R. (2011). Crosswalk safety evaluation using a Pedestrian Risk Index as traffic conflict measure. 3rd International Conference on Road Safety and Simulation, Indianapolis, IN.
- Chin, H. C., & Quek, S. T. (1997). Measurement of traffic conflicts. Safety Science, 26(3), 169–185. doi: 10.1016/S0925-7535(97)00041-6
- Chin, H. C., Quek, S. T., & Cheu, R. L. (1992). Quantitative examination of traffic conflicts. Transportation Research Record, 1376, 86–91.
- Cooper, P. J. (1973). Predicting intersection accidents: The use of conflicts and other models based on traffic flow parameters to predict accident experience at non-signalised intersections, Ottawa, Canada.
- Cooper, P. J. (1984). Experience with traffic conflicts in Canada with emphasis on “post encroachment time” techniques. In E. Asmussen (ed.) International Calibration Study of Traffic Conflict Techniques. NATO ASI Series (Series F: Computer and Systems Sciences) (Vol. 5). Berlin, Heidelberg: Springer.
- Davis, G. A., Hourdos, J., Xiong, H., & Chatterjee, I. (2011). Outline for a causal model of traffic conflicts and crashes. Accident Analysis & Prevention, 43(6), 1907–1919. doi: 10.1016/j.aap.2011.05.001
- El-Basyouny, K., & Sayed, T. (2013). Safety performance functions using traffic conflicts. Safety Science, 51(1), 160–164. doi: 10.1016/j.ssci.2012.04.015
- Elvik, R. (1988). Some difficulties in defining populations of “entities” for estimating the expected number of accidents. Accident Analysis & Prevention, 20(4), 261–275. doi: 10.1016/0001-4575(88)90054-1
- Elvik, R. (2009). The non-linearity of risk and the promotion of environmentally sustainable transport. Accident Analysis and Prevention, 41(4), 849–855. doi: 10.1016/j.aap.2009.04.009
- Elvik, R., Høye, A., Vaa, T., & Sørensen, M. (2009). The handbook of road safety measures. Bingley: Emerald.
- Elvik, R., & Mysen, A. (1999). Incomplete accident reporting: Meta-analysis of studies made in 13 countries. Transportation Research Record: Journal of the Transportation Research Board, 1665, 133–140. doi: 10.3141/1665-18
- Englund, A., Gregersen, N. P., Hydén, C., Lövsund, P., & Åberg, L. (1998). Trafiksäkerhet – en kunskapsöversikt [Traffic safety – a knowledge review]. Lund: KFB, Studentlitteratur.
- Erke, H. (1984). The traffic conflict technique of the Federal Republic of Germany. NATO Advanced Research Workshop on International Calibration Study of Traffic Conflict Techniques, Copenhagen.
- Gettman, D., & Head, L. (2003). Surrogate safety measures from traffic simulation models (Report No. FHWA-RD-03-050).
- Grayson, G. B. (1984). The Malmö study: a calibration of traffic conflict techniques (Report No. R-84-12).
- Güttinger, V. A. (1982). From accidents to conflicts: Alternative safety measurement. Third International Workshop on Traffic Conflicts Techniques, Leidschendam.
- Hansson, A. (1975). Studies in driver behaviour, with applications in traffic design and planning. Two examples (Report No. Bulletin 11).
- Hauer, E., & Gårder, P. (1986). Research into the validity of the traffic conflicts technique. Accident Analysis & Prevention, 18(6), 471–481. doi: 10.1016/0001-4575(86)90020-5
- Hauer, E., & Hakkert, A. S. (1988). Extent and some implications of incomplete accident reporting. Transportation Research Record, 1185, 1–10.
- Hayward, J. C. (1971). Near misses as a measure of safety at urban intersections (Master thesis). The Pennsylvania State University.
- Hupfer, C. (1997). Deceleration to Safety Time (DST) – a useful figure to evaluate traffic safety? 10th ICTCT Workshop, Lund.
- Hydén, C. (1977). A traffic conflict technique for determining risk (Report No. LUTVDG/(TVTT-3005)/1-95/(1977) & Bulletin 15 B).
- Hydén, C. (1987). The development of a method for traffic safety evaluation: The Swedish traffic conflict technique (Doctoral thesis). Lund University.
- Ismail, K., Sayed, T., & Saunier, N. (2010). Automated analysis of pedestrian-vehicle conflicts: Context for before-and-after studies. Transportation Research Record, 2198, 52–64. doi: 10.3141/2198-07
- Ismail, K., Sayed, T., & Saunier, N. (2011). Methodologies for aggregating indicators of traffic conflict. Transportation Research Record, 10–19. doi: 10.3141/2237-02
- Kaparias, I., Bell, M. G. H., Greensted, J., Cheng, S., Miri, A., Taylor, C., & Mount, B. (2010). Development and implementation of a vehicle–pedestrian conflict analysis method: Adaptation of a vehicle–vehicle technique. Transportation Research Record, 75–82. doi: 10.3141/2198-09
- Kocárková, D. (2012). Traffic conflict techniques in Czech Republic. SIIV – 5th International Congress – Sustainability of Road Infrastructures, Rome.
- Kraay, J. H. (1987). The Dutch conflict observation method “doctor”. Retrieved from http://trid.trb.org/view/291273
- Kraay, J. H., van der Horst, A. R. A., & Oppe, S. (2013). Manual conflict observation technique doctor. Foundation Road Safety for All.
- Kruysse, H. W. (1991). The subjective evaluation of traffic conflicts based on an internal concept of dangerousness. Accident Analysis & Prevention, 23(1), 53–65. doi: 10.1016/0001-4575(91)90035-4
- Kruysse, H. W., & Wijlhuizen, G. J. (1992). Why are experts not better in judging the danger of filmed traffic conflicts? Accident Analysis & Prevention, 24(3), 227–235. doi: 10.1016/0001-4575(92)90002-Z
- Kuang, Y., Qu, X., & Wang, S. (2015). A tree-structured crash surrogate measure for freeways. Accident Analysis & Prevention, 77, 137–148. doi: 10.1016/j.aap.2015.02.007
- Laureshyn, A., De Ceunynck, T., Karlsson, C., Svensson, Å., & Daniels, S. (2017). In search of the severity dimension of traffic events: Extended Delta-V as a traffic conflict indicator. Accident Analysis & Prevention, 98, 46–56. doi: 10.1016/j.aap.2016.09.026
- Laureshyn, A., Johnsson, C., De Ceunynck, T., Svensson, Å, de Goede, M., Saunier, N., … Daniels, S. (2016). Review of current study methods for VRU safety. Appendix 6 – Scoping review: surrogate measures of safety in site-based road traffic observations (Report No. Deliverable 2.1 – part 4).
- Laureshyn, A., Svensson, Å., & Hydén, C. (2010). Evaluation of traffic safety, based on micro-level behavioural data: theoretical framework and first implementation. Accident Analysis & Prevention, 42, 1637–1646. doi: 10.1016/j.aap.2010.03.021
- Lord, D. (1996). Analysis of pedestrian conflicts with left-turning traffic. Transportation Research Record, 1538, 61–67. doi:10.3141/1538-08 doi: 10.1177/0361198196153800108
- Lu, G., Liu, M., Wang, Y., & Yu, G. (2012). Quantifying the severity of traffic conflict by assuming moving elements as rectangles at intersection. Procedia – Social and Behavioral Sciences, 43, 255–264. doi: 10.1016/j.sbspro.2012.04.098
- Migletz, D. J., Glauz, W. D., & Bauer, K. M. (1985). Relationships between traffic conflicts and accidents (Report No. FHWA/RD-84/042).
- Minderhoud, M. M., & Bovy, P. H. L. (2001). Extended time-to-collision measures for road traffic safety assessment. Accident Analysis & Prevention, 33(1), 89–97. doi: 10.1016/S0001-4575(00)00019-1
- Mohamed, M. G., & Saunier, N. (2013). Motion prediction methods for surrogate safety analysis. Transportation Research Record, 2386, 168–178. doi: 10.3141/2386-19
- Muhlrad, N., & Dupre, G. (1984). The French conflict technique. NATO Advanced Research Workshop on International Calibration Study of Traffic Conflict Techniques, Copenhagen.
- Ogawa, K. (2007). An analysis of traffic conflict phenomenon of bicycles using space occupancy index. Journal of the Eastern Asia Society for Transportation Studies, 7, 1820–1827.
- Paddock, R. D., & Spence, D. E. (1973). The conflicts technique: An accident prediction method. Transportation Research Record 486 (pp. 1–10). Ohio Department of Transportation, Columbus, United States.
- Parker, M. R., & Zegeer, C. V. (1989). Traffic conflict techniques for safety and operation (Report No. FHWA-IP-88-027).
- Peesapati, L. N., Hunter, M. P., & Rodgers, M. O. (2013). Evaluation of postencroachment time as surrogate for opposing left-turn crashes. Transportation Research Record, 2386, 42–51. doi: 10.3141/2386-06
- Perkins, S. R., & Harris, J. I. (1967). Traffic conflict characteristics: Freeway curve and exit area F1, December, 1966. Retrieved from: http://trid.trb.org/view/618537.
- Pugh, D. E., & Halpin, T. J. (1974). Traffic conflicts in Washington State. Washington State Department of Highways, Washington.
- Risser, R., & Schutzenhofer, A. (1984). Application of traffic conflict technique in Austria. NATO Advanced Research Workshop on International Calibration Study of Traffic Conflict Techniques, Copenhagen.
- Sacchi, E., & Sayed, T. (2016). Conflict-based safety performance functions for predicting traffic collisions by type. Transportation Research Record: Journal of the Transportation Research Board, 2583, 50–55. doi: 10.3141/2583-07
- Sacchi, E., Sayed, T., & de Leur, P. (2013). A comparison of collision-based and conflict-based safety evaluations: The case of right-turn smart channels. Accident Analysis & Prevention, 59, 260–266. doi: 10.1016/j.aap.2013.06.002
- Saunier, N., Mourji, N., & Agard, B. (2011). Mining microscopic data of vehicle conflicts and collisions to investigate collision factors. Transportation Research Record: Journal of the Transportation Research Board (2237), 41–50. doi: 10.3141/2237-05
- Sayed, T., & Zein, S. (1999). Traffic conflict standards for intersections. Transportation Planning & Technology, 22, 309–323. doi: 10.1080/03081069908717634
- Shbeeb, L. (2000). Development of a traffic conflicts technique for different environments – a comparative study of pedestrian conflicts in Sweden and Jordan (Doctoral thesis). University of Lund, Lund Institute of Technology.
- Shelby, S. G. (2011). Delta-V as a measure of traffic conflict severity. 90th TRB Annual Meeting, Washington, DC.
- Shinar, D. (1984). The traffic conflict technique: A subjective vs. objective approach. Journal of Safety Research, 15, 153–157. doi: 10.1016/0022-4375(84)90046-X
- Songchitruksa, P., & Tarko, A. (2006). The extreme value theory approach to safety estimation. Accident Analysis and Prevention, 38, 811–822. doi: 10.1016/j.aap.2006.02.003
- Spicer, B. R. (1973). A study of traffic conflicts at six intersections (Report No. Report LR551). Retrieved from http://trid.trb.org/view/129891.
- St-Aubin, P., Saunier, N., & Miranda-Moreno, L. F. (2014). Road user collision prediction using motion patterns applied to surrogate safety analysis. 93rd TRB Annual Meeting, Washington, DC.
- Svensson, Å. (1992). Vidareutveckling och validering av den svenska konflikttekniken (Report No. (unpublished)).
- Svensson, Å. (1998). A method for analysing the traffic process in a safety perspective (Doctoral thesis), University of Lund, Lund Institute of Technology.
- Svensson, Å., & Hydén, C. (2006). Estimating the severity of safety related behaviour. Accident Analysis & Prevention, 38(2), 379–385. doi: 10.1016/j.aap.2005.10.009
- Tageldin, A., & Sayed, T. (2016). Developing evasive action-based indicators for identifying pedestrian conflicts in less organized traffic environments. Journal of Advanced Transportation, 50, 1193–1208. doi: 10.1002/atr.1397
- Tageldin, A., Sayed, T., & Wang, X. (2015). Can time proximity measures be used as safety indicators in all driving cultures? A case study of motorcycle safety in China. 94th TRB Annual Meeting, Washington, DC.
- TRRL. (1980). Traffic conflicts and accidents at road junctions. TRRL Leaflet LF918.
- van der Horst, A. R. A. (1990). A time-based analysis of road user behaviour in normal and critical encounters (Doctoral thesis), Delft University of Technology.
- van der Horst, A. R. A. (1991). Time-to-Collision as a cue for decision making in braking. In A. G. Gale (Ed.), Vision in vehicles – III (pp. 19–26). Amsterdam: Elsevier.
- van der Horst, A. R. A. (2013). Video-recording of accidents, conflicts and road user behaviour: A step forward in traffic safety research. 8. Gemeinsames Symposium der DGVM und DGVP, Hamburg.
- van der Horst, A. R. A., Rook, A. M., Amerongen, P. J. M. v., & Bakker, P. J. (2007). Video-recorded accidents, conflicts and road user behaviour: Integral Approach Analysis of Traffic Accidents (IAAV). TNO Defence, Security and Safety.
- van der Horst, A. R. A., Thierry, M. C., Vet, J. M., & Rahman, A. F. (2016). An evaluation of speed management measures in Bangladesh based upon alternative accident recording, speed measurements, and DOCTOR traffic conflict observations. Transportation Research Part F. doi: 10.1016/j.trf.2016.05.006
- Várhelyi, A. (1998). Driver's speed behaviour at a zebra crossing: a case study. Accident Analysis & Prevention, 30(6), 731–743. doi: 10.1016/S0001-4575(98)00026-8
- Wang, C., & Stamatiadis, N. (2014). Evaluation of a simulation-based surrogate safety metric. Accident Analysis & Prevention, 71, 82–92. doi: 10.1016/j.aap.2014.05.004
- Zheng, L., Ismail, K., & Meng, X. (2014a). Freeway safety estimation using extreme value theory approaches: A comparative study. Accident Analysis & Prevention, 62, 32–41. doi: 10.1016/j.aap.2013.09.006
- Zheng, L., Ismail, K., & Meng, X. (2014b). Shifted Gamma-Generalized Pareto Distribution model to map the safety continuum and estimate crashes. Safety Science, 64, 155–162. doi: 10.1016/j.ssci.2013.12.003
- Zheng, L., Ismail, K., & Meng, X. (2014c). Traffic conflict techniques for road safety analysis: open questions and some insights. Canadian Journal of Civil Engineering, 41(7), 633–641. doi: 10.1139/cjce-2013-0558
