
 ?Mathematical formulae have been encoded as MathML and are displayed in this HTML version using MathJax in order to improve their display. Uncheck the box to turn MathJax off. This feature requires Javascript. Click on a formula to zoom.
ABSTRACT
The cost associated with the waiting time that passengers incur in a public transit network is one of the main components of total transit travel cost. The cost of a unit of waiting time per passenger is higher than the cost of a unit of riding time or access time. While the assumption of half the headway as the mean waiting time has been widely used in waiting time cost estimation, it is not always a realistic assumption considering heterogeneous passengers and different types of transit services. Moreover, many studies considered the waiting times of passengers only at the origin, while waiting times can also be incurred at transfer points and the destination, the latter especially for passengers with required arrival time. After describing definitions for type of passengers and type of transit service and reasoning about proper assumptions for mean waiting time, we conducted a comprehensive survey of articles in transit operation and planning published in highly-ranked journals from 2010 to 2019 which is presented in the paper. We found that most of the reviewed articles on transit suffer from lack of clear assumptions regarding the type of service and the type of passenger, which restricts the validity of the assumed waiting time. To address these issues, we develop a comprehensive approach to determine the mean waiting time of travellers. Mean waiting time for possible combinations of heterogeneous types of passengers (who plan and who do not plan their trips) and different service type (schedule-based, frequency-based, high-frequency and low-frequency) are developed. In addition, we critically review the waiting time considered in previous studies for a single route case (uniform headway with reliable service). The proposed comprehensive approach could be utilised in transit studies to better model the transit use which subsequently results in better designs and more efficient operations.
1. Introduction
Designing, planning and improving public transit systems require that cost to passengers, as well as cost to operators, be considered. Cost to passengers usually includes access cost, waiting time (at origin, transfer points and destination), cost of transfer if any and in-vehicle travel cost. The waiting time of passengers at stops is often reported as the highest cost component of the total cost to passengers (Hossain, Hunt, & Wirasinghe, Citation2015; Nuzzolo & Comi, Citation2016). If waiting time as an important component of passenger cost is not properly estimated, the subsequent transit planning, operations and design are not thoroughly representing the impact of passenger costs. Inaccurate estimates of passenger waiting time would affect the estimation of passengers generalised costs and thus affect the estimation of transit use. In addition, many transit system optimisation models such as Newell (Citation1971) and Wirasinghe (Citation1990) propose total cost functions including both operator’s costs and user costs. The passenger cost factor in these models could be either over or under emphasised depending on the type of transit services and assumptions made. Thereby, not properly estimating waiting time affects the recommendations and outcomes of the transit design, planning and operation.
The mean waiting time incurred by users is what is usually included in a generalised cost function. In the case of regular services where headways are equal, the mean waiting time of passengers is estimated assuming that (i) passengers arrive randomly at stops and (ii) passengers can be served by the first arriving vehicle, and is given by:(1)
(1) where H is the service headway. Equation (1) is the most widely used approach in transit studies (Dial, Citation1967; Clerq, Citation1972; Wirasinghe, Citation1980; Tian, Yang, & Huang, Citation2012; Sun, Wu, Wu, Yan, & Gao, Citation2016). However, in the case where service is not completely reliable, the assumption of regular service can be problematic. Numerous models have been proposed to address cases where some degree of irregularity is involved in bus arrivals (Amin-Naseri & Baradaran, Citation2015; Holroyd & Scraggs, Citation1966; Osuna & Newell, Citation1972; Welding, Citation1957). A well-known model was proposed by Osuna and Newell (Citation1972) assuming randomly arriving passengers:
(2)
(2) where
and
are the expected headway and variance of headway, respectively. In the case of regular services, the variance of the headway is zero and this model reverts to EquationEquation (1
(4a)
(4a) ).
In the case where each stop is served by multiple routes, various models have been introduced to address the mean waiting time of passengers (Larsen & Sunde, Citation2008; Spiess & Florian, Citation1989). The most widely used model, introduced by Spiess and Florian (Citation1989), assumes that (i) passengers arrive uniformly distributed at stops, (ii) the headways follow an exponential distribution with a mean of for each route passing a specific stop where
is the frequency of service and (iii) passengers take the first bus that arrives, leading to the mean waiting time at a stop being given by:
(3)
(3) where
. Different values of
lead to different distributions of headways. The special case of
represents an approximation of the mean waiting time with equal interarrival.
These models determine the simple half the headway as the mean waiting time for the special case of a fixed headway, which means that the waiting time assumptions are over simplified and do not consider the heterogeneity of passengers [i.e. planning and non-planning passengers; commuters and non-commuters with a fixed arrival (e.g. fixed arrival time at work) or departure (e.g. fixed time when leaving work)] and/or different types of bus operations (schedule-based, frequency-based). Moreover, the assumption that passengers arrive at a uniform rate at the stop and board the first bus in a set of routes without considering the scheduled departures on particular routes is not sufficiently representative of the actual behaviour of passengers (Ingvardson, Nielsen, Raveau, & Nielsen, Citation2018; Rahman, Wirasinghe, & Kattan, Citation2016). In addition, these approaches only consider the waiting time incurred by passengers at the origin, which underestimates the total waiting time neglecting the waiting time incurred at the destination (schedule delay). The waiting time at the origin and the schedule delay should be taken into account, especially when passengers have a required arrival time (Wirasinghe, Citation1990).
The aim of this study is to critically review how passenger waiting time is modelled in the literature, and to demonstrate that proper consideration of transit service type, and heterogeneity of passengers and passenger trip purpose, are essential to accurately estimate mean waiting time. Our comprehensive literature review reveals the widespread lack of proper assumptions which restrict the validity of the models used in most previous studies to only specific transit situations. To address this gap, this paper formulates new analytical estimates of mean waiting time for several possible combinations of various types of passengers and different types of operations, in which passengers are not left behind by targeted bus.
The remaining of this paper is organised as follows: First, previous studies on different types of service operation and transit users are discussed, and refined definitions of transit types and users are proposed. Then, a generalised mean waiting time model is developed. In the final section, we present a summary of an extensive literature review conducted to understand how recent studies have dealt with mean waiting times in transit networks, and where necessary, suggest improvements.
2. Appropriate terminology regarding types of service and transit users
Before performing an analysis to determine the mean waiting times in general situations, acceptable terminology regarding different types of passengers and various types of operations must be defined.
2.1. Different types of service operations
From the scheduling point of view, transit service can be either frequency-based (also known as headway-based or non-scheduled) or schedule-based. In a frequency-based system, only the headway of the system is known to transit users. The headway can be either equal or varying throughout the day. In a schedule-based service, routes usually have a published timetable. The headway and arrival and departure times of the runs for different times of day can be extracted from a published timetable assuming reliable service.
While previous studies have ranked the provision of real-time information as a desirable amenity for a public transit service (De Gruyter, Currie, Truong, & Naznin, Citation2019), real-time information may or may not be provided for schedule-based services. Parast (Citation2012) conducted a survey in 24 European cities and concluded that real-time information should be viewed as supplemental to schedule information, which means that a bus service is considered as schedule-based when the departure time from each stop is known regardless of provision of the real-time information. The same definition of the schedule-based system is considered in Ceder (Citation2001), Furth and Muller (Citation2007, Citation2009), Larsen and Sunde (Citation2008) and Zhao, Dessouky, and Bukkapatnam (Citation2006) as they assumed schedule-based service must have pre-defined departure times.
In this paper, schedule-based service refers to a service that operates based on a published timetable. It may also provide passengers with real-time information about delayed buses so passengers can minimise their waiting time at stops by adjusting their departure time from the origin. No published timetable is provided for frequency-based service.
Regarding the frequency of service, previous studies have considered two different types of service: (i) high-frequency service (short-headway) and (ii) low-frequency service (long-headway). The main criterion to distinguish between high-frequency and low-frequency service is the length of the headway. For example, Muñoz et al. (Citation2013) considered a service with a headway of less than ∼5 min as a high-frequency service. In contrast, Chiraphadhanakul and Barnhart (Citation2013) considered high-frequency service as services operating every 15 min or less. Similarly, Okrent (Citation1974), Jolliffe and Hutchinson (Citation1975), Hickman (Citation2001) and Hounsell, Shrestha, and Wong (Citation2012) considered services with headway less than 12 min as a high-frequency service. However, the majority of the studies considered the upper limit of the headway for a high-frequency service to be 10 min (Ceder & Marguier, Citation1985; Delgado, Munoz, & Giesen, Citation2012; Ding, Chien, & Zayas, Citation2000; Fu & Yang, Citation2002; Lin, Liang, Schonfeld, & Larson, Citation1995; Mazloumi, Mesbah, Ceder, Moridpour, & Currie, Citation2012; O'Flaherty & Mancan, Citation1970; Seddon & Day, Citation1974; Turnquist & Blume, Citation1980). In this paper, high-frequency service is assumed to have a headway of less than or equal to 10 min, and those services with a headway greater than 10 min are considered as low-frequency services.
There is a strong connection between the type of service (schedule-based or frequency-based) and the frequency of service. In actual transit operations, high-frequency services with high demand are usually frequency-based services without a published timetable/schedule (Delgado et al., Citation2012; Nuzzolo & Crisalli, Citation2004; Parast, Citation2012). In contrast, schedule-based services are usually used to serve lower demand areas or periods, which are typical of services with a long headway, and come with a published timetable (Ceder, Citation2001; Furth & Muller, Citation2007, Citation2009; Zhao et al., Citation2006).
2.2. Different types of transit users
To properly model a passenger’s waiting time and the decision on when to arrive at the transit stop, it is important to distinguish among different types of transit services and users. We can categorise transit users into two groups who accordingly experience different arrival patterns at the bus stop and thus waiting time. The first category includes commuting and non-commuting passengers. Transit users are mainly commuters during peak hours and non-commuters during off-peak periods. Depending on the trip purpose or type of work, commuters may have desired arrival time at their destination or not. Commuters with flexible working hours that use transit during the morning-peak period can adjust the time they start work; thus, their arrival time at work is considered flexible. However, the commuters that need to start working at a certain time have a fixed arrival time or equivalently non-flexible working hours. In the case of evening-peak commuters, since the majority of trips are home bound, they usually do not have a fixed arrival time (Ruisanchez & Ibeas, Citation2012), except in the case of trip chaining (e.g. commuters needing to pick up their children). Non-commuters may or may not have fixed arrival time at their destination depending on the purpose of their trip. An example of non-commuter with fixed arrival time are passengers with a medical appointment.
The second category of users are planning and non-planning passengers (see ). De Borger and Fosgerau (Citation2012) define non-planning passengers as those who go to a bus stop at random and usually have to wait. Moreover, planning passengers are defined as those who incur planning costs (time and effort required on the part of passengers to deal with the information provided by transit firms) but do not incur waiting time at stops. The behaviour of non-planning and planning passengers mainly depends on the type of service provided by the operator and is; both commuters and non-commuters may plan or not plan their trips prior to departure depending on the frequency of the service.
Figure 1. Types of passenger based on the types of service.
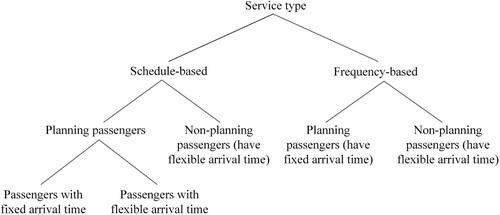
Nuzzolo, Crisalli, and Rosati (Citation2012) defined planning passengers as transit users who have a pre-trip choice of departure time and stop. They considered two different types of planning passengers: (i) those with the desired arrival time at destination (DAT) and (ii) those with the desired departure time from origin (DDT). DAT passengers mainly take home-origin trips and aim to arrive at their destination at a fixed time to start their activities. DDT passengers mainly take home-destination trips and aim to leave from the origin at the end of their activity.
For high-frequency services, it is more likely that passengers arrive at stops randomly even when published and real-time information are available (Chen, Adida, & Lin, Citation2013; Delgado et al., Citation2012; Hounsell et al., Citation2012). Huddart (Citation1974) observed in London that for transit services with short headways, passengers arrive randomly. Similarly, randomly arriving passengers were observed in Leeds (O'Flaherty & Mancan, Citation1970), Manchester (Seddon & Day, Citation1974) and several other cities around the world (van Oort, Citation2014) for headways less than 10 min. In a survey conducted by Rahman, Wirasinghe, and Kattan (Citation2013) in Calgary, the majority of respondents indicated that real-time information does not add much value for service headways that are less than 10 min. Luethi, Weidmann, and Nash (Citation2007) and Ceder and Marguier (Citation1985) reported that for relatively short headways, passengers go to stops randomly; however, for long-headway timetables, they tend to time their arrival and thus do not exhibit random arrival (Gallo, Montella, & D’Acierno, Citation2011). Passengers may even arrive at stops a little bit earlier in the case of less reliable services to decrease the probability of missing the targeted bus (Furth & Muller, Citation2007).
While previous research has discussed planning and non-planning passengers when the service type is schedule-based, no definitions have been suggested for such passengers when service is frequency-based or the frequency of service is high. In this paper, planning passengers are defined as the passengers who know the schedule (if provided) so that they can adjust their departure from the origin to minimise their waiting time. If service is frequency-based, planning passengers still plan their trip when they have a specific arrival time at their destination. They tend to arrive at the stop a full headway in advance of the last possible departure time (equivalently, the desired departure time) in order to arrive at the destination without being late. Based on this definition, regardless of type of service operation, passengers with specific arrival time at their destination are planning passengers (e.g. morning commuters with non-flexible working hours). Non-planning passengers are those who do not check the schedule when the schedule of service is provided. When service is frequency-based, non-planning passengers are those who do not have specific arrival time at their destination. Non-commuters can be either planning passengers or non-planning passengers depending on their trip purpose and whether they have a specific arrival time at destination or not.
3. Mean waiting time: a comprehensive approach
The mean waiting time of passengers is not limited to waiting at the bus stop. In some cases, when passengers have a specific arrival time at their destination, it is likely that they will arrive at their destination earlier than the desired time (Kraft & Wohl, Citation1967; Wohl, Citation1968). In this case, they incur waiting at their destination. Moreover, different types of service can affect the waiting time of passengers. Transit users who have access to published timetables incur less waiting at the origin than the passengers who take a non-scheduled bus with the same headway.
This section covers the waiting time of passengers for possible combinations of passenger type (planning, non-planning, commuters with flexible and non-flexible working hours, and non-commuters) and type of service (schedule-based, frequency-based, high-frequency and low-frequency) for a simple all stop bus route with a fixed headway of H.
3.1. Waiting time based on scheduling of service and passenger type
The waiting times for both planning and non-planning passengers need to be investigated for both schedule-based and frequency-based service to evaluate the impact of planning the trip prior to departure.
3.1.1. Waiting time in schedule-based service
The mean waiting time of different types of passengers, planning and non-planning passengers, using a schedule-based service is represented in . Some assumptions are made to obtain the waiting times: (i) planning passengers plan their trip regardless of the frequency of service, which means that they time their arrival at a stop to minimise their waiting time at the origin, (ii) while planning passengers can avoid waiting at the origin, they may incur waiting time at their destination when they have a specific desired arrival time, and (iii) all services are considered schedule-based including low-frequency and high-frequency service.
Table 1. Mean waiting times for schedule-based service.
When passengers have specific arrival time at destination and also specific departure time from origin, they experience a waiting time between 0 and at the origin; however, depending on the individual departure times and how far it is from the specific arrival time, passengers experience various waiting times at destinations. Thus, it is not possible to measure the mean waiting time of the passengers. Assuming perfect schedule adherence, when planning passengers have specific arrival time at destination and no specific departure time from origin, they check the schedule prior to departure so they incur zero waiting at the stop. However, depending on the travel time between origin and destination, and departure time, they may wait between 0 to H at the destination. Thus, the mean waiting time is
. For example, assume buses are scheduled to depart a stop at 7:10 AM; 7:30 AM, etc. (20 min headway). The in-vehicle travel time to the destination is 30 min, thus, the bus arrives at the destination at 7:40 AM; and 8:00 AM, respectively. Passengers who have scheduled work slightly before 8:00 AM (e.g. 7:59 AM) must take at the latest the 7:10 AM bus and arrive early at 7:40 AM thus incurring a schedule delay of 20 min. Passengers with scheduled work at 8:00 AM can take the bus which departs at 7:30 AM, thus incur no waiting time. Therefore, the mean waiting time based on passengers having various required arrival times is 10 min. Non-planning passengers are assumed to have flexible arrival (i.e. no specific arrival), which explains why the related cell is N/A in .
When non-planning passengers have no specific arrival time at destination but a specific departure time from origin, they depart from the origin without checking the schedule. Since they do not have a specific arrival time, they can start their activity once they get to the destination, thus they incur no waiting at the destination. Therefore, the waiting time at the destination is 0 min, and they wait at the origin between 0 and H in total, which means that the mean waiting time is . This case is not applicable for planning passengers as it contradicts the definition of planning passengers.
Finally, planning passengers with no specific arrival time at destination and no specific departure time from origin experience no waiting at the destination. Moreover, since they check the schedule prior to their departure, they also do not wait at the origin and thus incur no waiting. Non-planning passengers would still experience mean wait time of as they do not check the schedule before arriving to the stop.
3.1.2. Waiting time in frequency-based service
The mean waiting times of passengers that use a frequency-based service are represented in . Similar to the case of schedule-based service, the users of a frequency-based service include planning and non-planning passengers. Planning passengers in a frequency-based service have fixed arrival time at their destination. Examples are commuters with non-flexible working hours and other passengers with an appointment. Non-planning passengers have a flexible arrival time at their destination and therefore go to the stop randomly. An example is commuters with flexible working hours.
Table 2. Mean waiting times for frequency-based service.
The following assumptions apply to frequency-based service: (i) waiting at the origin is unavoidable for all passengers and (ii) all services are considered non-scheduled.
In a frequency-based service, when passengers have specific arrival time and no specific departure time (planning), they cannot avoid waiting at the origin since they only know the service headway and not the departure time. To avoid being late at the destination, they go to the stop a full headway in advance of the last possible departure time. If they board immediately upon arrival at the stop, they would still wait H at the destination. If they just miss a bus, they wait H at the stop, so they will arrive at the destination just in time (with no waiting at the destination). Thus, depending on the arrival time of the first available bus, they incur waiting between 0 and H at the origin and consequently between H and 0 at the destination. In this case, they wait a H in total.
When passengers have no specific arrival time (non-planning) but have specific departure time, similar to the case discussed in Section 3.1.1, passengers incur waiting time between 0 and H at the origin and no waiting at the destination. Therefore, on average they wait . It is assumed that the waiting time of the planning passengers is not defined when they have no specific arrival time. Because, based on the definition in Section 2.2 for planning passengers in a frequency-based service, passengers who do not have specific arrival time at the destination do not plan their trip, thus are considered non-planning passengers. Finally, in the case that passengers have no specific arrival time and no specific departure time, they incur no waiting at the destination. However, since they go to the stop without planning, they may wait between 0 and H at the origin. Therefore, they wait
on average.
The waiting times of passengers under schedule-based and frequency-based services can be compared to evaluate the impact of scheduling. To this end, the average of waiting times for each column in and are presented and compared in .
Table 3. Comparison of the mean waiting times for different service types.
As shown in , scheduling a transit route decreases the mean waiting time of passengers that have “no specific departure time”. However, the mean waiting time for passengers with a “specific departure time” is likely to remain unaffected. The unaffected waiting time is to be expected because when there is a specific departure time from the origin, passengers are more likely to arrive randomly at the stop regardless of the schedule. Passengers with “no specific arrival time at destination and no specific departure time from origin” are the most affected by a schedule where their mean waiting time decreases, on average, as much as 50%. This reduction in the waiting time is also to be expected since these passengers only incur waiting times at the origin. Thus, providing travellers with a schedule enables them to avoid waiting at the origin if the service is reliable. In the case that a scheduled service is not reliable, passengers with specific arrival time may still plan their trip similar to the frequency-based service to avoid being late at destination.
3.2. Waiting time based on frequency of service and passenger type
While the approach to determine the mean waiting time in Section 3.1 is a good reference for possible combinations of passenger type and service type, some of the noted assumptions may not be realistic. For instance, for schedule-based services, the assumption that both low-frequency and high-frequency services are scheduled is not realistic since high-frequency services mostly operate as frequency-based services (Parast, Citation2012). Similarly, for frequency-based services, the assumption that all services are non-scheduled, including low-frequency and high-frequency services, is not realistic; low-frequency services are more likely to operate similar to schedule-based services to reduce the waiting times of passengers arriving at stops.
To address these issues, shows the revised mean waiting times of passengers, where is the proportion of planning passengers based on all passengers and
is the proportion of planning passengers with fixed arrival time based on all planning passengers. The following assumptions are made: (i) in a frequency-based service, planning passengers have fixed arrival time at their destination. In other words, it is not applicable to have planning passengers with flexible arrival time; thus, in a frequency-based service,
, (ii) in the case of high-frequency service, passengers (both planning and non-planning) do not check the schedule even when the service is schedule-based. However, planning passengers plan their trip by going to the stop a full headway in advance of the last possible departure time and (iii) in the case of low-frequency service, planning passengers can have either fixed or flexible arrival time; however, they always check the schedule to avoid waiting at the origin. These assumptions are consistent with the discussion in Section 2.2, and more accurately reflect real situations. The waiting times in are obtained in the same manner as discussed in Sections 3.1.1 and 3.1.2. In , the waiting time obtained for high-frequency and low-frequency services also represents the waiting time of transit users in a frequency-based and a schedule-based service, respectively.
Table 4. Mean waiting times based on service frequency and user characteristics.
The mean waiting time of passengers for both high-frequency and low-frequency services can be obtained as a fraction “K” of the headway (Kocur & Hendrickson, Citation1982; Saidi, Wirasinghe, & Kattan, Citation2016; Wirasinghe, Citation1990). This can be done by multiplying the demand portions by the mean waiting times for all passengers and aggregating them using the information in . In the case of high-frequency service, the value of “K” is shown as and is calculated as follows:
(4a)
(4a)
(4b)
(4b) which results in the following equation:
(4c)
(4c) From Equation (4c), it follows that
, which indicates that the mean waiting time in high-frequency service is greater than half the headway. Similarly, the value of “K” can be calculated for low-frequency service, and is shown as
:
(5a)
(5a)
(5b)
(5b)
(5c)
(5c)
Equation (5c) indicates that , which means that in a schedule-based service, mean waiting time of passengers is less than half the headway.
Note that the information given in could be further expanded assuming that passengers perceive the waiting time at the origin different from waiting at the destination. For instance, while both planning and non-planning passengers wait on average in a schedule-based service, planning passengers incur all the waiting at the destination while non-planning passengers experience all the waiting only at the origin. These estimated mean waiting times should not necessarily be treated equally. Assuming the value of waiting time at the origin and destination as
and
, respectively, a more accurate estimation of the waiting time of planning passengers at the destination,
, could be derived as follows:
(6)
(6) where
is waiting time at the origin. Since
, then,
. Thus, each category of passengers perceives waiting time differently depending on the disutility of waiting at the destination versus waiting at origin. Note that based on for schedule-based services, when
, the mean waiting time for planning passengers with fixed arrival time will converge to the mean waiting time of planning passengers with flexible arrival time. This implies that passengers are not sensitive to the waiting at the destination, and passengers can immediately start the activity upon their arrival. This intuitive interpretation can explain the spectrum of the waiting time consideration for different categories of passengers. For the case of mean waiting time for frequency-based services for passengers with fixed arrival time, passengers will budget a full headway arrival at the stop. Thus, the waiting time should still be the full headway even though part of the waiting time may be spent at the destination.
Empirical studies are required to determine the proportion of planning and non-planning passengers. Such information can traditionally be obtained through manual surveys to identify the purpose and types of trips. With more deployment of transit smart card data, there is an opportunity to infer the type of passengers and trip purpose for individuals. Zhao et al. (Citation2020) and Zhao, Koutsopoulos, and Zhao (Citation2018) have studied individual mobility patterns and travel behaviour through transit data. Given longitudinal observations of individual travel history, including the start/end time, origin/destination and individual identifier of each trip, some behavioural explanation such as spatiotemporal choices and trip purposes can be estimated. Such information can be collected and used in assigning the proportion of passengers with different trip purpose and type (i.e. planning and non-planning passengers). Additionally, such a comprehensive approach can clearly distinguish the underlying assumptions for a more customer-centric transit system design that can vary according to different time of week (weekend/weekday) and day (peak/off-peak).
Passengers in frequency-based services and non-planning passengers in schedule-based services are assumed to arrive at the stop based on a uniform distribution. Planning passengers in schedule-based services are assumed to time their arrival exactly at the vehicle departure time. However, among planning passengers in a schedule-based service, for those with fixed arrival time at destination, the waiting time at destination is a uniformly distributed random variable due to the randomness of the scheduled arrival time of transit and desired arrival time at destination. This uniform distributed waiting time is not because of randomly arrival passengers but because the waiting time is a function of the desired arrival time versus the schedule of the transit service assuming reliable service with uniform headway. These assumptions are valid for the route/network planning phase. However, they should be used carefully in the transit operation phase as passengers’ arrival is neither perfectly uniform nor exactly at the departure time of transit vehicles. In other words, passengers' arrival is a distribution for which the shape depends on the service reliability and passengers' behaviour. Luethi et al. (Citation2007) showed that the arrival pattern of passengers follows a mixture of uniform and Jonson-SB distributions. Gamma and Lognormal distributions were also found to be the best fitted distributions to the passengers' waiting time (Guo, Yu, Chen, & Zhang, Citation2011; Gong, Chen, Yu, & Wu, Citation2016). Recently Ingvardson et al. (Citation2018) found that passengers' waiting time can be best described by a mixture uniform-betta distribution. The mean waiting time of passengers in the case of service unreliability requires further investigation.
4. Mean waiting time in transit studies
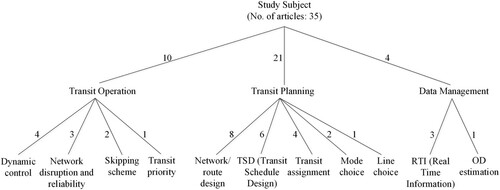
As mentioned in the introduction, different methods have been proposed to determine the mean waiting time of passengers at stops, taking various assumptions into account. An extensive literature review on the most recent transit studies was conducted to examine how waiting time is modelled and what assumptions are considered. To give a comprehensive review, we systematically searched for studies dedicated on waiting time modelling as well as the most recent articles that required modelling the waiting time of passengers for various transit-related researches. Regarding articles dedicated on waiting time modelling, we used Scopus and Web of Science databases. We searched for “wait/waiting time/cost” and “passenger arrival” in title, abstract and keywords. We also extensively employed backward and forward reference searching to find the most related works focusing on modelling passengers waiting time. Regarding the most recent works on transit subjects, we employed both database and journal-based searching. Since the focus was on how recent credible studies deal with the waiting cost modelling, we restrict the scope to articles in English from well-reputed peer-reviewed transportation journals from 2010 to 2019. Peer-reviewed journals considered in the analysis includes: Transportation Science, Transportation Research Part A/B/C/E, Transport Reviews, Public Transport, Journal of Advanced Transportation, Transportation Research Record and Transportmetrica A/B. Overall 77 articles were selected to cover the different approaches in modelling the waiting time. and show the breakdown of the reviewed recent articles based on the operation type and the study subject. The numbers on each edge show the number of articles reviewed on that specific operation type or subject.
Figure 2. Reviewed articles based on the type of operation service.
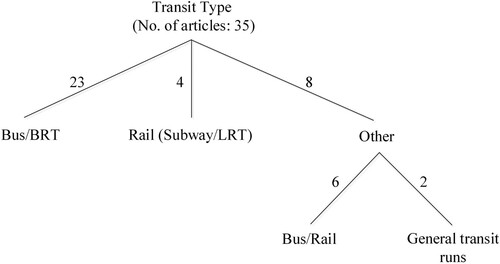
Figure 3. Reviewed articles based on the subject.
4.1. Waiting time for single route assuming a reliable service
The most widely used approach is to consider the mean waiting time of passengers at stops as half the headway, assuming a deterministic headway between the arrival of two successive buses and the random arrival of passengers at stops, represented by Equation (1). Most studies further assumed that each stop can be served by only one route. In some cases, a lack of clear assumptions regarding the type of passenger and service restricted the validity of the half-headway assumption for the mean waiting time to a few specific circumstances.
For example, numerous studies considered half headway as the mean waiting time of passengers when they board the first available bus (Basso & Jara-Díaz, Citation2012; Chen et al., Citation2013; Chiraphadhanakul & Barnhart, Citation2013; Freyss, Giesen, & Muñoz, Citation2013; Gkiotsalitis, Wu, & Cats, Citation2019; Guo, Chen, Schonfeld, & Li, Citation2018; Hörcher & Graham, Citation2018; Li, Lam, & Wong, Citation2012a, Citation2012b; Liu, Yan, Qu, & Zhang, Citation2013; Tian et al., Citation2012; Yu, Yang, Jin, Wu, & Yao, Citation2012). However, no assumptions were made regarding passenger type (fixed or flexible arrival time at destination). Regarding the type of service, in some of these studies either the service type is explicitly mentioned as a high-frequency service (Chen et al., Citation2013; Chiraphadhanakul & Barnhart, Citation2013; Freyss et al., Citation2013; Gkiotsalitis et al., Citation2019) or the headway is considered to be very short (Li, Lam, Wong, & Sumalee, Citation2012b; Yu et al., Citation2012). The rest of the studies assume that passengers' arrival is random and uniformly distributed, which implies either a frequency-based service or a high-frequency service (Basso & Jara-Díaz, Citation2012; Guo et al., Citation2018; Hörcher & Graham, Citation2018; Li et al., Citation2012a; Liu et al., Citation2013; Tian et al., Citation2012). In either case, when commuters have fixed arrival time at their destination, they incur full headway as the mean waiting time, thus the assumption of half-headway waiting time is no longer valid. The assumption of half-headway also is not valid for those non-commuters using high-frequency services to get to their destination on-time.
Similar to the previous group of studies, some studies ignored the waiting time at destinations for schedule-based services and reported zero as the mean waiting time of passengers with fixed arrival time at destinations. For instance, Zhang, Wang, and Meng (Citation2018) assumed that the waiting time of the commuters in the on-demand public bus (ODPB) is zero as the ODBP is schedule-based. While it is not obvious whether passengers are aware of the schedule for the ODPB mode well ahead of their departure, assuming that it is the case, commuters with desired arrival time at their destinations will likely incur zero waiting time at the origin stop but between zero and full headway at the destination which result in half the headway as the mean waiting time.
Another line of studies assumed half the headway as the mean waiting time of the passengers for different frequency of service during a specific or different time of day. Stewart and El-Geneidy (Citation2016) evaluated the benefits of bus stop consolidation, including the impact on mean waiting time (assumed as half the headway) for regular (low-frequency) service and frequent (high-frequency) service during morning peak. In their proposed cost function, Verbas and Mahmassani (Citation2013) also assumed half the headway for a scheduled service, including both low-frequency and high-frequency services, operating with various headways. Similarly, Muñoz et al. (Citation2013) considered the mean waiting time as half the headway for different case studies, including medium-frequency service (off-peak) and high-frequency service (peak), assuming passengers randomly arrive at stops according to Poisson distribution. Verbas, Frei, Mahmassani, and Chan (Citation2015) modelled a bus frequency allocation problem for different times of the day, including AM-peak, midday, PM-peak and off-peak periods. Bus services were considered to have headways between 2.5 min (high-frequency service) and 30 min (low-frequency service) and waiting time were considered half the headway for all. In another study, Sun et al. (Citation2016) considered the mean waiting time as half the headway during different times of day (morning peak, off-peak and evening peak) regardless of different service frequency. In the discussed studies, while the half-headway waiting time assumption is valid for passengers with flexible arrival time taking high-frequency service (which is likely the case during off-peak and PM-peak), it is not true for the majority of commuters (with fixed arrival time) during the AM-peak period who take high-frequency services to reach their destination. Moreover, in the case of low-frequency service, when the schedule is known, the mean waiting time for planning passengers without fixed arrival times at their destination is zero. Therefore, it is not suitable to consider a mean waiting time as half-headway for all of these various situations. Finally, Liu and Ceder (Citation2018) proposed a model for the integrated timetable synchronisation and vehicle scheduling problem, they considered the mean waiting time of the passengers as half the headway assuming randomly arriving passengers, and fixed and short headways. They tested the proposed model for a 1-hour morning peak case study and obtained a variety of service frequencies (from 3/hr. to 6/hr.) for different transit lines of their case study. The assumption of half-headway mean waiting time can be problematic as the mean waiting time can be in the range of zero to full headway depending on the frequency and type of passengers. More specifically, for lower frequencies (3 and 4) transit users tend to check the schedule of the service regardless of their arrival time at their destination. This means that headways are not short enough and the assumption of randomly arriving passengers is violated as they arrive at stops based on a schedule. Depending on whether passengers have flexible or fixed arrival time at their destination, they incur either zero or half a headway as waiting time. Moreover, for relatively short headways passengers with fixed arrival time arrives randomly at stops regardless of the schedule and experience full headway as the waiting time.
In some studies, the mean waiting time in the transit network was overestimated. For instance, De Borger and Fosgerau (Citation2012) estimated a mean waiting time in a schedule-based route for planning and non-planning passengers, which considered both the waiting time at stops and the schedule delay. Defining the schedule delay as deviations between the scheduled arrival time and passengers' preferred arrival time, they assumed that non-planning passengers incur both waiting at stop (assumed as half headway) and the schedule delay (assumed as full headway). They further assumed that planning passengers incur only a schedule delay (full headway). This approach double counts the mean waiting at a stop since the schedule delay includes both the waiting time at the stop and at the destination. Therefore, the approach leads to overestimating the total mean waiting time of passengers. Sáez et al. (Citation2012) considered the mean waiting time of a passenger at a stop as the full headway. The bus service was considered as a high-frequency, frequency-based service and no assumption was made regarding the time of day. While this assumption is valid for commuters with non-flexible working hours, it overestimates the waiting time of commuters with flexible working hours and also the waiting time of non-commuters without a fixed arrival time at their destination, since they incur waiting time of half the headway at origin.
4.2. Discussion on the waiting time in the previous studies
The assumptions used to determine the mean waiting time for the articles reviewed above are summarised in .
Table 5. Classification of waiting times for reviewed articles.
The key findings obtained from our review of the literature are summarised below:
The majority of the previous studies consider only the mean waiting time of passengers at origin and ignore the penalty of early arrival which leads to waiting time at destination when there is a desirable arrival time. Therefore, the waiting time cost component of the generalised cost function is underestimated in many cases.
In some of the studies, the assumption of a half headway as the waiting time can be violated by other assumptions in the model regarding targeted passenger and type of service.
In some cases, a lack of proper assumptions regarding the type of service (schedule-based or frequency-based) and type of passengers (planning/non-planning passengers, commuters/non-commuters) limits the validity of the half-headway assumption for the mean waiting time to specific circumstances.
shows the number of reviewed articles that either underestimate or overestimate the waiting time of passengers or restrict the validity of their proposed model to certain circumstances. Only one of the reviewed papers (Ruisanchez & Ibeas, Citation2012) provided appropriate assumptions to justify the mean waiting time of the passengers.
Table 6. Classification of errors in estimating waiting time.
5. Conclusions
In planning or designing any type of transit system, the cost of waiting time of passengers is an important component of the generalised cost function that needs to be optimised. An accurate and realistic estimation of the mean waiting time of passengers is critical to model a transit system that is designed and operates efficiently. The main contribution of this paper is theoretically demonstrating that proper consideration to transit service type and heterogeneity of passengers and passenger trip purpose are key elements to correctly estimate the value of mean waiting time. New waiting time formulations are developed for all possible combinations of types of passengers (planning/non-planning, commuters/non-commuters) and service types (schedule-based, frequency-based, high-frequency and low-frequency).
In addition, this paper included a comprehensive survey of published transit studies, including both early work on mean waiting time, and more recent literature from 2010 to 2019. Most studies considered half-headway as the mean waiting time of passengers supposedly assuming uniformly random arrival of passengers at bus stops while our analysis showed that this assumption is only valid for certain types of passenger and transit service. While many previous studies considered the waiting time of passengers only at the origin, waiting times also need to be incorporated at both transfer points and the destination, especially when passengers have a specific arrival time. We reviewed recent articles from highly-ranked journals in transit operation and planning and found that 31 out of 35 did not provide enough justification to support the waiting time considered in their models. In these cases, the lack of proper assumptions restricts the validity of their models to only specific situations. The remaining four articles either overestimated the waiting times of passengers or lacked proper assumptions to support their proposed waiting time at transfer points.
In summary, the estimation of mean waiting time of transit passengers is an important and challenging problem that occupies many researchers studying transit systems. Consideration to the transit service type, and passenger characteristics is necessary for properly estimating mean waiting time to result in sound transit network planning and design. The next step in this research is to study the implications of the proposed waiting time model in both classical and recent contributions in transit operation and design literature. How consideration of different transit service type and passenger characteristics employed in the proposed waiting time equation affects model results in transit network planning and design.
Even with perfect information about the next bus/train arrival, many passengers still have to experience waiting time – either at home or at destination – depending on the type of passenger and trip. Sensitivity of passengers to waiting time, however, could be different between bus stop, home and at the destination. The effect of using smart phone for real-time information on the sensitivity of passengers to waiting time is another area of future interest.
Disclosure statement
No potential conflict of interest was reported by the authors.
References
- Amin-Naseri, M. R., & Baradaran, V. (2015). Accurate estimation of average waiting time in public transportation systems. Transportation Science, 49(2), 213–222. doi: https://doi.org/10.1287/trsc.2013.0514
- Basso, L. J., & Jara-Díaz, S. R. (2012). Integrating congestion pricing, transit subsidies and mode choice. Transportation Research Part A: Policy and Practice, 46(6), 890–900.
- Canca, D., Andrade-Pineda, J. L., De los Santos, A., & Calle, M. (2018). The railway rapid transit frequency setting problem with speed-dependent operation costs. Transportation Research Part B: Methodological, 117, 494–519. doi: https://doi.org/10.1016/j.trb.2018.09.013
- Ceder, A. (2001). Bus timetables with even passenger loads as opposed to even headways. Transportation Research Record: Journal of the Transportation Research Board, 1760, 3–9. doi: https://doi.org/10.3141/1760-01
- Ceder, A. A., Hassold, S., & Dano, B. (2013). Approaching even-load and even-headway transit timetables using different bus sizes. Public Transport, 5(3), 193–217. doi: https://doi.org/10.1007/s12469-013-0062-z
- Ceder, A., & Marguier, P. H. (1985). Passenger waiting time at transit stops. Traffic Engineering & Control, 26(6), 327–329.
- Chen, Q., Adida, E., & Lin, J. (2013). Implementation of an iterative headway-based bus holding strategy with real-time information. Public Transport, 4(3), 165–186. doi: https://doi.org/10.1007/s12469-012-0057-1
- Chiraphadhanakul, V., & Barnhart, C. (2013). Incremental bus service design: Combining limited-stop and local bus services. Public Transport, 5(1-2), 53–78. doi: https://doi.org/10.1007/s12469-013-0067-7
- Clerq, F. P. (1972). A public transport assignment method. Verkeerstechniek, Netherlands, 23, 6.
- Daganzo, C. F. (2010). Structure of competitive transit networks. Transportation Research Part B: Methodological, 44(4), 434–446. doi: https://doi.org/10.1016/j.trb.2009.11.001
- De Borger, B., & Fosgerau, M. (2012). Information provision by regulated public transport companies. Transportation Research Part B: Methodological, 46(4), 492–510. doi: https://doi.org/10.1016/j.trb.2011.11.007
- De Gruyter, C., Currie, G., Truong, L. T., & Naznin, F. (2019). A meta-analysis and synthesis of public transport customer amenity valuation research. Transport Reviews, 39(2), 261–283. doi: https://doi.org/10.1080/01441647.2018.1461708
- Delgado, F., Munoz, J. C., & Giesen, R. (2012). How much can holding and/or limiting boarding improve transit performance? Transportation Research Part B: Methodological, 46(9), 1202–1217. doi: https://doi.org/10.1016/j.trb.2012.04.005
- Dial, R. B. (1967). Transit pathfinder algorithm. Highway Research Record, 205.
- Ding, Y., Chien, S., & Zayas, N. (2000). Simulating bus operations with enhanced corridor simulator: Case study of New Jersey transit bus route 39. Transportation Research Record: Journal of the Transportation Research Board, 1731, 104–111. doi: https://doi.org/10.3141/1731-13
- Fonzone, A., & Schmöcker, J. D. (2014). Effects of transit real-time information usage strategies. Transportation Research Record: Journal of the Transportation Research Board, 2417, 121–129. doi: https://doi.org/10.3141/2417-13
- Freyss, M., Giesen, R., & Muñoz, J. C. (2013). Continuous approximation for skip-stop operation in rail transit. Transportation Research Part C: Emerging Technologies, 36, 419–433. doi: https://doi.org/10.1016/j.trc.2013.07.004
- Fu, L., & Yang, X. (2002). Design and implementation of bus-holding control strategies with real-time information. Transportation Research Record: Journal of the Transportation Research Board, 1791, 6–12. doi: https://doi.org/10.3141/1791-02
- Furth, P., & Muller, T. (2007). Service reliability and optimal running time schedules. Transportation Research Record: Journal of the Transportation Research Board, 2034, 55–61. doi: https://doi.org/10.3141/2034-07
- Furth, P. G., & Muller, T. H. (2009). Optimality conditions for public transport schedules with timepoint holding. Public Transport, 1(2), 87–102. doi: https://doi.org/10.1007/s12469-008-0002-5
- Gallo, M., Montella, B., & D’Acierno, L. (2011). The transit network design problem with elastic demand and internalisation of external costs: An application to rail frequency optimisation. Transportation Research Part C: Emerging Technologies, 19(6), 1276–1305. doi: https://doi.org/10.1016/j.trc.2011.02.008
- Gkiotsalitis, K., Wu, Z., & Cats, O. (2019). A cost-minimization model for bus fleet allocation featuring the tactical generation of short-turning and interlining options. Transportation Research Part C: Emerging Technologies, 98, 14–36. doi: https://doi.org/10.1016/j.trc.2018.11.007
- Gong, H., Chen, X., Yu, L., & Wu, L. (2016). An application-oriented model of passenger waiting time based on bus departure time intervals. Transportation Planning and Technology, 39, 424–437. doi: https://doi.org/10.1080/03081060.2016.1160583
- Guo, Q. W., Chen, S., Schonfeld, P., & Li, Z. (2018). How time-inconsistent preferences affect investment timing for rail transit. Transportation Research Part B: Methodological, 118, 172–192. doi: https://doi.org/10.1016/j.trb.2018.10.009
- Guo, S., Yu, L., Chen, X., & Zhang, Y. (2011). Modelling waiting time for passengers transferring from rail to buses. Transportation Planning and Technology, 34, 795–809. doi: https://doi.org/10.1080/03081060.2011.613589
- Hickman, M. D. (2001). An analytic stochastic model for the transit vehicle holding problem. Transportation Science, 35(3), 215–237. doi: https://doi.org/10.1287/trsc.35.3.215.10150
- Holroyd, E. M., & Scraggs, D. A. (1966). Waiting times for buses in Central London. Traffic Engineering and Control, 8(3), 158–160.
- Hörcher, D., & Graham, D. J. (2018). Demand imbalances and multi-period public transport supply. Transportation Research Part B: Methodological, 108, 106–126. doi: https://doi.org/10.1016/j.trb.2017.12.009
- Hossain, M. S., Hunt, J. D., & Wirasinghe, S. C. (2015). Nature of influence of out-of-vehicle time-related attributes on transit attractiveness: A random parameters logit model analysis. Journal of Advanced Transportation, 49(5), 648–662. doi: https://doi.org/10.1002/atr.1297
- Hounsell, N. B., Shrestha, B. P., & Wong, A. (2012). Data management and applications in a world-leading bus fleet. Transportation Research Part C: Emerging Technologies, 22, 76–87. doi: https://doi.org/10.1016/j.trc.2011.12.005
- Huddart, K. (1974). Bus priority in greater London. Bus bunching and regularity of service. Traffic Engineering and Control, 14, 592–594.
- Ingvardson, J. B., Nielsen, O. A., Raveau, S., & Nielsen, B. F. (2018). Passenger arrival and waiting time distributions dependent on train service frequency and station characteristics: A smart card data analysis. Transportation Research Part C: Emerging Technologies, 90, 292–306. doi: https://doi.org/10.1016/j.trc.2018.03.006
- Jolliffe, J. K., & Hutchinson, T. P. (1975). A behavioural explanation of the association between bus and passenger arrivals at a bus stop. Transportation Science, 9(3), 248–282. doi: https://doi.org/10.1287/trsc.9.3.248
- Kocur, G., & Hendrickson, C. (1982). Design of local bus service with demand equilibration. Transportation Science, 16(2), 149–170. doi: https://doi.org/10.1287/trsc.16.2.149
- Kraft, G., & Wohl, M. (1967). New directions for passenger demand analysis and forecasting. Transportation Research, 1(3), 205–230. doi: https://doi.org/10.1016/0041-1647(67)90033-0
- Larsen, O. I., & Sunde, Ø. (2008). Waiting time and the role and value of information in scheduled transport. Research in Transportation Economics, 23(1), 41–52. doi: https://doi.org/10.1016/j.retrec.2008.10.005
- Li, Z. C., Lam, W. H., Wong, S. C., & Sumalee, A. (2012b). Design of a rail transit line for profit maximization in a linear transportation corridor. Transportation Research Part E: Logistics and Transportation Review, 48(1), 50–70. doi: https://doi.org/10.1016/j.tre.2011.05.003
- Li, Z. C., Lam, W. H., & Wong, S. C. (2012a). Modeling intermodal equilibrium for bimodal transportation system design problems in a linear monocentric city. Transportation Research Part B: Methodological, 46(1), 30–49. doi: https://doi.org/10.1016/j.trb.2011.08.002
- Lin, G. S., Liang, P., Schonfeld, P., & Larson, R. (1995). Adaptive control of transit operations. Final report, 15 August 1993-15 June 1995 (No. PB–96-136882/XAB). Maryland Univ., College Park, MD (United States). Dept. of Civil Engineering.
- Lin, Y., Yang, X., Chang, G. L., & Zou, N. (2013). Transit priority strategies for multiple routes under headway-based operations. Transportation Research Record: Journal of the Transportation Research Board, 2356, 34–43. doi: https://doi.org/10.1177/0361198113235600105
- Liu, T., & Ceder, A. A. (2018). Integrated public transport timetable synchronization and vehicle scheduling with demand assignment: A bi-objective bi-level model using deficit function approach. Transportation Research Part B: Methodological, 117, 935–955. doi: https://doi.org/10.1016/j.trb.2017.08.024
- Liu, Z., Yan, Y., Qu, X., & Zhang, Y. (2013). Bus stop-skipping scheme with random travel time. Transportation Research Part C: Emerging Technologies, 35, 46–56. doi: https://doi.org/10.1016/j.trc.2013.06.004
- Luethi, M., Weidmann, U. A., & Nash, A. (2007). Passenger arrival rates at public transport stations. In Transportation Research Board 86th Annual Meeting (No. 07-0635).
- Mazloumi, E., Mesbah, M., Ceder, A., Moridpour, S., & Currie, G. (2012). Efficient transit schedule design of timing points: A comparison of ant colony and genetic algorithms. Transportation Research Part B: Methodological, 46(1), 217–234. doi: https://doi.org/10.1016/j.trb.2011.09.010
- Munizaga, M. A., & Palma, C. (2012). Estimation of a disaggregate multimodal public transport origin–destination matrix from passive smartcard data from Santiago, Chile. Transportation Research Part C: Emerging Technologies, 24, 9–18. doi: https://doi.org/10.1016/j.trc.2012.01.007
- Muñoz, J. C., Cortés, C. E., Giesen, R., Sáez, D., Delgado, F., Valencia, F., & Cipriano, A. (2013). Comparison of dynamic control strategies for transit operations. Transportation Research Part C: Emerging Technologies, 28, 101–113. doi: https://doi.org/10.1016/j.trc.2012.12.010
- Newell, G. F. (1971). Dispatching policies for a transportation route. Transportation Science, 5(1), 91–105. doi: https://doi.org/10.1287/trsc.5.1.91
- Nourbakhsh, S. M., & Ouyang, Y. (2012). A structured flexible transit system for low demand areas. Transportation Research Part B: Methodological, 46(1), 204–216. doi: https://doi.org/10.1016/j.trb.2011.07.014
- Nuzzolo, A., & Comi, A. (2016). Advanced public transport and intelligent transport systems: New modelling challenges. Transportmetrica A: Transport Science, 12(8), 674–699. doi: https://doi.org/10.1080/23249935.2016.1166158
- Nuzzolo, A., & Crisalli, U. (2004). The schedule-based approach in dynamic transit modelling: A general overview. In A. Nuzzolo & N. H. M. Wilson (Eds.), Schedule-based dynamic transit modeling: Theory and applications (pp. 1–24). Boston: Kluwer Academic Publisher.
- Nuzzolo, A., Crisalli, U., & Rosati, L. (2012). A schedule-based assignment model with explicit capacity constraints for congested transit networks. Transportation Research Part C: Emerging Technologies, 20(1), 16–33. doi: https://doi.org/10.1016/j.trc.2011.02.007
- O'Flaherty, C. A., & Mancan, D. O. (1970). Bus passenger waiting times in central areas. Traffic Engineering & Control, 11, 419–421.
- Okrent, M. M. (1974). Effects of transit service characteristics on passenger waiting time (Doctoral dissertation, Northwestern University).
- Osuna, E. E., & Newell, G. F. (1972). Control strategies for an idealized public transportation system. Transportation Science, 6(1), 52–72. doi: https://doi.org/10.1287/trsc.6.1.52
- Parast, A. B. (2012). Transit information systems: Schedules and headways. Retrieved from http://seattletransitblog.com/2012/11/15/transit-information-systems-schedules/
- Rahman, M., Wirasinghe, S. C., & Kattan, L. (2013). Users’ views on current and future real-time bus information systems. Journal of Advanced Transportation, 47(3), 336–354. doi: https://doi.org/10.1002/atr.1206
- Rahman, M. M., Wirasinghe, S. C., & Kattan, L. (2016). The effect of time interval of bus location data on real-time bus arrival estimations. Transportmetrica A: Transport Science, 12(8), 700–720. doi: https://doi.org/10.1080/23249935.2016.1166159
- Ruisanchez, F., & Ibeas, A. (2012). Design of a tabu search algorithm for assigning optimal bus sizes and frequencies in urban transport services. Journal of Advanced Transportation, 46(4), 366–377. doi: https://doi.org/10.1002/atr.1195
- Sáez, D., Cortés, C. E., Milla, F., Núñez, A., Tirachini, A., & Riquelme, M. (2012). Hybrid predictive control strategy for a public transport system with uncertain demand. Transportmetrica, 8(1), 61–86. doi: https://doi.org/10.1080/18128601003615535
- Saidi, S., Wirasinghe, S. C., & Kattan, L. (2016). Long-term planning for ring-radial urban rail transit networks. Transportation Research Part B: Methodological, 86, 128–146. doi: https://doi.org/10.1016/j.trb.2016.01.017
- Schmöcker, J. D., Shimamoto, H., & Kurauchi, F. (2013). Generation and calibration of transit hyperpaths. Transportation Research Part C: Emerging Technologies, 36, 406–418. doi: https://doi.org/10.1016/j.trc.2013.06.014
- Seddon, P. A., & Day, M. P. (1974). Bus passenger waiting times in greater Manchester. Traffic Engineering and Control, 15(9), 442–445.
- Sivakumaran, K., Li, Y., Cassidy, M. J., & Madanat, S. (2012). Cost-saving properties of schedule coordination in a simple trunk-and-feeder transit system. Transportation Research Part A: Policy and Practice, 46(1), 131–139.
- Spiess, H., & Florian, M. (1989). Optimal strategies: A new assignment model for transit networks. Transportation Research Part B: Methodological, 23(2), 83–102. doi: https://doi.org/10.1016/0191-2615(89)90034-9
- Stewart, C., & El-Geneidy, A. (2016). Don’t stop just yet! A simple, effective, and socially responsible approach to bus-stop consolidation. Public Transport, 8(1), 1–23. doi: https://doi.org/10.1007/s12469-015-0112-9
- Sun, H., Wu, J., Wu, L., Yan, X., & Gao, Z. (2016). Estimating the influence of common disruptions on urban rail transit networks. Transportation Research Part A: Policy and Practice, 94, 62–75.
- Szeto, W. Y., & Jiang, Y. (2014). Transit assignment: Approach-based formulation, extragradient method, and paradox. Transportation Research Part B: Methodological, 62, 51–76. doi: https://doi.org/10.1016/j.trb.2014.01.010
- Szeto, W. Y., Jiang, Y., Wong, K. I., & Solayappan, M. (2013). Reliability-based stochastic transit assignment with capacity constraints: Formulation and solution method. Transportation Research Part C: Emerging Technologies, 35, 286–304. doi: https://doi.org/10.1016/j.trc.2011.09.001
- Szeto, W. Y., Solayappan, M., & Jiang, Y. (2011). Reliability-based transit assignment for congested stochastic transit networks. Computer-Aided Civil and Infrastructure Engineering, 26(4), 311–326. doi: https://doi.org/10.1111/j.1467-8667.2010.00680.x
- Tian, Q., Yang, H., & Huang, H. J. (2012). Pareto efficient strategies for regulating public transit operations. Public Transport, 3(3), 199–212. doi: https://doi.org/10.1007/s12469-011-0047-8
- Turnquist, M. A., & Blume, S. W. (1980). Evaluating potential effectiveness of headway control strategies for transit systems (No. 746).
- van Oort, N. (2014). Incorporating service reliability in public transport design and performance requirements: International survey results and recommendations. Research in Transportation Economics, 48, 92–100. doi: https://doi.org/10.1016/j.retrec.2014.09.036
- Van Oort, N. (2016). Incorporating enhanced service reliability of public transport in cost-benefit analyses. Public Transport, 8(1), 143–160. doi: https://doi.org/10.1007/s12469-016-0121-3
- Verbas, İÖ, Frei, C., Mahmassani, H. S., & Chan, R. (2015). Stretching resources: Sensitivity of optimal bus frequency allocation to stop-level demand elasticities. Public Transport, 7(1), 1–20. doi: https://doi.org/10.1007/s12469-013-0084-6
- Verbas, I., & Mahmassani, H. (2013). Optimal allocation of service frequencies over transit network routes and time periods. Transportation Research Record: Journal of the Transportation Research Board, 2334, 50–59. doi: https://doi.org/10.3141/2334-06
- Welding, P. I. (1957). The instability of a close-interval service. Journal of the Operational Research Society, 8, 133–142. doi: https://doi.org/10.1057/jors.1957.21
- Wirasinghe, S. C. (1980). Nearly optimal parameters for a rail/feeder-bus system on a rectangular grid. Transportation Research Part A: General, 14(1), 33–40. doi: https://doi.org/10.1016/0191-2607(80)90092-8
- Wirasinghe, S. C. (1990). Re-examination of Newell’s dispatching policy and extension to a public bus route with many to many time-varying demand. In International Symposium on Transportation and Traffic Theory.
- Wohl, M. (1968). Another view of transport system analysis. Proceedings of the IEEE, 56(4), 446–458. doi: https://doi.org/10.1109/PROC.1968.6335
- Yu, B., Yang, Z. Z., Jin, P. H., Wu, S. H., & Yao, B. Z. (2012). Transit route network design-maximizing direct and transfer demand density. Transportation Research Part C: Emerging Technologies, 22, 58–75. doi: https://doi.org/10.1016/j.trc.2011.12.003
- Zhang, J., Wang, D. Z., & Meng, M. (2018). Which service is better on a linear travel corridor: Park & ride or on-demand public bus? Transportation Research Part A: Policy and Practice, 118, 803–818.
- Zhao, J., Dessouky, M., & Bukkapatnam, S. (2006). Optimal slack time for schedule-based transit operations. Transportation Science, 40(4), 529–539. doi: https://doi.org/10.1287/trsc.1060.0170
- Zhao, Z., Koutsopoulos, H. N., & Zhao, J. (2018). Individual mobility prediction using transit smart card data. Transportation Research Part C: Emerging Technologies, 89, 19–34. doi: https://doi.org/10.1016/j.trc.2018.01.022
- Zhao, Z., Koutsopoulos, H. N., & Zhao, J. (2020). Uncovering spatiotemporal structures from transit smart card data for individual mobility modeling. In A. Constantinos, E. Dimitrios, & C. Emmanouil (Eds.), Demand for emerging transportation systems (pp. 123–149). Amsterdam: Elsevier.