
ABSTRACT
The volume of urban transportation sustainability assessments in academic literature has steadily increased over the last two decades. This paper targets these studies through the first systematic literature review to construct a synthesised and critical overview of how urban transportation sustainability is in fact assessed. The sample consists of 99 peer-reviewed articles retrieved via three scientific search engines. The results reveal a Europe-centric and single-case focus, a strong interest to introduce new indicator systems with limited references to previous work, and a lack of qualitative approaches and stakeholder diversity regarding the assessment methods. Nearly 2400 indicators are identified in the articles with significant variation in their use. Furthermore, the comprehensive accounting for sustainability is often overlooked, and the inconclusive assessment results are often noted by the authors of the sample articles themselves. Our findings signal that the research field is highly fragmented and to some extent fails to accumulate knowledge generated by past studies and to comprehensively operationalise the concept of sustainability. The identified shortcomings of the assessments and their implications for transportation policy-making and planning are highlighted, and based on our results recommendations to develop more reliable, comparable, and inclusive sustainability assessments for the urban transportation sector are made.
1. Introduction
Sustainability assessments and indicators have become key characteristics of urban transportation policy-making and planning worldwide (Gillis, Semanjski, & Lauwers, Citation2016; Jeon & Amekudzi, Citation2005; Litman, Citation2007; Olofsson, Hiselius, & Varhelyi, Citation2016; Pearsall & Pierce, Citation2010; Sultana, Salon, & Kuby, Citation2019). Simultaneously, a growing body of academic urban transportation sustainability assessment literature has emerged.
Sustainable urban transportation systems address social, economic, and environmental issues in a balanced manner, and promote access, affordability, safety, equity, efficiency, and economic viability, while simultaneously minimising their emissions and other environmental impacts (OECD, Citation2002; Pardo, Jiemian, Hongyuan, & Mohanty, Citation2012; Rahman & van Grol, Citation2005; Sdoukopoulos, Pitsiava-Latinopoulou, Basbas, & Papaioannou, Citation2019; Sultana et al., Citation2019). Integrated, long-term, and publicly supported policies are needed to shift towards such sustainable transportation systems and behaviour (Banister, Citation2000, Citation2008; May, Citation2013; Sdoukopoulos et al., Citation2019). Further, policy-making and planning processes require reliable, comprehensive, and applicable frameworks, tools, and indicators to assess and monitor the local situation and the progress that has been made (Jeon & Amekudzi, Citation2005; Olofsson et al., Citation2016; Sdoukopoulos et al., Citation2019).
Currently, different indicator systems represent the dominant approach in urban transportation sustainability planning and policy-making (Olofsson et al., Citation2016; Sdoukopoulos et al., Citation2019). However, a mismatch between the overarching definitions of sustainability and what is implemented in practice exists (Marsden, Kimble, Nellthorp, & Kelly, Citation2010). The utilised assessment methods and indicators often lack comprehensive coverage of the sustainability concept (Jeon & Amekudzi, Citation2005; Marsden et al., Citation2010), and they are rarely developed in cooperation with diverse stakeholders (Banister, Citation2008; Olofsson et al., Citation2016). Additionally, these assessment tools may not be locally applicable, nor the selection of indicators scientifically valid (Olofsson et al., Citation2016). The marginalisation of data is common, and often caused by a focus on easy-to-measure and easy-to-achieve policy objectives, thus excluding the more subjective and qualitative aspects of sustainability that frequently relate to social equity and well-being (Jeon & Amekudzi, Citation2005; Marsden et al., Citation2010; Olofsson et al., Citation2016). Finally, it must also be acknowledged that even a comprehensive set of sustainability indicators does not automatically lead to comprehensive and inclusive policies and planning (Kennedy, Miller, Shalaby, MaClean, & Coleman, Citation2005; Marsden et al., Citation2010).
No systematic literature reviews of urban transportation sustainability assessments have been published to date. While three review articles on similar topics exist (Gillis et al., Citation2016; Nadi & Murad, Citation2017; Sdoukopoulos et al., Citation2019), these reviews are not systematic and the applied literature samples and their analyses are either very narrow (Nadi & Murad, Citation2017) or solely focus on indicators (Gillis et al., Citation2016; Sdoukopoulos et al., Citation2019). This systematic review addresses this gap. The growing body of literature needs to be reviewed in order to identify potential issues in the relationship between the ideal comprehensive definition of sustainability and its hands-on applications in academia. By synthesising and critically examining the trends, and particularly the limitations of the assessments, an overview of the field is constructed, creating a space for discussing the assessments in relation to one another including challenges, best practices, and development needs. Thus, the following research question is posed: How is urban transportation sustainability assessed in academic literature?
2. Conducting a systematic literature review
2.1. Systematic literature review
Systematic literature reviews focus on a clearly defined topic derived from a research question, apply pre-determined criteria for document search and selection (Berrang-Ford, Pearce, & Ford, Citation2015; Cooper & Hedge, Citation1994), and utilise a coherent analytical framework for reviewing the content (Berrang-Ford et al., Citation2015). Furthermore, a synthesis and critical examination of the acquired sample and the results should be embedded (Berrang-Ford et al., Citation2015; Van Wee & Banister, Citation2016).
Bibliometric analysis and qualitative content analysis are often applied together in systematic reviews (Siders, Citation2019). Bibliometric analysis can be used to study, for example, publication types, journal titles, inter-field connections, and frequencies of publications over time (Landauer, Juhola, & Soderholm, Citation2015; Siders, Citation2019). Qualitative content analysis focuses on the context of selected key words and requires manual reading of the analysed content guided by a questionnaire and a coding scheme (Krippendorf, Citation2004; Neuendorf, Citation2002) to achieve a systematic analysis of the sample (Berrang-Ford et al., Citation2015).
In order to answer the research question how urban transportation sustainability is assessed, sets of descriptive and critical sub-questions are applied. First, the descriptive sub-questions focus on the research designs of the studies and cover when and where the research was conducted, which transportation modes are assessed, whether the urban area is addressed partially or as a whole, what cases are applied, what the objects of the assessment are, and what methods and sustainability indicators are applied. Second, the critical sub-questions examine whether new assessment frameworks, tools, or indicator systems are introduced, where the sustainability indicators are sourced from, what limits the use and coverage of the sustainability indicators, and which sample articles comprehensively apply the concept of sustainability. These sub-questions enable a critical analysis of the potential limitations of indicator use, the accumulation of knowledge, as well as the use of diverse and local knowledge, and inclusive and novel approaches in the assessment literature.
2.2. Literature sample selection
2.2.1. Search sequences and search engines
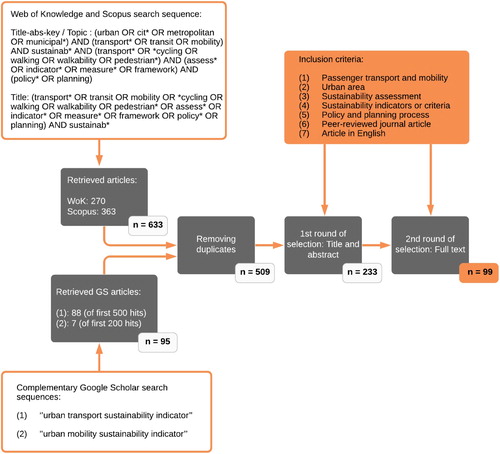
To ensure a representative sample of the literature, three different scientific search engines were used. Scopus and Web of Knowledge (WoK) provide the most extensive scientific article databases in environmental and social sciences (Landauer et al., Citation2015). Google Scholar (GS) was used as a complementary search engine with a looser search sequence. No time frame limitations were set. Scopus and WoK enquiries with the following search sequence were conducted on 25 January 2019:
Title-abs-key / Topic: (urban OR cit* OR metropolitan OR municipal*) AND (transport* OR transit OR mobility) AND sustainab* AND (transport* OR *cycling OR walking OR walkability OR pedestrian*) AND (assess* OR indicator* OR measure* OR framework) AND (policy* OR planning)
Title: (transport* OR transit OR mobility OR *cycling OR walking OR walkability OR pedestrian* OR assess* OR indicator* OR measure* OR framework OR policy* OR planning) AND sustainab*
The search was limited to journal articles and review articles, and it yielded 270 articles for WoK and 363 for Scopus. The complementary GS search was conducted on 30 January 2019 with the following search sequences:
(1) urban transport sustainability indicator
(2) urban mobility sustainability indicator
The GS search was conducted in an incognito window while logged out of all Google accounts (as recommended by Gusenbauer (Citation2019)) to ensure an unbiased order of hits. Due to its unknown retrieval mechanisms, GS is potentially an unpredictable and unreliable single source for literature reviews; however, it is also recognised as a highly multidisciplinary database for scholarly literature (Gusenbauer, Citation2019). Search (1) was limited to the first 500 hits, while search (2) was limited to 200 hits due to the abundant non-transportation related articles and repetition with results from search (1). Together, the GS searches returned 95 new articles. In total, our sample consisted of 509 articles after duplicate removal.
2.2.2. Selection criteria
The selection criteria consisted of the following required article foci (1–5) and characteristics (6–7): (1) Passenger transport and mobility, (2) Urban area, (3) Sustainability assessment, (4) Sustainability indicators or criteria, (5) Policy and planning process, (6) Peer-reviewed journal article, and (7) Article in English.
2.2.3. Selection process
, below, presents the systematic selection process. The criteria-based selection and deselection of extracted articles was divided into two rounds, resulting in the final set of 99 articles.
Figure 1. Systematic literature review sample selection process.
2.3. Analysis of the sample
2.3.1. Coding
Coding was conducted in stages during spring and summer of 2019. First, the authors (referred to as coders) read a subset of 10 articles independently and recorded their findings into separate Excel 2016 workbooks (Microsoft, Redmond, WA, USA). The workbooks only included the pre-coded author, publication year, title, and journal information, alongside the coding framework based on the questionnaire presented in Section 2.1. The two sets of coding were then compared to assess the coding framework and the consistency between the two coders. The compared sets of data were nearly identical enabling the first full round of coding to be carried out with some minor adjustments to the framework. A second full round of coding followed. The results of the two full rounds of coding were consistent and the few individual differences were triple-checked and corrected based on the sample article content. See Supplementary material for final codebook and coding framework.
2.4. Methodological considerations
Due to the highly structured search sequences for WoK and Scopus, it is possible that some relevant articles were excluded (as recognised by e.g. Jurgilevich, Rasanen, Groundstroem, & Juhola, Citation2017). For this reason, the complementary GS search was carried out with a looser keyword formula. Furthermore, our sample was limited to peer-reviewed academic articles and thus excluded all grey literature and its potentially thematically relevant content. The focus on peer-reviewed articles was used to address quality control and reliability of the literature sample (Berrang-Ford et al., Citation2015), as well as to reduce the large sample size.
Coder bias likely presents the most significant potential issue in this analysis (Neuendorf, Citation2002). The bias was controlled for by planning the coding framework collaboratively between the review authors, conducting a limited sample trial coding to expose any initial inconsistencies in the framework when coders worked independently, conducting two full rounds of coding to have two sets of comparable data, and triple-checking the few remaining differences in codes after the second full round of coding.
3. Results
3.1. Bibliometrics
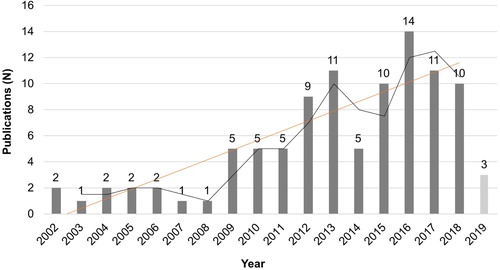
The sample consisted of 99 articles published between the years 2002 and 2019.Footnote1 The average trend line shows a steady overall increase in publications (excluding incomplete 2019 data) over the past 16 years (). The sample is dominated by European research with 44 of the articles coming from European research institutions. Twenty-one are from North America and 20 from Asia. Australian and Oceanian studies account for eight articles in the sample, and South American research for six.
Figure 2. Publications by year.
3.2. Cases, urban spatial scale, and transportation modes
The sample is abundant with cases, consisting mostly of European cities (n = 42), while Asian (n = 24), North American (n = 16), South American (n = 11, mostly Brazilian cities), and Australian and Oceanian (n = 9) cities are to some extent applied. African cities only feature in five articles. Additionally, international and intercontinental comparisons are presented in only a handful of papers.
presents the transportation modes and the urban spatial scale applied in the assessments. Nearly two-thirds (n = 60) of the articles assess all modes at the city level, while private motorised transportation, cycling, and walking are rarely assessed on their own. Notably, walking, or walkability, is always evaluated at the neighbourhood level, and in general, the focus on space distribution and accessibility is emphasised within the neighbourhood context (e.g. Gössling, Schröder, Späth, & Freytag, Citation2016; Machler & Golub, Citation2012). The transportation project studies include assessments of car sharing (Awasthi & Chauhan, Citation2011; Awasthi, Chauhan, & Omrani, Citation2011) and stakeholder preferences in project evaluation (Bulckaen, Keseru, & Macharis, Citation2016), for example.
Table 1. Urban spatial scale and transportation mode. See supplementary material for sample article references. Red=applied >10 times, Orange=applied 5–9 times, Yellow=applied 2–4 times, Grey=applied once.
3.3. Assessment methods
3.3.1. Main methods and data collection methods
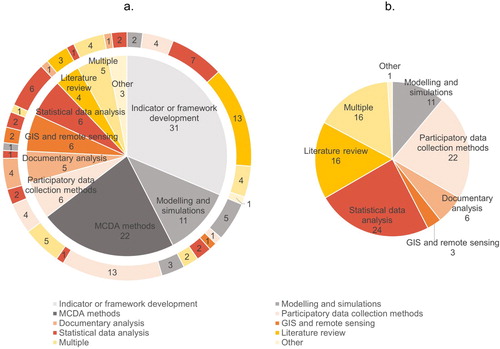
Indicator and framework development and conceptualisation, multiple-criteria decision analysis (MCDA), and modelling dominate the main methods used in the sample (a). Participatory data collection methods, geographic information system (GIS), documentary analysis, and purely statistical data analysis are also applied as primary methods, but to a lesser extent. However, as data collection methods, the statistical data analysis and participatory data collection methods are the most frequently applied (b). MCDA is often coupled with participatory data collection methods (in 13 out of 22 articles), due to the collection of stakeholder preferences that are central to the analysis. Furthermore, literature reviews and statistical analyses are preferred as the data collection methods in the construction of new indicator systems and frameworks. Lastly, multiple data collection methods are applied in 16 articles, and are in many cases combinations of qualitative and quantitative methods, often due to the use of MCDA as the primary method.
Figure 3. Main methods cross-referenced data collection methods on the outer circle (a), and data collection methods on their own (b).
3.3.2. What methods are applied to assess what phenomena?
Indicator or framework development. The conceptual indicator or framework development characterises nearly one-third of the sample. These studies synthesise existing knowledge on transportation sustainability indicators and assessments, and present novel ways to evaluate various aspects of urban transportation systems (). For example, Richardson (Citation2005) introduces frameworks of identified influential transportation system factors and their interactions based on findings from literature and focus groups. Gillis et al. (Citation2016) and Litman (Citation2007) both present comprehensive indicator lists, sourced from previous literature, to aid planning processes. Marsden et al. (Citation2010) discuss the definition of sustainability and develop a framework in collaboration with stakeholders to better account for the comprehensive concept in planning and decision-making. Similarly, Feng and Hsieh (Citation2009) focus on how to better incorporate different stakeholder needs, and the concepts of transport diversity and quality of life, into transportation planning. Indicator development is also at times linked with policy goal evaluation (Black, Paez, & Suthanaya, Citation2002; Figueroa & Ribeiro, Citation2013). Furthermore, many papers aim to select appropriate indicators for service performance assessments (e.g. Haghshenas & Vaziri, Citation2012; Olofsson et al., Citation2016; Reisi, Aye, Rajabifard, & Ngo, Citation2014).
Table 2. Main method applied and object of assessment. See supplementary material for sample article references. Red=applied >10 times, Orange=applied 5–9 times, Yellow=applied 2–4 times, Grey=applied once.
MCDA, modelling, and simulations. MCDA and modelling account for approximately one-third of the applied main methods. Both modelling and MCDA are applied to assess diverse issues within the sample; however, a clear majority of the MCDA articles focus on assessing policies and plans. Al-Atawi, Kumar, and Saleh (Citation2016) survey citizen preferences to evaluate and rank different policies. Curiel-Esparza, Mazario-Diez, Canto-Perello, and Martin-Utrillas (Citation2016), Ngossaha, Ngouna, Archimede, and Nlong (Citation2017), and Oses, Roji, Gurrutxaga, and Larrauri (Citation2017) utilise preferences from experts and local leaders in the transportation planning sector for their analyses of policies and performance. Ha, Joo, and Jun (Citation2011) combine expert opinion with GIS data to study walkability. Castillo and Pitfield (Citation2010) focus on evaluating appropriate indicators and, additionally, Wey and Huang (Citation2018) evaluate policies and indicators that account for increased quality of life in transportation planning. Modelling is generally characterised through the creation of different types of planning tools for the transportation sector (e.g. Curtis & Scheurer, Citation2010; Fedra, Citation2004); however, some papers apply models to assess specific cases, such as policy impacts and strategies (e.g. Haghshenas, Vaziri, & Gholamialam, Citation2015; Jonsson, Citation2008), or service performance (Chen, Bouferguene, Shen, & Al-Hussein, Citation2019; Rajak, Parthiban, & Dhanalakshmi, Citation2016). Machler and Golub (Citation2012) construct a vision for increased transportation access in a low-income neighbourhood using a mix of extensive local knowledge and modelling. Future development is only assessed in two articles (Fedra, Citation2004; Reisi, Aye, Rajabifard, & Ngo, Citation2016) through scenarios, while the built environment is only examined through an infrastructure project in one paper (Mansourianfar & Haghshenas, Citation2018).
Participatory data collection methods. These mostly qualitative methods are not generally used as the primary method. Additionally, they show a trend towards evaluations of citizen-related perceptions. Mameli and Marletto (Citation2014), Marletto and Mameli (Citation2012), and Munira and San Santoso (Citation2017) survey citizen opinions on sustainability indicators and policy objectives. Policies are assessed using expert surveys (Palma Lima, da Silva Lima, & da Silva, Citation2014) and indicator frameworks conceptualised with expert surveys and interviews (Marsden, Kelly, & Snell, Citation2006).
GIS. GIS methods are applied equally in terms of performance (Chen et al., Citation2018; Kwok & Yeh, Citation2004; Wang, Tang, Hu, Chen, & Wang, Citation2015) and built environment evaluations (Gouda & Masoumi, Citation2018; Gössling et al., Citation2016; Lopez-Escolano, Campos, Pardos, Nedeliakova, & Stefanova, Citation2017). These assessments are clearly focused on accessibility, connectivity, liveability, and spatial distribution between different transportation modes.
Statistical data analysis. The statistical papers assess system and service performance, with representation of public transportation (Currie & De Gruyter, Citation2018; De Gruyter, Currie, & Rose, Citation2017), private motorised trips (Moeinaddini, Asadi-Shekari, & Shah, Citation2015), and all modes (Miranda & da Silva, Citation2012; Pinna, Masala, & Garau, Citation2017). Diez, Lopez-Lambas, Gonzalo, Rojo, and Garcia-Martinez (Citation2018), however, statistically evaluate the cost-effectiveness of Sustainable Urban Mobility Plans.
Documentary analysis. This primary method is generally applied when assessing policies and plans, although it is also used to evaluate different green certification systems (Gouda & Masoumi, Citation2017).
Literature reviews. These papers focus on comparisons of assessment techniques (Beria, Maltese, & Mariotti, Citation2012; P. Miller, de Barros, Kattan, & Wirasinghe, Citation2016), indicator conceptualisation (Moayedi et al., Citation2013), and definitions of sustainability (Jeon & Amekudzi, Citation2005).
Multiple/other. This miscellaneous group includes four articles that combine MCDA and modelling as their main methods to assess policies and plans. Other papers include a study of accessibility in relation to travel modes and behaviour using a place rank method (Vega, Citation2012) and a study of citizen perceptions using social media data mining and sentiment analysis (Sdoukopoulos, Nikolaidou, Pitsiava-Latinopoulou, & Papaioannou, Citation2018).
3.4. Assessment indicators
3.4.1. Indicator sourcing
Indicators (used as an umbrella term for indicators, criteria, and other variables applied in the sample to assess sustainability) were mainly sourced from academic literature (n = 42); however, only eight articles (Currie & De Gruyter, Citation2018; De Gruyter et al., Citation2017; Haghshenas et al., Citation2015; Jonsson, Citation2008; Miranda & da Silva, Citation2012; Olofsson et al., Citation2016; Palma Lima et al., Citation2014; Vega, Citation2012) directly state that an existing indicator system was utilised in their assessment. Grey literature was often used in combination with academic literature. Experts, planners, decision-makers, practitioners, citizens, research group members, databases, surveys, and projects present rarely applied sources applied. Notably, citizen knowledge was only utilised three times in combination with other sources (Jones, Tefe, & Appiah-Opoku, Citation2013; Machler & Golub, Citation2012; Whitmarsh, Swartlig, & Jäger, Citation2009) and never on its own.
3.4.2. Indicator catalogue
As the volume of indicators was very large (2396 in total) and indicators overlapped frequently, regrouping and synthesis was necessary.Footnote2 shows the generated catalogue of sustainability indicators and includes the most frequently applied indicators that are referenced on more than 10 occasions. A maximum of five indicators are presented from each thematic group. See supplementary material for a full list of indicators with article references.
Table 3. Thematically grouped indicators (most frequently applied).
The most common indicators fall under the categories of accidents and fatalities, air pollutants, GHG emissions, energy and resource use, and land use. Modal split, motorisation rates, congestion rates, and travel times are also frequently applied, as well as various accessibility measures. Safety and security are considered relatively often, yet the feeling of safety is only examined in a small number of articles.
Environmental sustainability appears to be mostly operationalised through emissions, and to some extent biodiversity and environmental protection. Waste (e.g. recycling of end-of-life vehicles) is, surprisingly, very infrequently applied, alongside indicators such as light disturbance and the number of unresolved environmental cases pending.
Commonly applied social indicators include affordability, quality and access of transportation for the disadvantaged, and public participation in policy-making and planning processes. The ambiguously defined Equity presents one of the most frequently applied social indicators. Many papers list it merely as equity, while some attach it to, for example, air pollution exposure (Jeon, Amekudzi, & Guensler, Citation2010, Citation2013), equity for non-drivers, the disabled, and the low-income population (e.g. Jonsson, Citation2008; Litman & Burwell, Citation2006), or gender (Santos & Ribeiro, Citation2013).
Economic concerns are generally represented through efficiency, traffic levels, and congestion rates, but also through investment and operation expenditure, revenues, and expenses for households and the community. The vague Economic efficiency and development is commonly applied, while some articles utilise more specific indicators, such as, created employment growth in the mobility sector (e.g. Beria et al., Citation2012; Joumard & Nicolas, Citation2010).
Health presents a commonly overlooked theme. In some studies, health impact is applied to generally account for pollution and emission induced health issues, while other studies rely on a similarly general protection and promotion of health indicator. Health hazards, disease burden related to transit, and fatality, injuries and mortality effects resulting from air pollution are all examples of more specific health-related indicators. Additionally, public health benefits from increased physical activity, portion of residents who walk or cycle sufficiently for health, and cycling trips for health represent indicators for derived health benefits from increased physical activity and sustainable mobility.
While Public participation presents the only governance-related indicator in , a rich set of indicators is applied to capture the governance theme (although most are applied only once). Examples of these governance-related indicators include intercity partnerships, transparency and responsibility, efficient use of government resources, information availability and accessibility, public acceptability, training and knowledge for practitioners, and the presence of various actions, policies, and policy integration. Marketing is also accounted for in some articles.
Issues related to comfort and design also receive little attention. Comfort, crowdedness, and cleanliness, for example, are applied in only a small number of articles to analyse public transportation (e.g. Gillis et al., Citation2016; Whitmarsh et al., Citation2009). Safety and attractiveness of the street environment appear most relevant for pedestrians, and include indicators, such as, presence of street lighting and connected and open communities.
Citizen satisfaction and perceptions are not consistently examined throughout the sample; however, some articles do factor them in. A general satisfaction with the transportation system and service is most commonly applied. In particular, Olofsson et al. (Citation2016), Toth-Szabo and Varhelyi (Citation2012), and Sdoukopoulos et al. (Citation2018) extensively apply the citizen satisfaction and perception aspects as related to, for example, congestion, noise disturbance, or public transportation reliability.
Finally, while the majority of articles claim to assess the transportation system as a whole, a preference to focus primarily on public transportation and private motorised vehicles rather than on walking and cycling exists. For example, public transportation indicators are referenced 159 times in total, whereas indicators related to walking only reach 50 references.
3.4.3. Limitations and challenges in indicator use
The results of the assessments were also examined during the first coding round, but due to the high variability in indicator use, and as noted by the authors of the sampled articles, the inconclusiveness of the results, the collection of the results proved meaningless. However, these self-identified limitations were recorded.
The limitations are centred on data availability, and in two cases the inability to process all available data (Campos, Ramos, & Correia, Citation2009; Miranda & da Silva, Citation2012). Additionally, Alonso, Monzon, and Cascajo (Citation2015) and Cavalcanti, Limont, Dziedzic, and Fernandes (Citation2017) mention the measurability, reliability, and feasibility of data as limiting factors. Reisi et al. (Citation2014) also specifically note that citizen satisfaction, quality of transportation options, quality of transportation for the disadvantaged and the disabled, noise exposure, and cost of parking could not be evaluated due to lack of appropriate data.
Indicator-related relevance, sensitivity, measurability, independence, applicability, and standardisation for comparability present limiting factors in several articles (Chakhtoura & Pojani, Citation2016; Haghshenas & Vaziri, Citation2012; Mansourianfar & Haghshenas, Citation2018; Zito & Salvo, Citation2011). Additionally, Jain and Tiwari (Citation2017) note that indicators must be linked to policy actions, whereas overlapping indicators are ruled out by Moeinaddini et al. (Citation2015). Selecting only the top-ranking indicators based on stakeholder weightings (Castillo & Pitfield, Citation2010; Shiau & Liu, Citation2013; Wey & Huang, Citation2018), temporal scale criteria (Jain & Tiwari, Citation2017; Mansourianfar & Haghshenas, Citation2018), and relevance to local or regional contexts (e.g. Jeon et al., Citation2010, Citation2013) present other restrictions.
3.5. Comprehensive, diverse, and inclusive sustainability assessments – progressive approaches
33 sample articles apply indicators from at least the environmental, economic, and social dimensions, while additionally accounting for qualitative social aspects as a particular focus. In most cases they also utilise diverse sourcing for indicators. Using this as criteria, a sub-sample of progressive examples of urban transportation sustainability assessments in terms of comprehensive application of the sustainability concept was identified.
The articles are organised into four groups based on the issue they assess. This sub-sample was analysed exactly like the rest of the sample, but due to the added value as exemplar approaches, they are highlighted here with more descriptive details.
3.5.1. Finding the appropriate indicators and assessment techniques
The articles in focus on suitable indicator selection, and primarily investigate the transportation system as a whole at the city level. These frameworks or indicators aim to rectify narrow definitions and applications of sustainability, with many articles highlighting liveability, quality of life, communities, and the needs of the most vulnerable citizen groups.
Table 4. Sub-sample articles (1/4) evaluating indicator suitability.
Local planners and experts are included in the indicator selection process in several articles (Ramani, Zietsman, Gudmundsson, Hall, & Marsden, Citation2011; Ramani, Zietsman, Ibarra, & Howell, Citation2013; Toth-Szabo & Varhelyi, Citation2012), and the importance of local context, and data availability and quality is often promoted. The majority of papers rely on literature reviews to generate the data for suitable indicator selection but, for example, Castillo and Pitfield (Citation2010) and Wey and Huang (Citation2018) both apply MCDA in their analysis. In a case study of suitable indicators for Mumbai, India, Nathan and Reddy (Citation2013) emphasise the need to include areas of rapid urbanisation into the sustainable transportation assessment and planning field. Cottrill and Derrible (Citation2015) focus on big data and the possibility to improve sustainability assessment through new technologies that provide increasingly reliable, personalised, and real-time data. Prevailing data availability issues are also highlighted by Ramani et al. (Citation2013) and Toth-Szabo and Varhelyi (Citation2012), stating that the actual operationalisation of some indicators is currently unrealistic and further research is required.
3.5.2. Assessing system performance and the built environment
lists the articles that focus on system performance and physical infrastructure. Performance is assessed at the city level for all modes in every performance study (Haghshenas & Vaziri, Citation2012; Miranda & da Silva, Citation2012; Olofsson et al., Citation2016; Rajak et al., Citation2016; Shah, Manaugh, Badami, & El-Geneidy, Citation2013), while the built environment is assessed through a project (Jones et al., Citation2013) and at the neighbourhood level (Mansourianfar & Haghshenas, Citation2018). The methods applied in this group of papers are varied, but all of them introduce a novel assessment framework.
Table 5. Sub-sample articles (2/4) evaluating performance and infrastructure.
Two large-N international comparisons are included in this group (Haghshenas & Vaziri, Citation2012; Shah et al., Citation2013). Jones et al. (Citation2013) present a localised sustainability score assessment framework for urban transportation projects in developing countries, and it incorporates both scientific and indigenous knowledge. Local decision-makers, planners, and system providers are also included in the indicator sourcing process in some of the other articles in this sub-sample (Jones et al., Citation2013; Miranda & da Silva, Citation2012; Rajak et al., Citation2016).
3.5.3. Evaluating policies and plans
Papers in evaluate transportation policies and plans. Most include all modes at the city level, but there is also an analysis of a city district (Wann-Ming, Citation2019), and three project-level studies (Awasthi et al., Citation2011; Awasthi & Chauhan, Citation2011; Bulckaen et al., Citation2016). A clear majority apply MCDA as their main method. However, documentary analysis is applied by Chakhtoura and Pojani (Citation2016) in a study of transportation plans and media articles in Paris, and also by Jeon and Amekudzi (Citation2005) in an international review of transportation initiatives that examines the definition, indicators, and metrics of sustainability. Surveying transportation planning experts is included in the analysis of policy actions by Palma Lima et al. (Citation2014), as well as in the MCDA procedures in other papers.
Table 6. Sub-sample articles (3/4) evaluating policies and plans.
All these papers include diverse sustainability dimensions and indicators in their analyses. Additionally, quality of life is again emphasised by Wann-Ming (Citation2019) in terms of integration with growth management principles, which have emerged in Taipei City, to facilitate the creation of friendly, accessible, and sustainable living environments.
3.5.4. Focusing on citizen perceptions, satisfaction, and behaviour
The papers in assess citizen perception, preferences, and behaviour. All papers apply a system-level approach to transportation modes and include the urban area as a whole, except for Machler and Golub (Citation2012) who focus on a single low-income neighbourhood. Additionally, Sdoukopoulos et al. (Citation2018) position their evaluation of citizen perceptions towards new suitable indicators and the use of social media and big data in transportation assessments. As expected, this group shows a concentration of participatory data collection methods. Surveys, focus groups, and workshops with citizens and experts are strongly represented in these studies, while stakeholder dialogue analysis (Marletto & Mameli, Citation2012) and data-mining combined with sentiment analysis (Sdoukopoulos et al., Citation2018) are also applied.
Table 7. Sub-sample articles (4/4) assessing citizen perceptions.
Indicator sourcing in this group is the most diverse, with many articles using experts, planners, decision-makers, and citizens in their selection processes. Furthermore, diverse stakeholder engagement and the local context is emphasised throughout these articles.
4. Discussion
The growing body of urban transportation sustainability assessment literature is systematically examined for the first time in this review. A critical overview of the applied research designs, the identified progressive approaches, as well as common drawbacks in the field based on 99 academic articles is produced. To summarise, a clear bias towards the global North exists, single cases are more common than comparisons, and the focus is mostly on motorised transportation as compared to walking and cycling. Additionally, there is a tendency to introduce new assessment indicators and frameworks with very limited references to existing assessment tools, indicator use is highly varied and often limited by data availability, and lastly both the indicator sourcing and stakeholder involvement are narrow. Most importantly and alarmingly, it is evident that urban transportation sustainability is evaluated in countless ways with no common baseline or minimum requirements for the application of the sustainability concept.
Next, we discuss (in Section 4.1) the mismatch between the comprehensive concept of sustainability and its narrow applications in the assessments (stemming from the limitations and high variety in indicator use and data coverage, and the few references to existing assessment tools); (in Section 4.2) the limited use of diverse knowledge and participatory approaches in the assessment literature (derived from limited utilisation of local expert and citizen knowledge, low representation of cases and research from the Global South, and exclusion of qualitative and social aspects of sustainability); and (in Section 4.3) the resulting incomplete, unreliable, and ambiguous assessment results followed by future research needs. These topics critically represent how urban transportation sustainability is assessed in academia, embody the central issues in the assessments, and establish future research directions.
4.1. Persisting definition deficit of sustainability
The field of transportation sustainability assessment literature appears to proceed on two tracks. One body of work produces an increasing volume of assessment methods and indicators, while the other debates the persisting definition deficit of sustainability in transportation research and the resulting implications for planning and decision-making. Particularly evident is the mismatch between a conceptually comprehensive sustainability assessment framework and its implementation into practice (Marsden et al., Citation2010; Marsden & Reardon, Citation2017; Olofsson et al., Citation2016; Sultana et al., Citation2019). The literature calls for the development of more comprehensive assessment tools and indicators (e.g. Olofsson et al., Citation2016); however, concerns over the academic understanding of their real-life use in policy and planning continue to be raised (e.g. Marsden & Reardon, Citation2017). Our findings of limited, narrow, and varied indicator use corroborate with these statements.
The dominance of easy-to-measure aspects of sustainability has been identified both in the literature (Jeon & Amekudzi, Citation2005; Marsden et al., Citation2010) and in practice (Cottrill & Derrible, Citation2015). This is also evident in the volume and frequency of use of indicators identified in this review, as quantitative sustainability aspects are assessed significantly more often than the qualitative – in particular social and socio-economic – aspects. Moreover, many of these qualitative and socio-economic issues are referenced on a more general level (e.g. equity) and are infrequently addressed in detail. Similarly, health is mostly included in these assessments through quantitative exposures to pollution and not through e.g. benefits acquired in increased physical activity. Our analysis also reveals many qualitative environmental indicators that currently receive little attention. Moreover, the results demonstrate a dominance of public transportation and private motorised transportation indicators over cycling and walking, even in studies that cover the transportation system as a whole.
As sustainability becomes a policy goal for urban areas globally, cities can deliberately select indicators and measures that easily achieve a result that presents a positive view (Toth-Szabo & Varhelyi, Citation2012). Marsden et al. (Citation2010) emphasise that the uncertainties embedded in the planning and policy-making processes should not automatically affect the comprehensive operationalisation of sustainability in local goals and strategies. We draw similar conclusions, as a quarter of the studies in our sample do not apply all of the indicators identified as relevant in their assessments. Data availability is commonly stated as a challenge for diverse indicator use, as also noted by Sdoukopoulos et al. (Citation2019).
Our results show that although many studies discuss new indicators and assessment techniques, they do not operationalise them into novel data collection methods to ensure improved data coverage. Only two sample articles (Cottrill & Derrible, Citation2015; Sdoukopoulos et al., Citation2018) clearly focus on innovative and improved data generation techniques. These techniques employ social media, GIS technology, and applications of big data in new indicator development. Data availability and quality should be linked to the indicator selection more effectively, as highlighted in the sub-sample articles (Section 3.5.1). Restricted indicator use leads to inconclusive and distorted results that can then prompt the development of policies and plans that do not account for sustainability as a whole (Kaur & Garg, Citation2019; Olofsson et al., Citation2016; Pearsall & Pierce, Citation2010; Sdoukopoulos et al., Citation2019).
4.2. Stakeholder and knowledge marginalisation
Based on our results, the qualitative and social aspects of urban transportation sustainability tend to be marginalised in assessments due to limited data collection resources (as noted by e.g. Cottrill and Derrible (Citation2015), too), which then contributes to the marginalisation of diverse local voices in transportation assessments, planning, and decision-making. Further, the locally participatory approaches appear extremely scarce, marginalising the pool of knowledge included in sustainability assessments further.
This review clearly shows the marginalisation of citizens in both the indicator selection processes and the assessments themselves. Even though MCDA – which includes stakeholders when establishing assessment criteria for policy measures – presents a popular research approach in the sample, the studies tend to mainly focus on experts from academia and the planning and policy-making sectors. Only a handful of studies either evaluate citizen perceptions or employ citizen knowledge. Our findings thus align with the conclusions of previous studies that demonstrate the neglect of diverse local and expert knowledge (Marsden et al., Citation2010; Tennoy, Hansson, Lissandrello, & Naess, Citation2016).
Moreover, this review identifies a shortage of institutions engaging in sustainable transportation research, as well as a lack of cases that focus on the Global South (as also found by Sdoukopoulos et al. (Citation2019)). These are critical omissions given that rapid urbanisation is increasing the pressure on existing transportation systems and the demand for expanded public transportation services, in particular. In the Global South, the need for support in sustainability planning is thus growing as increases in traffic and the related health impacts become more and more visible, and sustainability should be introduced early in the planning and research processes as a guiding concept and policy goal (Nathan & Reddy, Citation2013; Pojani & Stead, Citation2015).
To summarise, as urban transportation policy goals are context specific, selected indicators should reflect the varying local concerns and employ local knowledge (Marsden et al., Citation2010). Stakeholder participation has been defined as a sustainability principle as it increases the utilisation of diverse knowledge and supports the inclusion of the local context (Castillo & Pitfield, Citation2010). Public acceptance and support are essential when implementing successful policies and intended behavioural changes (Banister, Citation2008), and, for this reason, the research should address public concerns and support a comprehensive view of the pertinent issues (Litman, Citation2007; Miller, Witlox, & Tribby, Citation2013). Acknowledging varying local conditions is essential for the production of accurate and meaningful sustainability assessments (Marsden et al., Citation2010; Sdoukopoulos et al., Citation2019). However, even when diverse knowledge and comprehensive indicators are applied, a perfect assessment does not equal perfect planning (Kennedy et al., Citation2005). The selection of indicators presents a challenge for local planners and policy-makers (Olofsson et al., Citation2016), and the selection process requires clearly defined policy goals and criteria, alongside diverse stakeholder involvement (Litman, Citation2007; McCool & Stankey, Citation2004; Olofsson et al., Citation2016; Pearsall & Pierce, Citation2010; Sdoukopoulos et al., Citation2019), and scientific support (Olofsson et al., Citation2016) to avoid assessment results that are easily manipulated by the chosen sustainability indicators (Litman, Citation2007).
4.3. Inconclusive assessment results
The identified shortcomings discussed above, specifically the limited use of indicators, data, diverse stakeholders, and participatory methods, lead to the marginalisation of many relevant sustainability aspects. This in turn generates incomplete, unreliable, and incomparable results. The assessment results of the sample articles were initially recorded with a plan to gather a set of data on worldwide city transportation sustainability. However, the results did not provide any meaningful comparisons due to the varied indicators, data limitations, and the inconclusive results as identified by the sample article authors.
Although initially unexpected, this finding corroborates the concerns related to the fragmented field and the definition deficit of sustainability. We do not however argue for one universally applicable solution (as also noted by Sdoukopoulos et al. (Citation2019), and Pojani and Stead (Citation2015)) that would enable comparisons but simultaneously most likely lose the local context and relevance. Instead, the persisting problems between the definition and operationalisation of sustainability are identified. The fragmented field has, first, failed to address and reconcile the data availability issues that limit indicator coverage and lead to incomplete results, and second, move towards the extensively discussed comprehensive conceptualisations of sustainability alongside diverse stakeholder involvement. Currently, the assessment literature is producing large volumes of case-based and data availability driven research, that appear nearly devoid of purpose from the sustainability point-of-view.
4.4. Future research needs
Our findings raise concerns regarding the non-cumulative nature of the assessment literature and strongly signal a need to establish a baseline of some sort for the assessments. Changes are required to address the more significant weaknesses and to drive the sustainability assessments forward in terms of quality, reliability, comparability, and inclusiveness. These changes include new data collection methods, participatory approaches, and some common minimum requirements for assessments. Special attention must also be given to indicator coverage, inclusion of local context, and a threshold system for monitoring and comparing cases over periods of time. The United Nations Sustainable Development Goals were set to address such issues through unified sustainability indicators, but even these indicators have been found to be to some extent locally inapplicable, irrelevant, producing negative effects if applied alone, and lacking outcome and policy databases to ensure comparability and support for the exchange of best practices (Hansson, Arfvidsson, & Simon, Citation2019; Rozhenkova, Allmang, Ly, Franken, & Heymann, Citation2019).
Efforts to develop new methods to generate data are needed, particularly with the help of diverse stakeholders, the promises of big data, and real-time GIS techniques. This is of particular importance when identifying context-specific indicators and including social aspects in the assessments (Cottrill & Derrible, Citation2015). While the current methods are abundant and diverse, they remain separate and incomparable for the most part. For this reason, they are insufficient when presenting a consistent key set of indicators (Steg & Gifford, Citation2005), and when capturing a global view of transportation sustainability and best practices (Gillis et al., Citation2016). It is clear that there is a need to construct a more coherent baseline to better track, compare, and support the progress towards sustainable transportation systems in urban areas.
5. Conclusions
While the assessment literature continues its steady growth, our findings raise questions over how the knowledge is gathered and assimilated. The findings also highlight the need for an overall improvement in the quality and reliability of these evaluations. Academic literature does not provide conclusive assessment results, even with the abundant assessment methods and indicators, as the studies do not comprehensively account for the complexity of sustainability. A focus on local conditions, and the variation in indicator use and applied methods, is necessary to meaningfully assess single cities based on their unique characteristics. However, there is also a clear need for a common baseline to define what constitutes sustainability. The current situation provides no opportunity for comparisons, and the sharing of best practices in local planning and policy-making is also challenged by the loose interpretations of sustainability. By identifying trends and pitfalls, and presenting an indicator catalogue alongside a set of progressive articles that emphasise comprehensive, diverse, and inclusive approaches to sustainability assessments, this review provides an overview of the field and creates an initial baseline and a platform for improving assessment reliability and coverage. Future research needs to increase the focus on establishing a set of common criteria for the assessments, improve participation and local knowledge utilisation, develop a focus on urban areas (particularly in the Global South), and identify new ways to generate data to prevent the exclusion of essential indicators.
Supplementary_Material
Download MS Word (226.1 KB)Acknowledgements
We thank the three anonymous reviewers for their valuable suggestions and comments.
Disclosure statement
No potential conflict of interest was reported by the author(s).
Additional information
Funding
Notes
1 The annual sub-sample for 2019 is incomplete as the systematic searches were conducted early in the year. Therefore, the volume of publications for 2019 should be treated as incomplete in relation to publication trends.
2 The indicator regrouping was performed manually in Excel 2016 under thematically cohesive groups of indicators that emerged from the dataset. Similar indicators were merged together if they measured exactly the same phenomenon.
References
- Al-Atawi, A. M., Kumar, R., & Saleh, W. (2016). Transportation sustainability index for Tabuk city in Saudi Arabia: An analytic hierarchy process. Transport, 31(1), 47–55. doi:https://doi.org/10.3846/16484142.2015.1058857
- Alonso, A., Monzon, A., & Cascajo, R. (2015). Comparative analysis of passenger transport sustainability in European cities. Ecological Indicators, 48, 578–592. doi:https://doi.org/10.1016/j.ecolind.2014.09.022
- Awasthi, A., & Chauhan, S. S. (2011). Using AHP and Dempster-Shafer theory for evaluating sustainable transport solutions. Environmental Modelling & Software, 26(6), 787–796. doi:https://doi.org/10.1016/j.envsoft.2010.11.010
- Awasthi, A., Chauhan, S. S., & Omrani, H. (2011). Application of fuzzy TOPSIS in evaluating sustainable transportation systems. Expert Systems with Applications, 38(10), 12270–12280. doi:https://doi.org/10.1016/j.eswa.2011.04.005
- Banister, D. (2000). Sustainable urban development and transport – a Eurovision for 2020. Transport Reviews, 20(1), 113–130. doi:https://doi.org/10.1080/014416400295365
- Banister, D. (2008). The sustainable mobility paradigm. Transport Policy, 15(2), 73–80. doi:https://doi.org/10.1016/j.tranpol.2007.10.005
- Beria, P., Maltese, I., & Mariotti, I. (2012). Multicriteria versus cost benefit analysis: A comparative perspective in the assessment of sustainable. European Transport Research Review, 4, 137–152.
- Berrang-Ford, L., Pearce, T., & Ford, J. D. (2015). Systematic review approaches for climate change adaptation research. Regional Environmental Change, 15(5), 755–769. doi:https://doi.org/10.1007/s10113-014-0708-7
- Black, J. A., Paez, A., & Suthanaya, P. A. (2002). Sustainable urban transportation: Performance indicators and some analytical approaches. Journal of Urban Planning and Development, 128(4), 184–209. doi:https://doi.org/10.1061/(Asce)0733-9488(2002)128:4(184)
- Bulckaen, J., Keseru, I., & Macharis, C. (2016). Sustainability versus stakeholder preferences: Searching for synergies in urban and regional mobility measures. Research in Transportation Economics, 55, 40–49. doi:https://doi.org/10.1016/j.retrec.2016.04.009
- Campos, V. B. G., Ramos, R. A. R., & Correia, D. D. E. S. (2009). Multi-criteria analysis procedure for sustainable mobility evaluation in urban areas. Journal of Advanced Transportation, 43(4), 371–390. doi:https://doi.org/10.1002/atr.5670430403
- Castillo, H., & Pitfield, D. E. (2010). ELASTIC – A methodological framework for identifying and selecting sustainable transport indicators. Transportation Research Part D-Transport and Environment, 15(4), 179–188. doi:https://doi.org/10.1016/j.trd.2009.09.002
- Cavalcanti, C. D. O., Limont, M., Dziedzic, M., & Fernandes, V. (2017). Sustainability assessment methodology of urban mobility projects. Land Use Policy, 60, 334–342. doi:https://doi.org/10.1016/j.landusepol.2016.11.005
- Chakhtoura, C., & Pojani, D. (2016). Indicator-based evaluation of sustainable transport plans: A framework for Paris and other large cities. Transport Policy, 50, 15–28. doi:https://doi.org/10.1016/j.tranpol.2016.05.014
- Chen, Y., Bouferguene, A., Li, H. X., Liu, H. X., Shen, Y. H., & Al-Hussein, M. (2018). Spatial gaps in urban public transport supply and demand from the perspective of sustainability. Journal of Cleaner Production, 195, 1237–1248. doi:https://doi.org/10.1016/j.jclepro.2018.06.021
- Chen, Y., Bouferguene, A., Shen, Y. H., & Al-Hussein, M. (2019). Assessing accessibility-based service effectiveness (ABSEV) and social equity for urban bus transit: A sustainability perspective. Sustainable Cities and Society, 44, 499–510.
- Cooper, H., & Hedge, L. V. (1994). The handbook of research synthesis. New York: Sage.
- Cottrill, C. D., & Derrible, S. (2015). Leveraging big data for the development of transport sustainability indicators. Journal of Urban Technology, 22(1), 45–64. doi:https://doi.org/10.1080/10630732.2014.942094
- Curiel-Esparza, J., Mazario-Diez, J. L., Canto-Perello, J., & Martin-Utrillas, M. (2016). Prioritization by consensus of enhancements for sustainable mobility in urban areas. Environmental Science & Policy, 55, 248–257. doi:https://doi.org/10.1016/j.envsci.2015.10.015
- Currie, G., & De Gruyter, C. (2018). Exploring links between the sustainability performance of urban public transport and land use in international cities. Journal of Transport and Land Use, 11(1), 325–342. doi:https://doi.org/10.5198/jtlu.2018.957
- Curtis, C., & Scheurer, J. (2010). Planning for sustainable accessibility: Developing tools to aid discussion and decision-making. Progress in Planning, 74, 53–106. doi:https://doi.org/10.1016/j.progress.2010.05.001
- De Gruyter, C., Currie, G., & Rose, G. (2017). Sustainability measures of urban public transport in cities: A world review and focus on the Asia/Middle East Region. Sustainability, 9(1). doi:https://doi.org/10.3390/su9010043
- Diez, J. M., Lopez-Lambas, M. E., Gonzalo, H., Rojo, M., & Garcia-Martinez, A. (2018). Methodology for assessing the cost effectiveness of Sustainable Urban Mobility Plans (SUMPs): The case of the city of Burgos. Journal of Transport Geography, 68, 22–30. doi:https://doi.org/10.1016/j.jtrangeo.2018.02.006
- Fedra, K. (2004). Sustainable urban transportation: A model-based approach. Cybernetics and Systems, 35(5-6), 455–485. doi:https://doi.org/10.1080/01969720490451779
- Feng, C. M., & Hsieh, C. H. (2009). Implications of transport diversity for quality of life. Journal of Urban Planning and Development, 135(1), 13–18. doi:https://doi.org/10.1061/(Asce)0733-9488(2009)135:1(13)
- Figueroa, M. J., & Ribeiro, S. K. (2013). Energy for road passenger transport and sustainable development: Assessing policies and goals interactions. Current Opinion in Environmental Sustainability, 5(2), 152–162.
- Gillis, D., Semanjski, I., & Lauwers, D. (2016). How to monitor sustainable mobility in cities? Literature review in the frame of creating a set of sustainable mobility indicators. Sustainability, 8(1). doi:https://doi.org/10.3390/su8010029
- Gössling, S., Schröder, M., Späth, P., & Freytag, T. (2016). Urban space distribution and sustainable transport. Transport Reviews, 36(5), 659–679. doi:https://doi.org/10.1080/01441647.2016.1147101
- Gouda, A. A., & Masoumi, H. E. (2017). Sustainable transportation according to certification systems: A viability analysis based on neighborhood size and context relevance. Environmental Impact Assessment Review, 63, 147–159. doi:https://doi.org/10.1016/j.eiar.2016.10.005
- Gouda, A. A., & Masoumi, H. E. (2018). Compactness, connectivity, and walking accessibility on the neighborhood level according to sustainability certifications: Improvement or downgrade? A case study of Cairo, Egypt. Journal of Geographical Systems, 20(4), 413–449. doi:https://doi.org/10.1007/s10109-018-0272-7
- Gusenbauer, M. (2019). Google Scholar to overshadow them all? Comparing the sizes of 12 academic search engines and bibliographic databases. Scientometrics, 118(1), 177–214. doi:https://doi.org/10.1007/s11192-018-2958-5
- Ha, E., Joo, Y., & Jun, C. (2011). An empirical study on sustainable walkability indices for transit-oriented development by using the analytical network process approach. International Journal of Urban Sciences, 15(2), 137–146.
- Haghshenas, H., & Vaziri, M. (2012). Urban sustainable transportation indicators for global comparison. Ecological Indicators, 15(1), 115–121. doi:https://doi.org/10.1016/j.ecolind.2011.09.010
- Haghshenas, H., Vaziri, M., & Gholamialam, A. (2015). Evaluation of sustainable policy in urban transportation using system dynamics and world cities data: A case study in Isfahan. Cities, 45, 104–115. doi:https://doi.org/10.1016/j.cities.2014.11.003
- Hansson, S., Arfvidsson, H., & Simon, D. (2019). Governance for sustainable urban development: The double function of SDG indicators. Area Development and Policy, 4(3), 217–235. doi:https://doi.org/10.1080/23792949.2019.1585192
- Jain, D., & Tiwari, G. (2017). Sustainable mobility indicators for Indian cities: Selection methodology and application. Ecological Indicators, 79, 310–322. doi:https://doi.org/10.1016/j.ecolind.2017.03.059
- Jeon, C. M., & Amekudzi, A. (2005). Addressing sustainability in transportation systems: Definitions, indicators, and metrics. Journal of Infrastructure Systems, 11(1), 31–50. doi:https://doi.org/10.1061/(Asce)1076-0342(2005)11:1(31)
- Jeon, C. M., Amekudzi, A. A., & Guensler, R. L. (2010). Evaluating plan alternatives for transportation system sustainability: Atlanta metropolitan region. International Journal of Sustainable Transportation, 4(4), 227–247. doi:https://doi.org/10.1080/15568310902940209
- Jeon, C. M., Amekudzi, A. A., & Guensler, R. L. (2013). Sustainability assessment at the transportation planning level: Performance measures and indexes. Transport Policy, 25, 10–21. doi:https://doi.org/10.1016/j.tranpol.2012.10.004
- Jones, S., Tefe, M., & Appiah-Opoku, S. (2013). Proposed framework for sustainability screening of urban transport projects in developing countries: A case study of Accra, Ghana. Transportation Research Part a-Policy and Practice, 49, 21–34. doi:https://doi.org/10.1016/j.tra.2013.01.003
- Jonsson, R. D. (2008). Analysing sustainability in a land-use and transport system. Journal of Transport Geography, 16(1), 28–41. doi:https://doi.org/10.1016/j.jtrangeo.2007.02.006
- Joumard, R., & Nicolas, J. P. (2010). Transport project assessment methodology within the framework of sustainable development. Ecological Indicators, 10(2), 136–142. doi:https://doi.org/10.1016/j.ecolind.2009.04.002
- Jurgilevich, A., Rasanen, A., Groundstroem, F., & Juhola, S. (2017). A systematic review of dynamics in climate risk and vulnerability assessments. Environmental Research Letters, 12(1). doi:https://doi.org/10.1088/1748-9326/aa5508
- Kaur, H., & Garg, P. (2019). Urban sustainability assessment tools: A review. Journal of Cleaner Production, 210, 146–158. doi:https://doi.org/10.1016/j.jclepro.2018.11.009
- Kennedy, C., Miller, E., Shalaby, A., MaClean, H., & Coleman, J. (2005). The four pillars of sustainable urban transportation. Transport Reviews, 25(4), 393–414. doi:https://doi.org/10.1080/01441640500115835
- Krippendorf, K. (2004). Content analysis: An introduction to its methodology. Thousand Oaks: Sage Publications.
- Kwok, R. C. W., & Yeh, A. G. O. (2004). The use of modal accessibility gap as an indicator for sustainable transport development. Environment and Planning a-Economy and Space, 36(5), 921–936. doi:https://doi.org/10.1068/a3673
- Landauer, M., Juhola, S., & Soderholm, M. (2015). Inter-relationships between adaptation and mitigation: A systematic literature review. Climatic Change, 131(4), 505–517. doi:https://doi.org/10.1007/s10584-015-1395-1
- Litman, T. (2007). Developing indicators for comprehensive and sustainable transport planning. Transportation Research Record, 2017, 10–15. doi:https://doi.org/10.3141/2017-02
- Litman, T., & Burwell, D. (2006). Issues in sustainable transportation. International Journal of Global Environmental Issues, 6(4), 331–347.
- Lopez-Escolano, C., Campos, A., Pardos, S., Nedeliakova, E., & Stefanova, V. (2017). Incorporating bicycles into urban mobility: An opportunity for sustainable development. Communications, 19, 68–73.
- Machler, L., & Golub, A. (2012). Using a “sustainable solution space” approach to develop a vision of sustainable accessibility in a low-income community in Phoenix, Arizona. International Journal of Sustainable Transportation, 6(5), 298–319. doi:https://doi.org/10.1080/15568318.2011.605210
- Mameli, F., & Marletto, G. (2014). Can national survey data be used to select a core set of sustainability indicators for monitoring urban mobility policies? International Journal of Sustainable Transportation, 8(5), 336–359. doi:https://doi.org/10.1080/15568318.2012.700000
- Mansourianfar, M. H., & Haghshenas, H. (2018). Micro-scale sustainability assessment of infrastructure projects on urban transportation systems: Case study of Azadi district, Isfahan, Iran. Cities, 72, 149–159. doi:https://doi.org/10.1016/j.cities.2017.08.012
- Marletto, G., & Mameli, F. (2012). A participative procedure to select indicators of policies for sustainable urban mobility: Outcomes of a national test. European Transport Research Review, 4, 79–89.
- Marsden, G., Kelly, C., & Snell, C. (2006). Selecting indicators for strategic performance management. Management and Public Policy, 2006(1956), 21–29.
- Marsden, G., Kimble, M., Nellthorp, J., & Kelly, C. (2010). Sustainability assessment: The definition deficit. International Journal of Sustainable Transportation, 4(4), 189–211. doi:https://doi.org/10.1080/15568310902825699
- Marsden, G., & Reardon, L. (2017). Questions of governance: Rethinking the study of transportation policy. Transportation Research Part a-Policy and Practice, 101, 238–251. doi:https://doi.org/10.1016/j.tra.2017.05.008
- May, A. D. (2013). Urban transport and sustainability: The key challenges. International Journal of Sustainable Transportation, 7(3), 170–185. doi:https://doi.org/10.1080/15568318.2013.710136
- McCool, S. F., & Stankey, G. H. (2004). Indicators of sustainability: Challenges and opportunities at the interface of science and policy. Environmental Management, 33(3), 294–305. doi:https://doi.org/10.1007/s00267-003-0084-4
- Miller, H. J., Witlox, F., & Tribby, C. P. (2013). Developing context-sensitive livability indicators for transportation planning: A measurement framework. Journal of Transport Geography, 26, 51–64. doi:https://doi.org/10.1016/j.jtrangeo.2012.08.007
- Miller, P., de Barros, A. G., Kattan, L., & Wirasinghe, S. C. (2016). Public transportation and sustainability: A review. Ksce Journal of Civil Engineering, 20(3), 1076–1083. doi:https://doi.org/10.1007/s12205-016-0705-0
- Miranda, H. D., & da Silva, A. N. R. (2012). Benchmarking sustainable urban mobility: The case of Curitiba, Brazil. Transport Policy, 21, 141–151. doi:https://doi.org/10.1016/j.tranpol.2012.03.009
- Moayedi, F., Zakaria, R., Bigah, Y., Mustafar, M., Puan, O. C., Zin, I. S., & Klufalah, M. M. (2013). Conceptualising the indicators of walkability for sustainable transportatio. Jurnal Teknologi, 65(3), 85–90.
- Moeinaddini, M., Asadi-Shekari, Z., & Shah, M. Z. (2015). An urban mobility index for evaluating and reducing private motorized trips. Measurement, 63, 30–40. doi:https://doi.org/10.1016/j.measurement.2014.11.026
- Munira, S., & San Santoso, D. (2017). Examining public perception over outcome indicators of sustainable urban transport in Dhaka city. Case Studies on Transport Policy, 5(2), 169–178. doi:https://doi.org/10.1016/j.cstp.2017.03.011
- Nadi, P., & Murad, A. (2017). Review of methods and indicators in sustainable urban transport studies overview from 2000 to 2016. Communications in Science and Technology, 2(2), 70–78.
- Nathan, H. S. K., & Reddy, B. S. (2013). Urban transport sustainability indicators – application of multi-view black-box (MVBB) framework. International Journal of Environment and Sustainable Development, 12(3), 285–312.
- Neuendorf, K. A. (2002). The content analysis guidebook. Thousand Oaks: Sage Publications.
- Ngossaha, J., Ngouna, R., Archimede, B., & Nlong, J. M. (2017). Sustainability assessment of a transportation system under uncertainty: An integrated multicriteria approach. IFAC Papersonline, 50(1), 7481–7486. doi:https://doi.org/10.1016/j.ifacol.2017.08.1064
- OECD. (2002). Policy instruments for achieving environmentally sustainable transport. Paris: OECD.
- Olofsson, Z., Hiselius, L., & Varhelyi, A. (2016). Development of a tool to assess urban transport sustainability: The case of Swedish cities. International Journal of Sustainable Transportation, 10(7), 645–656. doi:https://doi.org/10.1080/15568318.2015.1055535
- Oses, U., Roji, E., Gurrutxaga, I., & Larrauri, M. (2017). A multidisciplinary sustainability index to assess transport in urban areas: A case study of Donostia-San Sebastian, Spain. Journal of Environmental Planning and Management, 60(11), 1891–1922. doi:https://doi.org/10.1080/09640568.2016.1264374
- Palma Lima, J., da Silva Lima, R., & da Silva, A. N. R. (2014). Evaluation and selection of alternatives for the promotion of sustainable urban mobility. Procedia - Social and Behavioural Sciences, 162, 408–418.
- Pardo, C. F., Jiemian, Y., Hongyuan, Y., & Mohanty, C. R. (2012). Sustainable urban transport. In United Nations Department of Economic and Social Affairs (UNDESA) (Ed.), Shanghai manual: A guide for sustainable urban development in the 21st century. Shanghai: The Commercial Press.
- Pearsall, H., & Pierce, J. (2010). Urban sustainability and environmental justice: Evaluating the linkages in public planning/policy discourse. Local Environment, 15(6), 569–580.
- Pinna, F., Masala, F., & Garau, C. (2017). Urban policies and mobility trends in Italian smart cities. Sustainability, 9(4). doi:https://doi.org/10.3390/su9040494
- Pojani, D., & Stead, D. (2015). Sustainable urban transport in the developing world: Beyond megacities. Sustainability, 7(6), 7784–7805. doi:https://doi.org/10.3390/su7067784
- Rahman, A., & van Grol, R. (2005). SUstainable Mobility, policy Measures and Assessment (SUMMA) Final Report (European Commission).
- Rajak, S., Parthiban, P., & Dhanalakshmi, R. (2016). Sustainable transportation systems performance evaluation using fuzzy logic. Ecological Indicators, 71, 503–513.
- Ramani, T. L., Zietsman, J., Gudmundsson, H., Hall, R. P., & Marsden, G. (2011). Framework for sustainability assessment by transportation agencies. Transportation Research Record, 2242, 9–18. doi:https://doi.org/10.3141/2242-02
- Ramani, T. L., Zietsman, J., Ibarra, K., & Howell, M. (2013). Addressing sustainability and strategic planning goals through performance measures – study of bus rapid transit systems in El Paso, Texas. Transportation Research Record: Journal of the Transportation Research Board, 2357, 33–40.
- Reisi, M., Aye, L., Rajabifard, A., & Ngo, T. (2014). Transport sustainability index: Melbourne case study. Ecological Indicators, 43, 288–296. doi:https://doi.org/10.1016/j.ecolind.2014.03.004
- Reisi, M., Aye, L., Rajabifard, A., & Ngo, T. (2016). Land-use planning: Implications for transport sustainability. Land Use Policy, 50, 252–261. doi:https://doi.org/10.1016/j.landusepol.2015.09.018
- Richardson, B. C. (2005). Sustainable transport: Analysis frameworks. Journal of Transport Geography, 13(2005), 29–39.
- Rozhenkova, V., Allmang, S., Ly, S., Franken, D., & Heymann, J. (2019). The role of comparative city policy data in assessing progress toward the urban SDG targets. Cities, 95, 1–8.
- Santos, A. S., & Ribeiro, S. K. (2013). The use of sustainability indicators in urban passenger transport during the decision-making process: The case of Rio de Janeiro, Brazil. Current Opinion in Environmental Sustainability, 5(2), 251–260. doi:https://doi.org/10.1016/j.cosust.2013.04.010
- Sdoukopoulos, A., Nikolaidou, A., Pitsiava-Latinopoulou, M., & Papaioannou, P. (2018). Use of social media for assessing sustainable urban mobility indicators. International Journal of Sustainable Development and Planning, 13(2), 338–348.
- Sdoukopoulos, A., Pitsiava-Latinopoulou, M., Basbas, S., & Papaioannou, P. (2019). Measuring progress towards transport sustainability through indicators: Analysis and metrics of the main indicator initiatives. Transportation Research Part D-Transport and Environment, 67, 316–333. doi:https://doi.org/10.1016/j.trd.2018.11.020
- Shah, Y., Manaugh, K., Badami, M., & El-Geneidy, A. (2013). Diagnosing transportation developing key performance indicators to assess urban transportation systems. Transportation Research Record: Journal of the Transportation Research Board, 2357, 1–12.
- Shiau, T. A., & Liu, J. S. (2013). Developing an indicator system for local governments to evaluate transport sustainability strategies. Ecological Indicators, 34, 361–371. doi:https://doi.org/10.1016/j.ecolind.2013.06.001
- Siders, A. R. (2019). Adaptive capacity to climate change: A synthesis of concepts, methods, and findings in a fragmented field. Wiley Interdisciplinary Reviews-Climate Change, 10(3). doi:https://doi.org/10.1002/wcc.573
- Steg, L., & Gifford, R. (2005). Sustainable transportation and quality of life. Journal of Transport Geography, 13(1), 59–69.
- Sultana, S., Salon, D., & Kuby, M. (2019). Transportation sustainability in the urban context: A comprehensive review. Urban Geography, 40(3), 279–308. doi:https://doi.org/10.1080/02723638.2017.1395635
- Tafidis, P., Sdoukopoulos, A., & Pitsiava-Latinopoulou, M. (2017). Sustainable urban mobility indicators: Policy versus practice in the case of Greek cities. Transportation Research Procedia, 24, 304–312.
- Tennoy, A., Hansson, L., Lissandrello, E., & Naess, P. (2016). How planners’ use and non-use of expert knowledge affect the goal achievement potential of plans: Experiences from strategic land-use and transport planning processes in three Scandinavian cities. Progress in Planning, 109, 1–32. doi:https://doi.org/10.1016/j.progress.2015.05.002
- Toth-Szabo, Z., & Varhelyi, A. (2012). Indicator framework for measuring sustainability of transport in the city. Procedia - Social and Behavioral Sciences, 48, 2035–2047.
- Van Wee, B., & Banister, D. (2016). How to write a literature review paper? Transport Reviews, 36(2), 278–288. doi:https://doi.org/10.1080/01441647.2015.1065456
- Vega, A. (2012). Using place rank to measure sustainable accessibility. Journal of Transport Geography, 24, 411–418. doi:https://doi.org/10.1016/j.jtrangeo.2012.04.008
- Wang, Q., Tang, S., Hu, J., Chen, X., & Wang, L. (2015). Performance measurement system for assessing transportation sustainability and community livability. Transportation Research Record, 2531, 113–120. doi:https://doi.org/10.3141/2531-13
- Wann-Ming, W. (2019). Constructing urban dynamic transportation planning strategies for improving quality of life and urban sustainability under emerging growth management principles. Sustainable Cities and Society, 44, 275–290.
- Wey, W. M., & Huang, J. Y. (2018). Urban sustainable transportation planning strategies for livable city's quality of life. Habitat International, 82, 9–27. doi:https://doi.org/10.1016/j.habitatint.2018.10.002
- Whitmarsh, L., Swartlig, Å, & Jäger, J. (2009). Participation of experts and non-experts in a sustainability assessment of mobility. Environmental Policy and Governance, 19(4), 232–250.
- Zito, P., & Salvo, G. (2011). Toward an urban transport sustainability index: An European comparison. European Transport Research Review, 3, 179–195.