
The COVID-19 pandemic has had an enormous impact on travel behaviour in most of the world. This editorial examines the available evidence about the impact of the pandemic on cycling in various cities and countries of Europe, the Americas, and Australia to establish overall trends in cycling from 2019 to 2020 as well as variation over time, by location, by trip purpose, and by type of cycling facility. We also report trends in bicycle sales in different countries. Finally, we examine the nature and extent of government measures to accommodate and encourage increased cycling.
Cycling levels and bicycle mode share
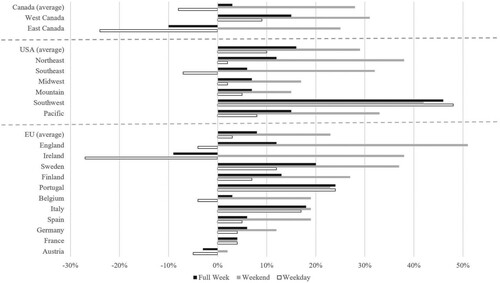
Eco-Counter operates automatic bicycle trip counters at key locations in European and North American cities. As shown in , there is considerable variation in percentage changes in cycling levels between 2019 and 2020 among EU countries as well as among regions of the USA and Canada. The comparisons are between both full years, including periods of lockdown in 2020. The 11 EU countries averaged an overall 8% increase in cycling, but with a much larger increase on weekends (+23%) than on weekdays (+3%). The USA averaged 16% growth overall, but similar to the EU, with higher growth on weekends (+29%) than on weekdays (+10%). Canada averaged a 3% increase, but again more (28%) on weekends, and a decline of 8% on weekdays (Eco-Counter, Citation2021). The much smaller increase (or decline) in weekday cycling is probably due to overall declines (all modes) in travel to work, university, school, and shopping due to lockdowns, closures, and travel restrictions. Many daily trips, including utilitarian bike trips, were replaced by remote working, learning, and shopping. In contrast, many countries, including the USA, have permitted outdoor walking and cycling for physical activity as exceptions to travel restrictions during lockdowns. That helps explain the large increase in cycling for exercise and recreation, which in turn helps explain the much larger increase in cycling on weekends compared to weekdays, as confirmed by almost all the evidence we examine throughout this editorial.
Figure 1. Percentage change in cycling levels in 2020 compared to 2019 in 11 European Countries, Canada, and the USA (for entire weeks, weekends, and weekdays).
Source: Eco-Counter (Citation2021). Note: The percentages shown are comparisons between both full years (all 52 weeks), including periods of lockdown in 2020.
Three sources confirm the strong growth in recreational cycling in the USA, which is mainly on weekends. Rails-to-Trails, which coordinates 41,082 km of off-road, mainly recreational, multi-use trails (shared with pedestrians), reports an average increase of 48% in usage between 2019 and 2020, including both walk and bike trips (RTC, Citation2021). The East Coast Greenway, which runs from Florida to Maine, reports an average increase of more than 50% in usage (again including cyclists and pedestrians) from 2019 to 2020, but with considerable variation from one trail segment to another (ECG, Citation2020). A detailed analysis of automatic counter data (specifically identifying bicycles) at locations throughout the state of North Carolina (NC) found large increases in cycling on off-road recreational greenways but declines in cycling in and to commercial areas and university campuses (Geiger, Kearns, & Searcy, Citation2021), similar to the findings of a study of COVID-19 impacts on cycling in Canadian cities (Fischer & Winters, Citation2021). The NC study also found that cycling at all types of locations increased much more during the afternoon and early evening, while increasing less, or declining, during the morning.
A study of COVID impacts on cycling in ten German cities found declines in three bike-oriented university towns, mainly due to remote learning. Cycling increased in the other seven, more transit-oriented cities, mainly due to shifts from public transport to cycling (Möllers, Specht, & Wessel, Citation2021). The same study also found the largest increases in cycling on weekend afternoons and the largest declines during weekday mornings, confirming the results of other studies.
Streetlight (Citation2020), an app-based source of travel data, reported an average increase of 12% in bike trips in the USA between July 2019 and July 2020. Streetlight also examined cycling trends in the largest 100 US metropolitan areas and found great variation in the direction, extent, and timing of changes in cycling levels. Some cities, such as Washington, DC and Portland, Oregon, with relatively high levels of cycling to work (compared to other US cities), reported declines in cycling, especially during weekday mornings at peak hours, as many cyclists shifted to working from home. Similar to the NC study noted earlier, Streetlight reported the largest increases in cycling during the afternoon and early evening. The monthly timing of ups and downs was quite different among the 100 metropolitan areas, as COVID hot spots in the USA have shifted from one region of the country to another. Shifting hot spots resulted in lockdowns or travel restrictions at different times in different states, largely offsetting each other and leading to less national fluctuations over time as for smaller countries, as shown in . To a lesser extent this has been the case in Canada as well.
Figure 2. Fluctuation in percentage change in 2020 cycling levels relative to 2019 in 11 European countries, the USA, and Canada (four-week averages compared to the same period in 2019).
Source: The authors calculated the 4-week averages shown in the figure based on weekly numbers from January 2019 to March 2021 provided by Eco-Counter directly to the authors.
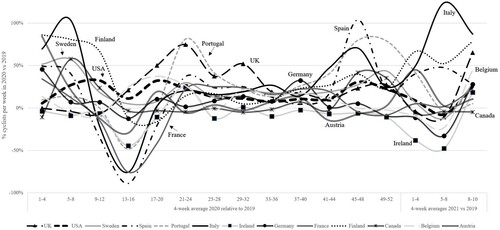
By comparison, there have been dramatic fluctuations in cycling levels by month of the year in all 11 European countries shown in . Cycling declined in lockdown periods, when there were severe travel restrictions, curfews, quarantines, and closures of businesses, schools, universities, restaurants, and government offices. After the lifting of lockdowns (or their relaxation), cycling rose sharply. Thus, comparing data from all of 2019 with all of 2020 (as shown in ) can be misleading because it includes periods when almost no travel was allowed. A specific example of this is France. During the first lockdown (from March 17 to May 11, 2020), cycling levels fell by 70% compared to pre-lockdown levels. After the lockdown was lifted, cycling increased five-fold to a level 44% higher than before the lockdown. Thus, most year-to-year estimates understate the true increase in cycling when it was allowed. Reported increases from 2019 to 2020 in cycling volumes in specific cities were larger for periods excluding lockdowns than for comparisons of the two full years including lockdowns: e.g., Paris (67% vs. 39%), Barcelona (43% vs. 30%), and New York (17% vs. 3%). Even including lockdowns, however, the increases in cycling were considerable: Cologne (11%), Vienna (12%), Oslo (26%), Outer London (22%), and Inner London (7%).
Examining percentage changes in cycling levels is also misleading without accounting for changes in total travel by all modes over the same period. The Streetlight data for the USA report an increase in cycling trips (+12%) from 2019 to 2020 but a 15% decline in motor vehicle km travelled, indicating a considerable increase in bike mode share. Only a few cities were able to provide data based on cycling trips as a percentage of total trips. In Vienna, for example, the bike mode share rose from 7% in 2019 to 9% in 2020. In Milan, bike mode share in a major travel corridor with protected bike lanes rose from 5% in November 2019 to 18% in November 2020. In Bogota, cycling trips fell by 28% from February 2020 to January 2021, but over the same period total trips (by all modes except walking) fell by 50%. Thus, the bike share of trips rose from 9% to 13%. Bike mode share rose in nine of the ten German cities examined by Möllers et al. (Citation2021).
A national survey in the USA asked new cyclists (first time ever or in over a year) their main motivations for cycling in 2020 (PFB, Citation2021). New cyclists reported five main reasons (not mutually exclusive): stress relief and mental health (58%), exercise and physical fitness (57%), socialising with friends and family (43%), relaxation (37%), and getting outdoors (33%). Except on very crowded facilities, cycling outdoors enables the achievement of these five objectives while maintaining social distancing to reduce the risk of COVID contagion. The PFB survey responses correspond with other evidence suggesting that increased cycling in 2020 was not mainly for daily utilitarian travel such as trips to work, school, university, and shopping.
Accompanying the increases in cycling noted in this section, the number of bicycles sold increased from 2019 to 2020 in those countries for which we could obtain data: +39% in the USA, +20% in Italy, +27% in France, +20% in the UK, +17% in Germany, and +23% in Australia (CONEBI, Citation2021; NDP, Citation2021; ZVI, Citation2021). In each of those countries, the percentage increase in e-bike sales has been larger than the increase in non-motorised bicycles, the continuation of a trend for the past five years (Cherry & Fishman, Citation2021). The increase in bicycle sales is important because the greater availability of bicycles obviously increases the likelihood of cycling in future years as well.
Government measures to promote cycling during COVID-19
Many city governments have undertaken measures to accommodate and encourage increased cycling during the pandemic, often with financial assistance from state and national governments. summarises the various kinds of measures implemented and provides specific examples of the kind and extent of such measures where data are available.
Table 1. Government measures to promote cycling during COVID-19.
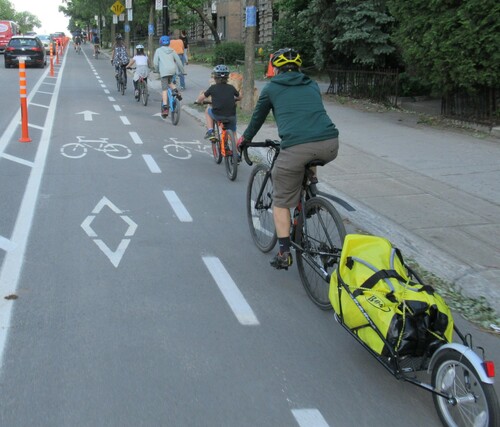
Many cities expanded their cycling facilities in 2020. For example, new or expanded bike lanes and paths were built by 32 of 42 large European cities surveyed and by 102 of 200 American cities surveyed. The largest increases we detected were in New York (102 km), London (100 km), Montreal (88 km), and Paris (80 km). Of the additional facilities in Paris, 55 km were specifically designated as Coronapistes (Corona bike lanes), of which 10 km were protected bike lanes. The expansions in Montreal included two express bikeways (cycle superhighways) and 47 km of protected bike lanes, such as shown in . The extent of expansions for about 20 specific cities are shown in . Kraus and Koch (Citation2021) analyzed cycling levels at 736 locations in 106 European cities that built a total of 1209 km of provisional, pop-up bike lanes in response to COVID in 2020. The average increase in cycling for each city ranged from 11% to 48% compared to 2019.
Figure 3. Montreal installed 88 km of new or improved cycling facilities in 2020, of which 29 km were temporary COVID lanes, as shown here. Most of the new facilities were physically separated from motor vehicle traffic, thus encouraging use by all ages, including entire families.
Source: Photo by Bartek Komorowski
Several cities also reported the redesign of intersections to make them safer for both cyclists and pedestrians. Austin, Texas, for example, built six new protected intersections in 2020 specifically in response to COVID-19 and is planning more in 2021. Many cities installed more bike parking or subsidised the cost of bikesharing and bike repairs (Combs & Pardo, Citation2021; ECF, Citation2021; PFB, Citation2021).
In some instances, the expansion and improvement of cycling facilities was already included in long-term plans. COVID-19, however, accelerated implementation, partly due to the growth in cycling, which had to be accommodated, and partly due to increased public and political support during the pandemic. Indeed, that last factor was even more important in enabling the second category of measures shown in , which involve various kinds of restrictions on motor vehicle use and a reallocation of road space from motor vehicles to cyclists and pedestrians.
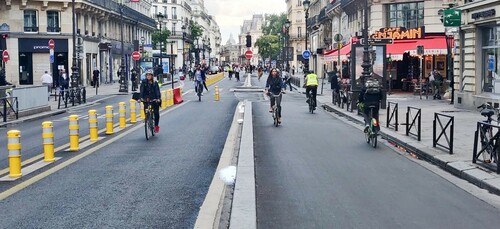
For example, 25 of 42 large European cities surveyed expanded their already extensive networks of traffic-calmed neighbourhood streets and car-free zones (Buehler & Pucher, Citation2021a; ECF, Citation2021). Of 200 large American cities surveyed, 144 closed some streets to motor vehicles, 136 cities restricted motor vehicle access to local traffic, and 70 cities reduced motor vehicle speed limits, especially on streets with bike lanes or in residential neighbourhoods (PFB, Citation2021). Perhaps the most prominent example in the USA was the closure of 135 km of streets to motor vehicles in New York from 8am to 8pm for use by pedestrians and cyclists (City of New York, Citation2021). Among the European streets closed to motor vehicles, perhaps the most famous is Rue de Rivoli, a major road in the centre of Paris (see ). Reductions in speed limits were especially important on shared streets, where pedestrians and cyclists are allowed to use the full width of the street. These sorts of restrictions on motor vehicle use had already been common in European cities, but they were rare in American cities until the pandemic generated the necessary public and political support for their implementation (Buehler & Pucher, Citation2021b).
Figure 4. Rue de Rivoli, a major street in Paris, was converted to a bicycling street in 2020.
Source: Photo by Emmanuel de Lanversin
Cities also implemented various other programmes to promote cycling during COVID-19. For example, 96 of 200 large American cities offered free or discounted bikesharing, sometimes including free membership as well as lower charges per hour of use. Some large cities in Europe also offered less expensive bikesharing and even subsidised bicycle purchases and repairs (see ).
Most of these infrastructure projects and supportive programmes were financed mainly from municipal budgets, but several national governments contributed funds: for example, €329 million in France, €320 in the UK, and €304 million in Italy.
Conclusions
Cycling increased considerably from 2019 to 2020 in most cities of Europe, North America, and Australia. The percentage increase is even larger when periods of total lockdowns are excluded. Moreover, the bicycle share of trips has risen in virtually all cities because total travel (all modes) fell sharply during the COVID-19 pandemic.
There are at least five reasons to believe that the increase in cycling during the COVID-19 pandemic will persist over the coming years:
The expansion and improvement of protected cycling infrastructure, both completed and planned, will ensure better cycling conditions in future years. Many studies document the importance of building bikeways with physical barriers separating cyclists from fast moving and/or high volumes of motorised traffic. Such protected facilities increase cycling and make it safer (Buehler & Pucher, Citation2021a; Furth, Citation2021; Pucher & Buehler, Citation2016).
The large growth in bicycle sales has increased the availability of bicycles.
New cyclists and more frequent cyclists may have developed new habits of travel and greater familiarity with cycling; both factors increase the likelihood they will continue to cycle in coming years. A survey of new cyclists in the USA (first time ever or in over a year) asked whether they intended to continue cycling after the pandemic. About 18% expected to cycle every day, 30% several times a week, and 35% about once a week (PFB, Citation2021). Only 17% anticipated not cycling at all or only very infrequently after the pandemic.
As daily trips to work, school, university, shopping, restaurants, and entertainment rebound after COVID-19, many of the utilitarian cycling trips lost during the pandemic will probably be regained.
It seems likely that some of the increased cycling in 2020 came from former public transport passengers who shifted to cycling because they were afraid to ride crowded trains and buses. Public transport use during the COVID-19 pandemic declined sharply in European, North American, and South American cities, with loses of 60%-90% of passengers between 2019 and 2020 (APTA, Citation2021; Sengupta, Abdul, Andreoni, & Penney, Citation2021). A March 2021 consumer survey found that 45% of respondents in the USA reported that they intended to use public transport less than previously, even after the pandemic is past (Consulting US, Citation2021). Thus, some of the public transport riders who shifted to cycling during the pandemic will probably continue to ride bikes, especially with improved cycling facilities and greater availability of bicycles noted previously.
Given those five factors, it seems likely that cycling levels will remain higher in the coming years than in 2019. It is crucial, however, that governments at every level support the expansion and improvements in cycling infrastructure, programmes, and policies necessary to ensure that cycling thrives. That includes retaining and building on the successful measures implemented in 2020 to deal with COVID, especially protected on-road bike lanes, car-free streets, shared streets, and reduced speed limits. There is also a pressing need for investment in vastly expanded off-road greenways, where increases in usage have far exceeded those on any other facilities—so large that many greenways have become overcrowded on weekends. There are many good reasons for governments to promote cycling, as it is socially, environmentally, and economically sustainable. Indeed, cycling is perhaps the most sustainable of all urban travel modes, as it is feasible not only for short trips but also for medium-distance trips too long to cover by walking (Buehler & Pucher, Citation2021b).
References
- APTA. (2021). Transit statistics: Ridership reports, 2019–2020. Washington, DC: American Public Transportation Association.
- Buehler, R., & Pucher, J. (2021a). The growing gap in pedestrian and cyclist fatality rates between the United States and the United Kingdom, Germany, Denmark, and the Netherlands, 1990–2018. Transport Reviews, 41(1), 48–72. Retrieved from https://www.tandfonline.com/doi/full/https://doi.org/10.1080/01441647.2020.1823521
- Buehler, R., & Pucher, J. (2021b). Cycling for sustainable cities. Cambridge, MA: MIT Press. (p. 488). Retrieved from https://mitpress.mit.edu/books/cycling-sustainable-cities
- Cherry, C., & Fishman, E. (2021). E-bikes in Europe and North America. Chapter 9 In R. Buehler, & J. Pucher (Eds.), Cycling for sustainable cities (pp. 157–172). Cambridge, MA: MIT Press. Retrieved from https://mitpress.mit.edu/books/cycling-sustainable-cities
- City of New York. (2021). Amid year of unprecedented streetscape changes, mayor de blasio announces largest one-year protected bike lane expansion in New York city history. New York: Office of the Mayor, City of New York. Retrieved from https://www1.nyc.gov/office-of-the-mayor/news/888-20/amid-year-unprecedented-streetscape-changes-mayor-de-blasio-largest-one-year
- Combs, T., & Pardo, C. (2021). Shifting streets COVID-19 mobility data: Findings from a global dataset and a research agenda for transport planning and policy. Transportation Research Interdisciplinary Perspectives, 9(March). Retrieved from https://www.sciencedirect.com/science/article/pii/S2590198221000294
- CONEBI. (2021). European Bike Sales. Brussels: Confederation of the European Bicycle Industry.
- Consulting US. (2021, March 26). Consumer anxiety over Covid declining, but financial anxiety lingers. Retrieved from https://www.consulting.us/news/5753/consumer-anxiety-over-covid-declining-but-financial-anxiety-lingers
- ECF. (2021). COVID-19 Cycling measures tracker. Brussels, Belgium: European Cyclists' Federation. Retrieved from https://ecf.com/dashboard
- ECG. (2020). Crisis response. Investing in the future we want and need. Durham, NC: East Coast Greenway Alliance. Retrieved from https://www.greenway.org/stories/crisis-response-investing-in-the-future-we-want-and-need
- Eco-Counter. (2021). Bike count dashboard: tracking the growth of cycling by country. Lannion: Paris, France and Montreal, Canada. Retrieved from https://www.eco-counter.com/cycling-data-tracker/
- Fischer, J., & Winters, M. (2021). COVID-19 street reallocation in mid-sized Canadian cities: Socio-spatial equity patterns. Canadian Journal of Public Health. Retrieved from https://link.springer.com/article/https://doi.org/10.17269/s41997-020-00467-3
- Furth, P. (2021). Bicycling infrastructure for all. Chapter 5 In R. Buehler, & J. Pucher (Eds.), Cycling for sustainable cities (pp. 81–102). Cambridge, MA: MIT Press. Retrieved from https://mitpress.mit.edu/books/cycling-sustainable-cities
- Geiger, B., Kearns, B., & Searcy, S. (2021). Impacts of COVID-19 on bicycling in North Carolina. presentation at the 2021 national bike summit (Virtual). Raleigh, NC: Institute for Transportation Research and Education, North Carolina State University.
- Kraus, S., & Koch, N. (2021). Provisional COVID-19 infrastructure induces large, rapid increases in cycling. Proceedings of the National Academy of Sciences of the United States. Retrieved from https://www.pnas.org/content/118/15/e2024399118
- Möllers, A., Specht, S., & Wessel, J. (2021). The impact of the Covid-19 pandemic and government interventions on active mobility (Working Paper No. 34). Münster, Germany: University of Münster, Institute for Transport Economics.
- NPD Group. (2021). Bicycle sales in the U.S. Port Washington, New York: NPD Group Market Research.
- PFB. (2021). How bicycling changed during a pandemic. Boulder, CO: People for Bikes. Retrieved from https://www.peopleforbikes.org/news/how-bicycling-changed-during-a-pandemic
- Pucher, J., & Buehler, R. (2016). Safer cycling through improved infrastructure. American Journal of Public Health, 106(12), December: 2089-2092. Retrieved from https://ajph.aphapublications.org/doi/full/https://doi.org/10.2105/AJPH.2016.303507
- RTC. (2021). Recent Trends in Biking and Walking on Trails. Washington, DC: Rails to Trails Conservancy. Retrieved from https://www.railstotrails.org/our-work/research-and-information/trail-modeling-and-assessment-platform/trail-traffic-calculator/.
- Sengupta, S., Abdul, G., Andreoni, M., & Penney, V. (2021, March 25). Riders are abandoning buses and trains. New York Times. Retrieved from https://www.nytimes.com/2021/03/25/climate/buses-trains-ridership-climate-change.html.
- Streetlight. (2020). COVID Transportation trends. San Francisco, CA: Streetlight. Retrieved from https://learn.streetlightdata.com/covid-transportation-trends.
- ZIV. (2021). Bicycle Sales in Germany. Berlin, Germany: Zweiradindustrie Verband.