
ABSTRACT
International comparisons of cycling behaviour have typically been limited to high-income countries and often limited to the prevalence of cycling, with lack of discussions on demographic and trip characteristics. We used a combination of city, regional, and national travel surveys from 17 countries across the six continents, ranging from years 2009 through 2019. We present a descriptive analysis of cycling behaviour including level of cycling, trip purpose and distance, and user demographics, at the city-level for 35 major cities (>1 million population) and in urbanised areas nationwide for 11 countries. The Netherlands, Japan and Germany are among the highest cycling countries and their cities among the highest cycling cities. In cities and countries with high cycling levels, cycling rates tend to be more equal between work and non-work trips, whereas in geographies with low cycling levels, cycling to work is higher than cycling for other trips. In terms of cycling distance, patterns in high- and low-cycling geographies are more similar. We found a strong positive association between the level of cycling and women’s representation among cyclists. In almost all geographies with cycling mode share greater than 7% women made as many cycle trips as men, and sometimes even greater. The share of cycling trips by women is much lower in geographies with cycling mode shares less than 7%. Among the geographies with higher levels of cycling, children (<16 years) are often overrepresented. Older adults (>60 years) remain underrepresented in all geographies but have relatively better representation where levels of cycling are high. In low-cycling settings, females are underrepresented across all the age groups, and more so when older than 16 years. With increasing level of cycling, representation of females improves across all the age groups, and most significantly among children and older adults. Clustering the cities and countries into homogeneous cycling typologies reveals that high cycling levels always coincide with high representation of females and good representations of all age groups. In low-cycling settings, it is the reverse. We recommend that evaluations of cycling policies include usage by gender and age groups as benchmarks in addition to overall use. To achieve representation across different age and gender groups, making neighbourhoods cycling friendly and developing safer routes to school, should be equally high on the agenda as cycling corridors that often cater to commuting traffic.
1. Introduction
There is international academic and policy interest in cycling. Reasons range from spatial and temporal efficiency to health, the local environment, and climate change, compared to other modes. However, cycling levels vary widely. In Western Europe, variation in cycling mode share (e.g. 2% in United Kingdom (UK) vs. 26% in the Netherlands: Buehler & Pucher, Citation2012b) indicates substantial scope for increasing levels of cycling. Such variation also exists within countries; for instance, many cities in the UK have cycle commuting rates of ∼1%, but in Cambridge this figure is 33% (Goodman & Aldred, Citation2018). Likewise, cycling prevalence in the adult population of Argentinian cities ranged from 1.3% (Parana) to 9.3% (Santa Fe) (Sá et al., Citation2018).
Cycling levels are affected by national and subnational policies (Buehler & Pucher, Citation2012b), which shape cycling experience through factors including infrastructure availability and quality (Mueller et al., Citation2018). Other factors affecting the likelihood of cycling include trip distance (Lovelace et al., Citation2017; Schneider, Daamen, Hoogendoorn-Lanser, & Hoogendoorn, Citation2018) and demographic variables. Demographic correlates of cycling vary substantially across the countries. Cycle commuting is gender-equal in some contexts (e.g. the Netherlands), but not others such as the United States of America (USA) or England, where male to female ratios are around 3:1 (Heinen, van Wee, & Maat, Citation2010; Pucher, Buehler, Merom, & Bauman, Citation2011), or in cities such as Sao Paulo (Brazil) and Posadas (Argentina), with male to female ratios around 7:1(Sá et al., Citation2018). Studies have reported that the ratio of male to female cycling rates is greatest in areas that are less attractive for cycling (Grudgings et al., Citation2018). Women use cycling for non-commute purpose relatively more than do men (Krizek, Johnson, & Tilahun, Citation2005; Tin Tin, Woodward, Thornley, & Ameratunga, Citation2009), their cycling trips are shorter than men’s (Garrard, Rose, & Lo, Citation2008; Krizek et al., Citation2005) and the gender division of household labour may affect cycling levels (Shaw et al., Citation2020; Singleton & Goddard, Citation2016). The relationship between cycling use and age has been found to be inconsistent (Heinen et al., Citation2010). In England and the US, cycling declines dramatically from middle age, while in the Netherlands, cycling levels only decline after age 70 (Götschi et al., Citation2015; Pucher et al., Citation2011).
Much of the cross-national comparative work of cycling behaviour using travel surveys is limited to Western Europe and North America (Buehler & Pucher, Citation2012a; Pucher & Buehler, Citation2008; Pucher, Buehler, Bassett, & Dannenberg, Citation2010). These countries are among the world’s richest. According to a global study analysing GPS traces of individuals, Western European countries have the highest gender equality in daily mobility, expressed in terms of spatial coverage, while countries such as India, South Korea and Chile are among the least equal (Alessandretti, Aslak, & Lehmann, Citation2020). Further, there are large differences (up to 20 years) in the median age of population in the global North and those in the global South (Lutz, Sanderson, & Scherbov, Citation2008). Given these differences, demographics of cycling behaviour from a handful of high-income countries are likely a poor representation of the rest of the world.
As far as cities are concerned, international comparison is limited to levels or prevalence of cycling, lacking discussion of demographic or trip characteristics (Pucher & Buehler, Citation2008; Sá, Duran, Tainio, Monteiro, & Woodcock, Citation2016). Comparison between cities is far more common as part of within-country analyses e.g. Buehler and Pucher (Citation2012b) for the USA, Aldred, Woodcock, and Goodman (Citation2016) for England, and Goel and Mohan (Citation2020) for India. Single-country studies analysing the demographic correlates of cycling are also focused on the Global North (Aguilar-Farias, Cortinez-O’Ryan, Chandia-Poblete, & Heesch, Citation2019), the exceptions being a growing literature on China (e.g. Zhao, Sick Nielsen, Olafsson, Carstensen, & Meng, Citation2018) and some Brazilian studies (e.g. Reis, Hino, Parra, Hallal, & Brownson, Citation2013; Sá et al., Citation2016). There is less work on other Latin American countries, although some have achieved substantial growth in cycling: for instance, Bogotá, in Colombia (Rosas-Satizábal & Rodriguez-Valencia, Citation2019). There is no study that we are aware of that studied cycling behaviour in a mix of low-and-middle income and high-income cities or countries.
Thus, with both comparative and demographically focused literature limited to a relatively small number of countries, we lack an international landscape of cycling prevalence in relation to demographic variation. This study starts to fill this gap, reviewing cycling prevalence and trip characteristics alongside variation in age and gender. Data are presented both at city and country level, due to variation in the availability of travel survey data. Seventeen countries are covered, including low-, middle- and high-income contexts across six continents.
With a focus on cycling levels, trip characteristics, and demographics of the users, we address the following research questions:
What is the mode share of cycling across countries and cities for all trips, and for work and non-work trips?
How does cycling mode share by distance vary across countries and across cities and how does this relate to level of cycling?
How does cycling mode share for age and gender groups differ across countries and across cities, and does this relate to cycling levels?
What is the interaction between age and gender representation of cyclists, and how does this vary?
Can we establish a global typology of cities based on level of cycling, and representation of gender and age among cyclists?
2. Methods
2.1 Survey data
To answer these questions, we needed comparable travel survey data from a range of different contexts. We used a combination of city-, region- and country-level travel surveys from 17 different countries across six different continents. The countries include Kenya and South Africa in Africa, India and Japan in Asia, Australia, England, Finland, Germany, Netherlands and Switzerland in Europe, Canada, Mexico and USA in North America, and Argentina, Brazil, Chile, and Colombia in South America. We selected cities based on availability of data and to ensure representation of different world regions. We obtained data from city/regional websites for Argentina, Australia, Brazil, Canada, Colombia, Chile, from collaborators with access to data for Brazil, Colombia, India, Kenya, Netherlands, Mexico, South Africa, USA, and by applying to specific data agencies for access for the rest. The included countries represent a wide range of income levels (World Bank, Citation2019). Among these, seven are low-and-middle income countries and ten are high income countries. The latter include Australia, Canada, Chile, Japan, USA, and all five European countries. We refer to Argentina, Brazil, Chile, Colombia, and Mexico as Latin American countries.
Travel survey datasets typically report travel activities of sampled individuals using a travel diary. The duration of reporting is one day for most datasets. The exceptions are country-level datasets of England and Germany where respondents reported their travel activities for a week. For the corresponding cities of the two countries included in city-level analysis (London, Berlin, Cologne, Hamburg, and Munich) we used different city-level datasets with a reporting duration of one day. The other exceptions are the US cities of Chicago, where a fraction of respondents reported for one day and the rest reported 2 days, and Seattle, where the reported data is a mix of one day for some respondents and a week for the rest.
We present two sets of results. One refers to selected cities and the other refers to all urban areas in an entire country. We make this distinction of city- and country-level as travel patterns often vary within a country and are developed locally. For the city-level analysis, we included the largest cities within their respective countries and cities with a population size of at least a million. We have two exceptions. We included Kisumu city in Kenya with a population of 560,000, as we had access to only two cities from the African continent (other is Cape Town in South Africa). The other exception is Gran Valparaiso in Chile with a population of 964,565 in 2014.
For the country-level analysis, we selected data of those respondents who resided in urban areas, and we refer to these geographies as nationwide urban areas. Our definition of urban was based on how it was categorised in each country’s travel survey dataset. In general, we excluded all areas that were categorised as “rural”, although definitions of rural areas may differ across the countries. Limiting to urban areas makes the two sets of analyses at city- and country-level comparable, though at different levels of aggregation.
For country-level analysis, we used two types of datasets. First, nationally representative travel surveys – these were available for all the high-income countries except Australia and Chile and not available for any of the low-and-middle income countries. Second, for Argentina, Australia, Brazil, and Chile, we combined data from multiple individual cities or urban part of the regions for their country-level analysis (see ). The cities/regions included represent 53% of the urban population of Argentina, 35% in Australia, 18% in Brazil, and 65% in Chile. For Colombia, Kenya, Mexico, and South Africa, we have data for one city each, and for India, two cities, and therefore not enough for a country-level analysis. In total, we present city-level analysis for 35 geographies and country-level analyses for 11 geographies. The average population of the cities is 4.98 million. Without double counting those cities with their respective countries included in our analysis, we present cycling behaviour representing 648 million urban residents in the world (i.e. circa 17% of global urban population (UNDESA, Citation2019)). The average year of the datasets is 2013, ranging from 2009 (3 geographies) to 2019. More details of the datasets are available in the Supplementary Information (SI)-1.
Table 1. Cities or regions contributing to country-level analysis (countries for which dataset was combined from multiple cities/regions).
In case of Finland, we could not identify urban residents and therefore used rural-urban combined. We expect this to have minimal effect on the results as only 15% of Finland’s residents live in rural areas. The data for Amsterdam city in the Netherlands is represented by the urban residents of the Noord-Holland municipality, of which Amsterdam is the largest city. For Helsinki in Finland, we report data for Helsinki Capital Region, for Brisbane in Australia, Greater Brisbane Area, for Melbourne in Australia, Metropolitan Melbourne, for Zurich in Switzerland, Zurich agglomeration, and for Seattle in the US, Seattle Metropolitan Area.
2.2 Analysis
Our units of analysis are trips and the individuals who made those trips. For trips with multiple stages and multiple modes, we assigned main modes. For most datasets, this was already assigned. If not, we used stage-level data and assigned the mode used for the stage with the longest duration. If stage-level duration was not available, we used a hierarchy of modes (all modes except walking have higher level than cycling). We defined trip distance and duration as the total distance and duration, respectively, from origin to the destination of the trip including all the stages. We defined trip purpose as a dichotomised variable – work and non-work. In work, we also included trip purpose classified as work-related or business. We classified trips to work and the following trip back home as work trips, and trip back home was classified as work trip only if it immediately followed a trip to work. In some datasets, this classification was already available, and in country-level dataset of Germany, used a different criterion. In that dataset, returning home trips were classified as work trips if there were a maximum of three trips away from the trip to work, therefore, allowing two trips between work and trip home.
We present multiple metrics of cycling and overall travel behaviour, using either trips or individuals as units of analysis. The metrics using trips as units of analysis include overall mode share of cycling, mode share of cycling classified by work and non-work trips, mode share of cycling classified by males and females, percentage share of cycle trips that are made by women, and median distance and duration of cycle trips. Datasets of Africa, Japan, and Latin America (except Sao Paulo) do not report trip distance, and that of Montreal (Canada) do not report distance or duration, and therefore we do not report their corresponding metrics in the city-level and country-level results. When available, we used trip weights or person weights to ensure analysis is representative of the population.
The metrics using individuals as units of analysis include median age for the following four categories – cyclists (those who reported at least one cycle trip), all other road users (those not reporting any cycle trips), male cyclists, and female cyclists. The data on age in the four German cities (Berlin, Cologne, Hamburg, and Munich) and the four US cities (Los Angeles, Philadelphia, New York city, and Seattle) were only reported as categories of age bins, and Gran Valparaiso city has no age data in any form. For these six settings, we do not report these metrics of age.
Next, we present mode share of cycling by distance, where distance is classified into five bands: 0–2 km, 2–5 km, 5–10 km, 11–20 km, > 20 km. To aid comparison across the settings with very different overall cycling mode shares, we present distance distribution ratios, which we define as the ratio of cycling mode share within each distance range to overall cycling mode share of the geography (see Box 1). Mathematically, this is the same as the ratio of proportion of cycle trips in that distance range to the proportion of all trips in that range. Using this ratio, we control for the overall distance distribution in each setting and enable comparison across settings.
Next, we present age representation of cyclists. We classified age into three groups – children (<16 years), working age (16–59 years), and older adults (>60 years). The age cut-off of older adults matches retirement age in many countries. We decided to focus on three age groups to be able to identify potential under- or over-representation among both older and younger individuals, which could be obscured by presenting this for overall population or as mean or median ages alone. For each age group, we calculated age representation ratio (see Box 1 for distance-based ratios, except distance bins are replaced by age bins). In case of the German cities and three US cities, where age is available only as categories, the cut-offs of the age band coincided with our definitions. For New York City, we included 60–64-year-old in the category of working age.
Next, we present gender representation in cycling stratified by three age groups. Specific to each age group, we calculate the ratio of proportion of cycle trips in that age group that are made by females to the proportion of all trips in that age group made by females (see Box 1). We refer to this as female representation ratio. Note that proportion used in the denominator of this ratio controls for overall female representation in daily travel. A value less than one represents poor representation of females in cycling compared to all trips combined, and a value greater than one represents overrepresentation.
To quantify the association between these different metrics with the mode share of cycling we report Pearson’s and Spearman’s rank correlation along with their P-values of significance. Pearson’s correlations report the strength of linear association, while Spearman’s rank order correlation gives the strength of monotonic relationship (even if non-linear) and is not sensitive to outliers.
We develop typologies of the cities and countries based on the metrics of levels of cycling, gender representation, and age representation of cyclists. The typologies aim to classify geographies into clusters with relative homogeneity across these metrics. Here, for gender representation, the metric used is the share of all cycle trips that are made by females. We used k-means cluster method for cities and countries combined. The five vectors used for clustering include – mode share of cycling, female’s share in cycling, and the age representation ratios of the three age groups. For clustering, each of these vectors are first individually scaled as z-scores. We excluded Argentina and Brazil as many of their constituting cities were also included. This minimised double-counting between results of these countries and their respective cities. We also excluded four cities for which age representation could not be calculated for all age groups – Cape Town, Delhi, Kisumu, and Sao Paulo, due to small number of data points (<10) among the older adults.
3. Findings
3.1 Mode share of cycling and its purpose
presents mode share, gender representation of cycling, and age of cyclists and other road users, and distance and duration of cycling trips for the countries, and present these data for the selected cities. For all tables, data are presented by descending order of mode shares of cycling in all trips, unless otherwise mentioned. Among the countries, the Netherlands has the highest level of cycling followed by Japan, Germany, and Finland. The lowest levels are in Brazil and the USA with about 1% mode share. Of the 35 cities, 13 have a mode share greater than 5% (median mode share is 3.3%). Cities with the highest levels of cycling are Amsterdam and Osaka, followed by Tokyo, Munich, and Nagoya.
Table 2. Cycling behaviour and characteristics of cyclists for urbanised areas nationwide (listed in the descending order of cycling mode share).
Table 3. Cycling behaviour and characteristics of cyclists in the selected cities (listed in the descending order of cycling mode share).
In most geographies, cycling is used for work trips more frequently than for other purposes. On average, cycling to work in the urban areas of selected countries is 40% more likely than cycling for a non-work trip, and in the selected cities, about 60% more likely. Among the countries, England and Brazil have relatively extreme differences in cycling mode shares between work and non-work trips (ratios of 2.4 and 3.3, respectively), and Delhi has the highest ratio at 6.9 among the cities.
In some of the highest cycling geographies, cycling is more frequently used among non-work trips. Most prominent examples among the countries are the Netherlands, Japan, and Germany with an average ratio of 0.83, and among cities are Hamburg, Yokohama, and Tokyo, with a similar average. The correlations between this ratio and overall mode share of cycling are negative for the urban areas of selected countries as well as the selected cities, with values of −0.45 (P=0.17) and −0.32 (P=0.06) respectively, using Pearson’s method, and −0.54 (P=0.09) and −0.60 (P < 0.001), respectively, using Spearman’s method. Negative associations imply that at higher levels of cycling, this ratio decreases, and cycling is either as frequently used for non-work trips as for work trips, or even more frequently for non-work trips.
3.2 Cycling mode share by distance
We present distance distribution ratios for 7 countries () and 20 cities (), excluding the geographies that did not report travel distance. Also shown in the tables are the correlation values between distance-specific ratios and mode share, along with P-values of significance. Across all the geographies, the distance distribution ratios are usually greater than one for distance shorter than 5 km (distance bins of 0–2 km and 2–5 km), and less than one for distance greater than 5 km. Among the countries, the average ratio is the highest for the shortest distance bin (0–2 km), and among the cities, for the 2–5 km bin. In other words, the likelihood of cycling for longer distance is higher in the selected cities than in all urban areas combined. The percentage distributions of cycle trips and all trips by distance categories are presented in SI-2.
Table 4. Distance-based ratios of cycling across countries (ratio of proportion of cycle trips in a distance bin to the proportion of all trips in that distance bin; heat map shows gradation of all values combined; correlations are presented between mode shares and ratios within each distance bin).
Table 5. Distance-based ratios of cycling trips in selected cities (ratio for each distance bin is the ratio of proportion of all cycle trips in a distance range to the proportion of all trips in that range; heat map shows gradation of all values combined; correlations are presented between mode shares and ratios within each distance bin).
The distance distribution ratios are generally similar across the settings, with even greater similarity among the countries. The ratios are not significantly associated with mode share. The high cycling Netherlands and Germany have similar likelihood of cycling at different distance ranges as low-cycling settings such as England and Chile. Similarly, Finland and USA have similar propensities across all the distance bins, and both have the highest propensity for 0–2 km, but differ widely in the levels of cycling. Among the cities, high cycling geographies such as Amsterdam, Zurich and the German cities have remarkably similar distance propensities (relative likelihood of cycling a short trip relative to a longer one) as low cycling geographies of New York City and Santiago. The cities that differ greatly from all others are Bangalore and Delhi, where the propensity is among the lowest for 0–2 km, and much higher from longer distance bins of 2–5 km and 5–10 km. Also worth noting is the highest propensity for 20+ km among the cities of USA and Australia, as well as Sao Paulo.
3.3 Representation of women in cycling
In 8 out of 11 countries and 27 out of 35 selected cities, mode share of cycling among females is less than the mode share among males (see and ). In other words, in a large majority of the geographies, females are less likely to cycle for their trips than males. To express this gender difference as a single metric, we use the ratio of mode shares of cycling among females to those among males. The Pearson correlations between this ratio and overall mode share of cycling are 0.77 (P < 0.01) for the countries and 0.81(P < 0.001) for the cities, and the Spearman correlations are 0.92 (P < 0.001) and 0.85 (P < 0.001), respectively. These strong correlations show that gender gap in the likelihood of cycling is highly associated with the level of cycling. In cities and countries with cycling levels greater than 7%, females are at least as likely as males to cycle. In comparison, in geographies with cycling levels lower than 7%, females are on an average 50–60% less likely to cycle than males.
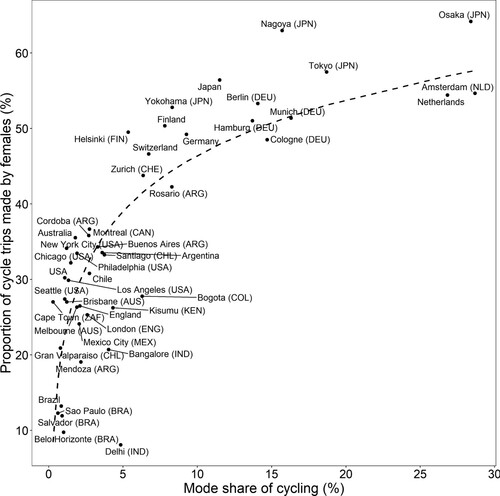
An alternate metric to measure gender representation in cycling is the proportion of all cycle trips that are made by females (see ). Unlike the ratio presented above, this metric expresses the gender gap in terms of number of trips made (and not as relative likelihood to cycle). shows this relationship for cities and countries combined. The curve shown in the figure is a logarithmic relationship fitted using 46 data points (35 cities and 11 countries). There is a strong positive association between level of cycling and female representation in cycling, with a steep increase in representation of females up to 5% mode share of cycling.
Figure 1. Gender representation and level of cycling in cities and countries (cities are mentioned along with their respective country 3-letter codes – ARG: Argentina, AUS: Australia, BRA: Brazil, CAN: Canada, CHL: Chile, COL: Colombia, ENG: England, DEU: Germany, IND: India, JPN: Japan, KEN: Kenya, MEX: Mexico, NLD: Netherlands, ZAF: South Africa, CHE: Switzerland, USA: United States of America)
Next, we present female representation ratios of cyclists stratified by age groups as described in the analysis section above (section 2.2 and see Box 1). presents these results for countries and for the cities. Percentage share of females in cycle and all trips by age groups are presented in SI-2.
Table 6. Age-specific female representation ratios of the urbanised areas countrywide (ratio of the proportion of women in cycling trips to the proportion of women in all trips within each age group; heat map shows gradation of all values combined, red: underrepresentation (ratio <0.7), yellow/green: moderate to proportional representation (0.7 <ratio< 1) and green: overrepresentation (>1); correlations of the representation ratios for each age group with the cycling mode shares, along with their P-values of statistical significance).
Table 7. Age-specific female representation ratios for the selected cities (ratio of the proportion of women in cycling trips to the proportion of women in all trips within each age group; heat map shows gradation of all values combined, red: underrepresentation (ratio < 0.7), yellow/green: moderate to proportional representation (0.7 < ratio < 1) and green: overrepresentation (> 1); correlations of the representation ratios for each age group with the cycling mode shares, along with their P-values of statistical significance).
The representation of women deteriorates in every age group with decreasing levels of cycling. This association is also evident from the correlation values between mode shares and these ratios. Person’s and Spearman’s correlations for the working age group are between 0.7 and 0.9, and for the older adults are between 0.65 and 0.8, and are statistically significant. The correlations for children are weak among the countries, but of moderate strength among the cities. Children have moderate underrepresentation to proportional representation of females across more geographies than the other two age groups.
Among the countries, for geographies with cycling mode share greater than 6%, females are moderately underrepresented or over-represented across all the age groups. Among the countries with mode share less than 6%, representation of females is the highest among the children and then worsens among the adults, with average ratios of 0.8, 0.5 and 0.5, for children, working age group, and older adults, respectively, indicating a strong age gradient in the representation of females. Among the cities, it is only with cycling mode share greater than 13% that females have equal representation across all the age groups. In the cities with mode share less than 13%, the average ratios are 0.8, 0.6 and 0.5 for children, working age group and older adults, respectively, indicating a similar age gradient as for the countries.
3.4 Representation of age groups in cycling
We calculated age representation ratio for the three age groups as described in section 2.2. A ratio less than one represents underrepresentation and greater than one represents overrepresentation. The tables for countries and selected cities are presented in SI-2. Among the nationwide urban areas, children have the highest representation in cycling, followed by working age group, and the older age group has the lowest representation, with average age representation ratios of 1.25, 1.06, 0.7, respectively, for the three age groups.
Among the countries, the representation of children and working age group do not show any relationship with cycling levels (correlations are statistically insignificant). Children are either moderately underrepresented or overrepresented across most countries, except in all the Latin American countries where children are underrepresented. Working age adults are overrepresented in almost all the countries, except Finland. In Finland, Germany, and Switzerland children have high overrepresentation in cycling (ratios from 1.8 to 2.7). In contrast to the other two age groups, the representation of older adults among cyclists has a strong positive association with mode shares of cycling, with Pearson correlation of 0.61 (P = 0.04) and Spearman’s correlation of 0.65 (P = 0.03). In other words, the representation of older adults improves with increasing mode share of cycling, even though this age group remains underrepresented across all the countries.
Among the selected cities, working age adults have the highest representation, followed by children and older adults, with the average representation ratios of 1.09, 0.91 and 0.67, respectively. Children and working age group have moderate correlations with mode shares, and the correlation values are statistically significant (P ≤ 0.05). The correlation is positive for children (Pearson: 0.35, Spearman: 0.4), implying that representation of children in cycling improves with increasing mode share of cycling. At the lowest levels of cycling, children are severely underrepresented and at the highest levels of cycling, they are often overrepresented. Children are also the only age group for which representation ratio reaches greater than 1.5, both within the cities and the countries. Berlin, Hamburg, and Helsinki are the three cities with the highest overrepresentation of children, as is the case with their respective countries.
The correlation for the working age group is negative (Pearson: −0.34, Spearman: −0.37). This age group is almost never underrepresented. It has proportional representation in the cities with the highest levels of cycling and overrepresentation in cities with lower levels of cycling. Similar to the finding among the countries, the representation of older age group is positively associated with mode share of cycling, with Pearson correlation of 0.42 (P=0.02) and Spearman correlation of 0.45 (P=0.01). This age group is underrepresented across most of the cities, though the underrepresentation is more often severe in settings with the lowest levels of cycling than those with higher levels of cycling.
3.5 Global cycling typology of cities
presents 5 clusters with a minimum of 6 geographies in one cluster and a maximum of 12. As described in section, clusters are formed using level of cycling, representation of females, and representation of age groups among cyclists. In the table, asterisk in place of cluster number indicates the two countries that were excluded for clustering but placed with same cluster as most of their constituting cities. The averages of the five vectors for each of the clusters are also presented in the table. The clusters could be summarised as follows:
Cluster 1: low-cycling, gender-unequal, highly age-unequal
Cluster 2: low-cycling, gender-unequal, age-equal (older adults)
Cluster 3: low-cycling, gender-unequal, age-equal (children only)
Cluster 4: medium-cycling, gender-equal, children over-represented
Cluster 5: high-cycling, women over-represented, age-equal (some variation)
Table 8. Cycling typology of cities and countries based on overall mode share of cycling, share of women among cycling trips, and age representation ratios (asterisks represent countries not included for clustering analysis, but placed next to the cluster with most of their contributing cities).
Clusters 1 through 3 include geographies with low levels of cycling with an average mode share ranging from 2 to 3.4%. In all three clusters, women are a minority among those making cycle trips, with an average share of all cycling trips that are made by women varying from 24% to 31%. In many of the geographies of clusters 1 and 2, there is underrepresentation of children in cycling. In cluster 1, older adults are also severely underrepresented while in Cluster 2, older adults have moderate underrepresentation or are equally represented. Among the five clusters, Cluster 2 has the highest average representation of older adults. In Cluster 3, only older adults are underrepresented.
In contrast clusters 4 and 5 have much higher levels of cycling with averages of 10% and 19%, respectively. The two clusters are constituted entirely of geographies of Finland, Germany, Japan, the Netherlands, and Switzerland. Women have either equal share (cluster 4) or are in majority (cluster 5) among cyclists, and older adults are mostly moderately underrepresented. These two clusters differ the most in terms of representation of children. This age group is overrepresented in all the geographies of cluster 4. In Cluster 5 also, half the geographies have overrepresentation of children while the other half have moderate underrepresentation. The only similarity across all the five clusters is the equal or over representation of working age group.
4. Discussion
4.1 Summary of findings
We analysed cycling behaviour at the country-level for urbanised areas in11 countries and at the city-level for 35 cities, with a mix of low-and middle-income and high-income countries. Among the countries, the Netherlands has the highest level of cycling (26.8%) and the lowest levels are in Brazil and USA (near 1%). Among the cities, median mode share is 3.3%, ranging from 0.3% (Cape Town) to 28.7% (Amsterdam). Distance distributions of cycling trips (normalised by distance distribution of all trips combined) are mostly similar across geographies irrespective of their cycling levels. Geographies with low levels of cycling have a higher likelihood of cycling for work trips than non-work trips, while those with high levels of cycling, have equal likelihood for the two purposes or higher likelihood for non-work trips. There is a strong positive association between representation of women among cyclists and the level of cycling, with almost all settings with cycling mode share greater than 8% have equal or overrepresentation of female cyclists. The representation of children and older adults varies greatly, although older people and children tend to be better represented in settings with higher levels of cycling, particularly at country-level. Finally, we classified cities and countries into typologies showing distinct patterns of representation of population demographics among cyclists with respect to levels of cycling.
4.2 Strengths and weaknesses
A major strength of our study is the inclusion of a wide range of settings with representation from multiple world regions and income levels, although our selection of settings is opportunistic within regions. By expressing metrics of cycling as ratios relative to general population or all trips, we highlighted differences and similarities across the settings that would otherwise be hidden by multiple confounders such as age, gender, distance, and cycling levels. We used classification of urban and non-urban as reported by different travel survey datasets. Given the variation in how different countries define urban areas, this may bring some inconsistency in the results at the country level. For the geographies that reported travel diary for more than a day, we are more likely to capture cycling trips that are not made on a regular basis, which may bring some bias with respect to the geographies where only one day of travel is reported (Shaw et al., Citation2020). Further, travel surveys are better at reporting cycling to reach a destination than recreational cycling, though they do report the latter to some extent. Activity-diary surveys are likely to report both equally well. It is likely that recreational cycling may have a relatively significant share in cities with low levels of cycling, such as the USA. Our definition of main mode also excludes cycling that is done for a part of the trip, for example, to access public transportation. Our analysis could not differentiate between age and cohort effect. This limitation can only be overcome by analysis of longitudinal data (Scheiner & Holz-Rau, Citation2013; Thakuriah, Menchu, & Tang, Citation2010). An important confounder that we did not include in our analysis is household income. Breakdown of cycling use by income is also important from an equity perspective; however, it would be challenging to analyse in a comparable way, especially between countries with very different income levels.
4.3 Meaning of our findings
The distance distribution of cycling seems unrelated to how common cycling is in a setting, although there is some evidence of regional differences. This is a novel finding as we did not find research studies comparing distance-based propensities across multiple different settings as we have done here. Since 50–60% of all trips (across all modes) are shorter than 5 km (see SI-2), a high propensity of cycling for shorter trips alone can result in high levels of cycling. We found that at higher levels of cycling, it is either as frequently used for non-work trips as for work trips, or even more frequently for non-work trips. This is also to our knowledge a novel finding in cross-national context. It suggests that, to grow cycling, a focus beyond the commute to work may be needed; which fits with greater age and gender equity, given patterning of trip purposes by age and gender (Collins & Tisdell, Citation2002; Shaw et al., Citation2020). The findings on shorter distance and non-commute trips imply that making neighbourhoods cycling friendly (e.g. mini-Hollands programme in London, UK; Aldred, Croft, & Goodman, Citation2019), or developing safer routes to school, should be equally high on the agenda as cycling corridors that often cater to commuting traffic.
Our study, like other comparative work (e.g. Götschi et al., Citation2015; Pucher & Buehler, Citation2006; Pucher, Garrard, & Greaves, Citation2011) highlights associations between cycling levels and age and gender equity in cycling. Places with cycling levels greater than 7% have good representation of women as well as good representation of children and the working age group, and older adults are reasonably represented. In places with lower levels of cycling, women are always a minority and children and/or older adults are often severely under-represented. These findings imply that, in low-cycling cities, developing cycling infrastructure to meet the observed demand (e.g. middle-aged men commuting to work) may perpetuate gender and age inequalities. It is therefore important that evaluations of cycling policies should not only focus on overall use but also usage by gender and age, to ensure equitable growth in cycling.
Our cycling typologies provide further insight into equity and cycling. The three low-cycling clusters have high levels of gender inequality, suggesting that the path towards higher cycling levels must involve addressing gender inequalities in cycling. If this is done, the rewards are potentially great: cluster 5 shows an over-representation among women, thus the suppressed demand among this group is much larger than among men. Age shows somewhat different patterns. Some lower-cycling contexts have achieved higher levels of age equity for older adults or for children (but not, generally, for both). The highest-cycling contexts have generally good age equity although there is some variation, but the fourth cluster (containing contexts with medium levels of cycling – near 10% on average mode share) has notable over-representation among children. However, the same is true of some contexts (e.g. USA; Brisbane, Australia) in low-cycling Cluster 3. Thus, it seems possible to have cycling stuck at low levels alongside relatively good representation of children among cyclists, while the same is not true for women. Perhaps this is not surprising given the association of cycling with childhood, which can be a barrier to its consideration as a mainstream transport mode (Aldred, Citation2012).
Our study does not explain the various factors driving variation of cycling levels nor of gender and age representation across the settings. Other literature has suggested reasons why we might expect women, children, and older people to be under-represented in low-cycling contexts. Specifically, many studies highlight differences in risk tolerance (e.g. Garrard et al., Citation2008), in other words, where risk and/or perceived risk of cycling are higher, women, children (or parents on their behalf), and older people are even more likely to be deterred than are men and younger adults. The concern for safety among children has been found to be greater in large cities than in smaller towns (Jones, Davis, & Eyers, Citation2000), possibly due to differences in traffic volume. This may explain our finding of greater underrepresentation of children in the selected cities than in nationwide urban areas, as the latter is dominated by multiple smaller urban areas.
In our typologies, we found that the clusters representing high levels of cycling and good gender and age representation include Germany, Japan, and the Netherlands. In these countries, there is infrastructure provision for cyclists such as protected cycle paths and secure parking facilities. These are complemented with motor traffic reduction and calming in residential neighbourhoods, and land-use, taxation, and transport policies that discourage use and ownership of cars, such as mixed-use and high population density, higher taxes on car purchase and fuel, and limited parking spaces (Berent & Yoshida, Citation2017; Pucher & Buehler, Citation2008; Pucher, Dill, & Handy, Citation2010). Unlike the high-cycling group, the geographies of low-cycling clusters represent a greater diversity of world regions and income levels. Across most of these geographies, cycling supportive infrastructure is rare, and policies to deter car use are often lacking, as in the USA and Australia (Buehler, Citation2011; Pucher et al., Citation2011). In many low-and-middle income countries, while land-use is comparatively less car dependent and ownership of vehicles is still low, transport policies are often car-centric and traffic danger is high. Bogota city, with the highest cycling level among low-cycling clusters, is an encouraging example, where cycling infrastructure supported by political will and advocacy groups have resulted in improved levels of cycling in the recent times (Rosas-Satizábal & Rodriguez-Valencia, Citation2019).
4.4 Unanswered questions and future research
The unit of analysis in our study is a trip or an individual that suited our research questions to identify those who cycle and those who don’t. Future work should explore if the use of a tour as unit of analysis is a better approach to study cycling propensities. Further research could focus on other dimensions of equity not considered here, for instance, disability, ethnicity, or income levels, although these factors are harder to compare across diverse contexts than gender or age. Research should examine the different factors that could potentially explain differences in the levels of cycling, for example, injury risk, traffic mix, infrastructure provision, speed limits and urban form. We found that Delhi, Bengaluru, Kisumu and Bogota, all located in low-and-middle income countries across three different continents, have much lower representation of women than expected at their levels of cycling (see ). Future studies should investigate what gender norms and cultural factors are in play in these settings that result in unequal access to transport modes (and specifically cycling), of which there is some evidence from India and Colombia (Montoya-Robledo et al., Citation2020; Phadke, Citation2013). Future work should include other major settings like China and many parts of Southeast Asia. Finally, longitudinal research could explore the extent to which patterns change over time as levels of cycling change.
Supplementary_Material
Download Zip (275.8 KB)Acknowledgements
Contributions by RG, JW, LG, MT and LT were funded by TIGTHAT, an MRC Global Challenges Project MR/P024408/1. AG was funded by METAHIT, an MRC Methodology Panel project (MR/ P02663X/1). BZD is supported by an RMIT VC Fellowship. This project (JW, RG, LT) has received funding from the European Research Council (ERC) under the Horizon 2020 research and innovation programme (grant agreement No 817754). This material reflects only the author's views and the Commission is not liable for any use that may be made of the information contained therein. JW was partly funded by the Global Diet and Activity Research Group. This group was funded by the National Institute for Health Research (NIHR) (16/137/64) using UK aid from the UK Government to support global health research. The views expressed in this publication are those of the author(s) and not necessarily those of the NIHR or the UK Department of Health and Social Care. We acknowledge Prof Ashish Verma at Indian Institute of Science, Bengaluru for providing dataset for Bengaluru city in India. We acknowledge the support of Dr Tolullah Oni from the Global Diet and Activity Research Group and Network (GDAR) who facilitated the acquisition of data for Kisumu (Kenya). This study used the nationwide person trip survey data (2010 and 2015), provided by the Ministry of Land, Infrastructure, Transport and Tourism of Japan. The authors alone are responsible for the views expressed in this article and they do not necessarily represent the views, decisions or policies of the institutions with which they are affiliated.
Disclosure statement
No potential conflict of interest was reported by the author(s).
Correction Statement
This article has been republished with minor changes. These changes do not impact the academic content of the article.
Additional information
Funding
References
- Aguilar-Farias, Nicolas, Andrea Cortinez-O’Ryan, Damian Chandia-Poblete, & Kristiann C. Heesch. 2019. Prevalence and correlates of transport cycling in Chile: Results from 2014 to 2015 national surveys. Journal of Transport & Health, 14, 100594.
- Aldred, Rachel. 2012. Governing transport from welfare State to hollow State: The case of cycling in the UK. Transport Policy, 23, 95–102.
- Aldred, Rachel, Joseph Croft, & Anna Goodman. 2019. Impacts of an active travel intervention with a cycling focus in a suburban context: One-year findings from an evaluation of London’s in-progress mini-Hollands programme. Transportation Research Part A: Policy and Practice, 123(June 2018), 147–169. https://doi.org/https://doi.org/10.1016/j.tra.2018.05.018
- Aldred, Rachel, James Woodcock, & Anna Goodman. 2016. Does more cycling mean more diversity in cycling? Transport Reviews, 36(1), 28–44. https://doi.org/https://doi.org/10.1080/01441647.2015.1014451
- Alessandretti, Laura, Ulf Aslak, & Sune Lehmann. 2020. The scales of human mobility. Nature, 587(7834), 402–407. https://doi.org/https://doi.org/10.1038/s41586-020-2909-1
- Berent, Pola, & Nagahiro Yoshida. 2017. Understanding the nature of walking and cycling for transport in Japan. Memoirs of the Faculty of Engineering, Osaka City University, Japan, 58, 25–43.
- Buehler, Ralph. 2011. Determinants of transport mode choice: A comparison of Germany and the USA. Journal of Transport Geography, 19(4), 644–657. https://doi.org/https://doi.org/10.1016/j.jtrangeo.2010.07.005
- Buehler, Ralph, & John Pucher. 2012a. Cycling to work in 90 large American cities: New evidence on the role of bike paths and lanes. Transportation, 39(2), 409–432. https://doi.org/https://doi.org/10.1007/s11116-011-9355-8
- Buehler, Ralph, & John Pucher (Eds.), 2012b. International overview: Cycling trends in Western Europe, North America, and Australia. City Cycling (MIT Press), 9–29.
- Collins, Darrian, & Clem Tisdell. 2002. Gender and differences in travel Life cycles. Journal of Travel Research, 41(2), 133–143. https://doi.org/https://doi.org/10.1177/004728702237413
- Garrard, Jan, Geoffrey Rose, & Sing Kai Lo. 2008. Promoting transportation cycling for women: The role of bicycle infrastructure. Preventive Medicine, 46(1), 55–59.
- Goel, Rahul, & Dinesh Mohan. 2020. Investigating the association between population density and travel patterns in Indian cities—An Analysis of 2011 census data. Cities, 100, 102656.
- Goodman, Anna, & Rachel Aldred. 2018. Inequalities in utility and leisure cycling in england, and variation by local cycling prevalence. Transportation Research Part F: Traffic Psychology and Behaviour, 56, 381–391.
- Götschi, Thomas, Marko Tainio, Neil Maizlish, Tim Schwanen, Anna Goodman, & James Woodcock. 2015. Contrasts in active transport behaviour across four countries: How do they translate into public health benefits? Preventive Medicine, 74, 42–48.
- Grudgings, Nick, Alex Hagen-Zanker, Susan Hughes, Birgitta Gatersleben, Marc Woodall, & Will Bryans. 2018. Why don’t more women cycle? An Analysis of female and male commuter cycling mode-share in England and wales. Journal of Transport and Health, 10(April), 272–283. https://doi.org/https://doi.org/10.1016/j.jth.2018.07.004
- Heinen, Eva, Bert van Wee, & Kees Maat. 2010. Commuting by bicycle: An overview of the literature. Transport Reviews, 30(1), 59–96. https://doi.org/https://doi.org/10.1080/01441640903187001
- Jones, Linda, Adrian Davis, & Tim Eyers. 2000. Young people, Transport and risk: Comparing access and independent mobility in urban, Suburban and rural environments. Health Education Journal, 59(4), 315–328. https://doi.org/https://doi.org/10.1177/001789690005900405
- Krizek, Kevin J., Pamela Jo Johnson, & Nebiyou Tilahun. 2005. Gender differences in Bicycling Behavior and facility preferences. Research on Women’s Issues in Transportation, 2, 31–40.
- Lovelace, Robin, Anna Goodman, Rachel Aldred, Nikolai Berkoff, Ali Abbas, & James Woodcock. 2017. The propensity to cycle tool: An open source online system for sustainable transport planning. Journal of Transport and Land Use, 10(1), 505–528.
- Lutz, Wolfgang, Warren Sanderson, & Sergei Scherbov. 2008. The coming acceleration of global population ageing. Nature, 451(7179), 716–719. https://doi.org/https://doi.org/10.1038/nature06516
- Montoya-Robledo, Valentina, Laureen Montes Calero, Valeria Bernal Carvajal, Diana Carolina Galarza Molina, Wilmer Pipicano, Andrés Javier Peña, Christian Pipicano, et al. 2020. Gender stereotypes affecting active mobility of care in bogotá. Transportation Research Part D: Transport and Environment, 86(88), 102470. https://doi.org/https://doi.org/10.1016/j.trd.2020.102470
- Mueller, Natalie, David Rojas-Rueda, Maëlle Salmon, David Martinez, Albert Ambros, Christian Brand, Audrey De Nazelle, Evi Dons, Mailin Gaupp-Berghausen, & Regine Gerike. 2018. Health Impact assessment of cycling network expansions in European cities. Preventive Medicine, 109, 62–70.
- Phadke, Shilpa. 2013. Unfriendly bodies, hostile cities: Reflections on loitering and gendered Public space. Economic and Political Weekly, 48(39), 50–59.
- Pucher, John, & Ralph Buehler. 2006. Why Canadians cycle more than Americans: A Comparative analysis of bicycling trends and policies. Transport Policy, 13(3), 265–279.
- Pucher, John, & Ralph Buehler. 2008. Making cycling irresistible: Lessons from the Netherlands, Denmark and Germany. Transport Reviews, 28(4), 495–528. https://doi.org/https://doi.org/10.1080/01441640701806612
- Pucher, John, Ralph Buehler, David R. Bassett, & Andrew L. Dannenberg. 2010a. Walking and Cycling to health: A comparative analysis of city, state, and international data. American Journal of Public Health, 100(10), 1986–1992.
- Pucher, John, Ralph Buehler, Dafna Merom, & Adrian Bauman. 2011a. Walking and cycling in the United States, 2001-2009: Evidence from the national household travel surveys. American Journal of Public Health, 101(SUPPL. 1), 310–317. https://doi.org/https://doi.org/10.2105/AJPH.2010.300067
- Pucher, John, Jennifer Dill, & Susan Handy. 2010b. Infrastructure, programs, and policies to increase bicycling: An international review. Preventive Medicine, 50, S106–S125. https://doi.org/https://doi.org/10.1016/j.ypmed.2009.07.028
- Pucher, John, Jan Garrard, & Stephen Greaves. 2011b. Cycling down under: A Comparative analysis of bicycling trends and policies in Sydney and Melbourne. Journal of Transport Geography, 19(2), 332–345. https://doi.org/https://doi.org/10.1016/j.jtrangeo.2010.02.007
- Reis, Rodrigo S., Adriano A. F. Hino, Diana C. Parra, Pedro C. Hallal, & Ross C. Brownson. 2013. Bicycling and walking for transportation in three Brazilian cities. American Journal of Preventive Medicine, 44(2), e9–e17.
- Rosas-Satizábal, Daniel, & Alvaro Rodriguez-Valencia. 2019. Factors and policies explaining the emergence of the bicycle commuter in bogotá. Case Studies on Transport Policy, 7(1), 138–149.
- Sá, Thiago Hérick de, Leandro Fórnias Machado de Rezende, Maria Carolina Borges, Priscila Missaki Nakamura, Sebastian Anapolsky, Diana Parra, Fernando Adami, & Carlos Augusto Monteiro. 2018. Prevalence of active transportation among adults in Latin America and the Caribbean: A systematic review of population-based studies. Revista Panamericana de Salud Pública, 41, e35.
- Sá, Thiago Hérick, Ana Clara Duran, Marko Tainio, Carlos Augusto Monteiro, & James Woodcock. 2016. Cycling in São paulo, Brazil (1997–2012): Correlates, time trends and health consequences. Preventive Medicine Reports, 4, 540–545.
- Scheiner, Joachim, & Christian Holz-Rau. 2013. A comprehensive study of life course, cohort, and period effects on changes in travel mode use. Transportation Research Part A: Policy and Practice, 47, 167–181. https://doi.org/https://doi.org/10.1016/j.tra.2012.10.019
- Schneider, Florian, Winnie Daamen, Sascha Hoogendoorn-Lanser, & Serge Hoogendoorn. 2018. How Far Do people walk and cycle for different activities? Evidence from the Netherlands. In HEART 2018: 7th Symposium of the European Association for Research in Transportation, 5–7 September, Athens, Greece.
- Shaw, Caroline, Marie Russell, Michael Keall, Sara MacBride-Stewart, Kirsty Wild, Dory Reeves, Rebecca Bentley, & Alistair Woodward. 2020. Beyond the bicycle: Seeing the context of the gender gap in cycling. Journal of Transport and Health, 18(August 2019), 100871. https://doi.org/https://doi.org/10.1016/j.jth.2020.100871
- Singleton, Patrick A., & Tara Goddard. 2016. Cycling by choice or necessity? Exploring the gender gap in bicycling in Oregon. Transportation Research Record, 2598, 110–118. https://doi.org/https://doi.org/10.3141/2598-13
- Thakuriah, Piyushimita, Shashi Menchu, & Lei Tang. 2010. Car ownership among young adults: Generational and period-specific perspective. Transportation Research Record, 2156(1), 1–8.
- Tin Tin, Sandar, Alistair Woodward, Simon Thornley, & Shanthi Ameratunga. 2009. Cycling and walking to work in New Zealand, 1991-2006: Regional and individual differences, and pointers to effective interventions. International Journal of Behavioral Nutrition and Physical Activity, 6(1), 64. https://doi.org/https://doi.org/10.1186/1479-5868-6-64
- UNDESA. 2019. World Population Prospects 2019. 2019. https://population.un.org/wpp/
- World Bank. 2019. GDP per Capita (Current US$). 2019. https://data.worldbank.org/indicator/ny.gdp.pcap.cd
- Zhao, Chunli, Thomas Alexander Sick Nielsen, Anton Stahl Olafsson, Trine Agervig Carstensen, & Xiaoying Meng. 2018. Urban form, demographic and socio-economic correlates of walking, cycling, and e-biking: Evidence from eight neighborhoods in Beijing. Transport Policy, 64, 102–112.
