
 ?Mathematical formulae have been encoded as MathML and are displayed in this HTML version using MathJax in order to improve their display. Uncheck the box to turn MathJax off. This feature requires Javascript. Click on a formula to zoom.
ABSTRACT
The interest in the socioeconomic impact assessments of the high-speed rail (HSR) system is burgeoning as many countries are considering investing in such a system. While extensive studies have provided a wide range of evaluations of HSR on the socioeconomic impact, primarily from an ex-post perspective, it remains unclear how reliable the evaluation outcomes were, given the variety of data, method and research framework being adopted. This paper provides a comprehensive review of the socioeconomic impact studies of high-speed rail (HSR), based on 242 academic publications. In particular, we examined to what extent the impact outcome is influenced by various modelling factors, such as data, model, and research design, using meta-analysis based on 368 empirical estimates derived from 45 empirical studies. Our analysis confirms that the factors of research design (e.g. variables, data, and modelling method) do have various influences on the empirical estimates of HSR project appraisals. In the end, the paper discusses the implications for future infrastructure project appraisals.
1. Introduction
High-Speed Rail (HSR) has received increasing attention worldwide. While HSR has experienced substantial development in many countries, such as France, Germany, Italy, Spain, Japan, and China, the development of HSR in other countries, such as the U.K., United States, India, and Malaysia has undergone substantial debate as it remains unclear whether the gargantuan cost of developing an HSR may be offset by the benefits the system is expected to generate.
One critical requirement of the decision-making of infrastructure investment is that a thorough socioeconomic impact assessment has to be implemented. The objective is to assess whether the project has the potential to generate positive impacts on society and the economy so that the validity and merit of the investment can be justified. The socioeconomic impact of HSR is phenomenal as the system may influence various aspects, such as the economy, the environment, tourism, housing, and the labour market. In addition, the effect may vary considerably depending on the scale of assessment and the area of interest.
Given the increasing interest in HSR planning and investment worldwide, extensive studies have assessed the socioeconomic impacts of HSR from different perspectives (Andersson, Shyr, & Fu, Citation2010; Cartenì, Pariota, & Henke, Citation2017; Chen, Xue, Rose, & Haynes, Citation2016; Diao, Citation2018; Pagliara, Mauriello, & Garofalo, Citation2017; Wang, Liu, Sun, & Liu, Citation2016). Although most of these studies evaluated the impact of HSR from an ex-post perspective, research findings are generally inconsistent. For example, Chen and Haynes (Citation2017) revealed that regional economic disparity in China has decreased after the introduction of HSR. Conversely, Sun and Mansury (Citation2016) showed that the regional economic gaps in terms of household income were enlarged due to the introduction of HSR. In addition, it is also unclear how reliable and robust the results of the empirical studies are because each assessment was conducted based on a specific analytical framework and assumptions. As a result, the implications for planning and policy of these studies could be questionable as these outcomes could hardly be validated.
While a few pioneering studies have provided reviews of the impact assessment of transport systems on related topics, such as multimodal transportation (Roberts, Melecky, Bougna, & Xu, Citation2020), land and housing impact (Bešinović, Citation2020; Wu, Zheng, Wang, & Du, Citation2020), and competition of HSR with aviation (Zhang, Wan, & Yang, Citation2019), there is still a lack of a comprehensive and systematic review of socioeconomic impact assessment of the HSR system.
Hence, the objective of this paper is to fill this research gap by addressing the following research questions: 1) how the socioeconomic impacts of HSR were evaluated in the literature and 2) how the empirically estimated outcome is influenced by various factors, such as the geographic scale of analysis, data, modelling method, control variables, etc.
This study contributes to the literature in the following aspects. Firstly, we provide a systematic review of the socioeconomic impact assessment of HSR projects based on 242 empirical studies published between 1997 and 2020. To our limited understanding, this is the first attempt to provide a comprehensive and in-depth knowledge of the literature. Such an understanding will help us identify the research gaps in this field and directions for future research. Secondly, we examine the sensitivity of the evaluation outcomes to the influence of various contributing factors through a meta-analysis. The research findings guide scholars to improve the impact evaluation of infrastructure in future impact assessment. Thirdly, this study provides important implications for planners and policymakers to reconsider the value of transportation infrastructure investment by understanding HSR’s effects from various angles.
The rest of the paper is organised as follows. Section 2 provides a detailed review of the studies that examined the socioeconomic impacts of HSR from various perspectives. Section 3 introduces the data and the meta-analysis method. Section 4 discusses the results, whereas section 5 discusses limitations and future research directions.
2. Literature review
The review of the socioeconomic impacts of HSR focuses on the following seven aspects: change in accessibility, the effects on other transportation modes, environment, tourism, housing and land use, labour market and industry, and economic performance. These aspects are identified and selected based on two considerations. First, they were identified based on the frequency of keywords of the reviewed articles. Second, these aspects were selected to provide comprehensive coverage of the various aspects of socioeconomic activities, based on the classification of other relevant studies (Chen, Haynes, Zhou, & Dai, Citation2019). In addition, it should be noted that tourism impact and housing impact were reviewed separately rather than included in the industrial impact since their focuses were different. Specifically, tourism impact focuses on effects on the tourism demand or destination choices; housing impact concentrates on the impact on the hedonic value of houses which refers to people’s subject experience on the housing price rather than the housing industry. Conversely, the industrial impact emphasises industrial structures, geographic distribution, and labour activities across regions.
The conceptual framework of the socioeconomic impact of HSR investment is illustrated in . The development of HSR generates a direct effect on travel demand through an improvement in transportation accessibility and increased substitution and complementarity with other transport modes, such as aviation and highways. The travel effects may further affect other aspects such as the environment, tourism, housing and land use, labour market, and economic performance, which may eventually generate an impact on the economy and society.
Figure 1. The conceptual framework of the socioeconomic impact of HSR investment
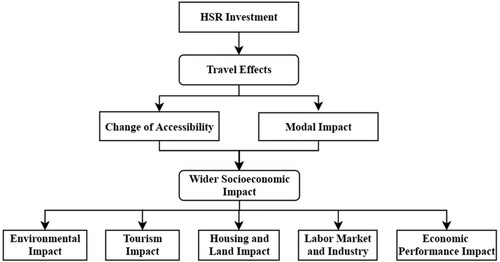
2.1 Change of accessibility
Accessibility refers to the capacity of being reached or accessed by various transportation modes (Cao, Liu, Wang, & Li, Citation2013). It can be represented by the travel time to a place, the daily accessible population, and the economic opportunities in that place. Change of accessibility is generally considered a key outcome of HSR development. The evaluation of accessibility changes of HSR mainly addresses the following two questions: to what extent the accessibility varies after the introduction of HSR, and whether the change in accessibility is balanced among different regions. Most studies suggest that HSR improves intercity accessibility due to travel time savings. For example, Wang et al. (Citation2016) revealed that accessibility is likely to improve by 9.6% in the Jiangsu Province in China by 2030 when 95% of its counties are served by HSR. Conversely, other studies indicated that the accessibility impact of HSR is limited in certain cities/regions, such as only in big cities and the cities being served directly by an HSR. For example, Sánchez-Mateos and Givoni (Citation2012) showed that the accessibility of some cities in the U.K. was not improved by HSR because its positive impacts on accessibility were restricted to major cities with HSR stations; other cities without a direct connection to HSR received minimal benefits. The authors also suggested that a better approach to evaluate the impact of HSR on accessibility requires covering a wider geographic area beyond the cities that are served by HSR. Similarly, Chen and Wei (Citation2013) argued that the development of the Hangzhou East HSR station has a limited impact on urban accessibility because the new station is located in a suburban area that is relatively far from the city centre. As a result, they indicated that the location of HSR stations should be determined more cautiously to maximise accessibility benefits.
The issue of whether the changes in accessibility are balanced has been evaluated at various geographic scales. For instance, Jin, Xu, Lu, and Huang (Citation2013) revealed that the change in accessibility was quite different among various stations after the opening of the Shanghai – Nanjing HSR line. Cities located in economically developed areas tend to benefit the most from accessibility improvements than those without HSR, or those are located in less developed regions (Zhu et al., Citation2016). Conversely, Wang et al. (Citation2016) indicated that although central cities generally have higher accessibility than peripheral cities, changes in accessibility were found to be more significant in peripheral cities after the introduction of HSR. In addition, accessibility changes were also uneven at different geographic levels. For example, Gutiérrez (Citation2001) revealed that after the opening of the Madrid – Barcelona – French HSR line, accessibility inequalities were found to have increased at the national level but decreased at the corridor levels. The evidence suggests that the results of accessibility assessments can be sensitive to the geographic scope of the analysis. Hence it deserves further attention in future assessments.
Depending on the specific focus, accessibility is often measured using indicators, such as weighted average travel time (WATT), daily accessibility (DA), and potential accessibility (PA) (Cao et al., Citation2013; Wang et al., Citation2016). Given that each indicator represents different aspects of accessibility, the outcomes of accessibility analyses can vary even when the same system is analysed. For example, Gutiérrez (Citation2001) evaluated the accessibility impact of the Madrid – Barcelona – French HSR line using the aforementioned indicators. Surprisingly, the evaluation of the outcomes of accessibility changes was quite different: the areas with the greatest accessibility changes were measured by daily accessibility, whereas the changes were small if measured by potential accessibility. The results were found to be more dispersed when measured by weighted average travel time. To identify the common factors of different indicators, Martín and Reggiani (Citation2007) developed a comprehensive accessibility indicator using the principal component analysis method. In addition, accessibility was measured using the shortest path method (Moyano, Martínez, & Coronado, Citation2018; Shaw, Fang, Lu, & Tao, Citation2014). Specifically, the shortest paths were calculated by travel time, travel distance, or travel cost based on live timetables and ticket prices. The change of accessibility thus can be displayed by comparing the average shortest paths at different times.
2.2 Modal impact
The socioeconomic impact of HSR has also been extensively examined from the perspective of modal competition, with a comparative analysis between HSR and other modes such as air, conventional rail, bus, and private vehicle. The impacts of HSR on aviation have received the most attention, given that HSR and short-haul air services are highly competitive. In general, the literature revealed a mixed impact of HSR on air transportation.
Some studies indicated that HSR has a negative impact on air transportation due to its substitutional effect on air, which results in reductions in air travel demand and airlines’ seat capacity (Jiménez & Betancor, Citation2012; Wan, Ha, Yoshida, & Zhang, Citation2016; Zhang, Yang, & Wang, Citation2017). However, the substitutional effects of HSR on air travel vary due to the influence of factors, such as routes, travel distance, city type, and countries (Chai et al., Citation2018; Chen, Citation2017; Wan et al., Citation2016). Castillo-Manzano, Pozo-Barajas, and Trapero (Citation2015) found that only part of HSR passenger demand was substituted from air travel. Some studies, such as (Behrens & Pels, Citation2012; Danapour, Nickkar, Jeihani, & Khaksar, Citation2018; Li & Sheng, Citation2016) indicated that the major factors that influence HSR and air transportation competition include price, travel time, service frequency, and travel distance.
The development of HSR was also found to have positive impacts on air transportation. The competition can promote the expansion of air transport networks to cover more fringe markets (Jiang & Zhang, Citation2016), which then provides more options for passengers. In addition, the cooperation between HSR and aviation through strategies such as enhancing modal integration by seamless intermodal transfer is also likely to facilitate intercity travel experience and promote the growth of air transportation services (Xia & Zhang, Citation2017). The substitution between HSR and air transportation can also generate positive impacts under disruptive events such as transportation system failures or natural disasters (Chen & Wang, Citation2019). The development of HSR has also been found to have a positive outcome on air transportation in terms of reducing congestion at bigger airports (Takebayashi, Citation2016).
2.3 Environmental impact
The evaluations of the environmental impacts of HSR primarily focused on two key issues. The first issue is about how the development of HSR affects the environment in terms of CO2 emissions. For instance, Chen et al. (Citation2016) showed that the development of HSR in China has a substantial effect on generating CO2 emissions due to increased demand. Similarly, Chang and Kendall (Citation2011) indicated that although its negative effect on climate change could be offset after an extended period, HSR contributes to CO2 emissions more substantially during its construction. In particular, the production of construction materials comprises 80% of HSR’s CO2 emissions. Yue et al. (Citation2015) showed that HSR operation also generates negative environmental impacts because the production of electricity for the operation of high-speed trains would increase the emission of greenhouse gas. In sum, it should be noted that a comprehensive environmental impact assessment of HSR should include emissions that occurred during both the construction and operation phases.
The second issue being investigated extensively concerns in what circumstances HSR can be environmentally beneficial. For instance, it is generally recognisd that the operation of HSR can reduce CO2 emissions by substituting the demand from other transportation modes that have higher emission rates, such as short-haul air and automobiles. However, the effect of HSR on CO2 emission reduction has been found limited (Åkerman, Citation2011; Bueno, Hoyos, & Capellán-Pérez, Citation2017; Dalkic, Balaban, Tuydes-Yaman, & Celikkol-Kocak, Citation2017; Robertson, Citation2016; Westin & Kågeson, Citation2012). For example, Dalkic et al. (Citation2017) argued that in the case of Turkey, the effect of HSR in reducing CO2 emission is limited because it has attracted passengers from buses rather than air travel and cars, and the latter two have higher CO2 emissions than the former. In addition, mode access to HSR is also essential. For instance, HSR stations with access by public transit are more environment-friendly than those that could only be accessed by private cars. In sum, whether or not the environmental benefits of HSR can be achieved depends on two critical factors: the degree of modal shift from other modes and the type of energies used for the electricity generation for HSR (Åkerman, Citation2011; Westin & Kågeson, Citation2012).
2.4 Tourism impact
Most studies investigating the impacts of HSR on tourism have found that the opening of HSR promotes tourism growth (Cartenì et al., Citation2017; Pagliara et al., Citation2017). However, some studies found that the impact of HSR on tourism was negligible in small cities (Albalate, Campos, & Jiménez, Citation2017), while other studies showed that HSR contributes to changes in the spatial structure of tourism (Huang, Xi, & Ge, Citation2017; Wang, Huang, Zou, & Yan, Citation2012; Wang, Liu, & Wang, Citation2018). For example, Wang et al. (Citation2012) revealed that HSR causes a redistribution of the tourist demand, as well as cooperation and competition among tourist markets on a wider geographic range. Huang et al. (Citation2017) showed that HSR increased the hierarchical differences in regional tourism.
Different research methods have been adopted to evaluate the impact of HSR on tourism. The choice destination approach, which is often conducted based on survey data, focuses on the estimation of how tourists’ travel choice is influenced by HSR service. For example, Pagliara, La Pietra, Gomez, and Manuel Vassallo (Citation2015) discovered that more tourists rode HSR to visit cities near Madrid after the opening of the Spanish HSR. In addition, studies have also found that the impact of HSR on tourism may also vary by different HSR systems. For instance, Delaplace, Pagliara, Perrin, and Mermet (Citation2014) showed that the presence of HSR had a positive and significant effect on tourists’ willingness to visit Paris, while it had no significant impact on tourists’ desire to visit Rome. The authors suspected that such a phenomenon might be because the French HSR system had been deployed for a long time while the Italian HSR system was relatively new. Hence, most travellers were still unaware of the system at the time when the survey was conducted.
Using gravity models is another key approach of tourism impact assessment of HSR. Based on the economic geography theory, most studies focus on examining the spatial effects of HSR, such as agglomeration and the diffusion of the tourism market. For instance, Huang et al. (Citation2017) found that tourists tend to concentrate at core cities after the opening of HSR, which conforms with the core–periphery theory. HSR may, as a result, also enlarge the imbalances in regional development of tourism. For instance, Wang, Liu, et al. (Citation2018) found that cities with HSR tend to attract more tourists than cities without it.
The impact of HSR on the tourism sector has also been examined using econometric analyses. Tourism output is often represented using variables such as the number of tourists, the number of overnights stays, and tourism revenue, whereas the effects of HSR are often measured by either a dummy variable indicating if HSR exists in the study area or a dummy variable indicating if tourists’ choice of destination is influenced by HSR. Continuous variables, such as HSR ridership and the number of HSR destinations, have also been adopted to reflect the effect of HSR (Albalate & Fageda, Citation2016; Castillo-Manzano, Castro-Nuño, López-Valpuesta, Pedregal-Tercero, & Garrido-Michó, Citation2018). The results are found to vary substantially given the different characteristics of research design, such as city size, trip distance, the degree of HSR development, the origin of tourists, and geographic scale. For instance, Albalate et al. (Citation2017) showed that the effects of HSR on tourism are more significant in larger cities when other factors, such as population and hotel prices, were controlled. Cartenì et al. (Citation2017) compared tourists’ preferences to HSR services with different distance range and revealed that people prefer to utilise HSR services when the trip is more than 400 km. Castillo-Manzano et al. (Citation2018) found that HSR’s effects are more significant on domestic tourism than foreign tourism because air transportation is still the main transportation mode for international trips, but HSR increases the number of foreign tourists in cities with or near HSR stations. A similar result was also confirmed in the case of China (Chen et al., Citation2019)
In sum, although many studies have investigated the impact of HSR on tourism demand, the results are inconsistent, which is partially due to different regions and systems being evaluated. Another important reason, as mentioned earlier, is due to different research designs. As Chen and Haynes (Citation2015b) indicated, given that the effects of HSR on tourism can be measured at different levels, the research findings are expected to be dissimilar.
2.5 Housing impact
Given that HSR has unique characteristics, such as a higher speed of operation and lower pollution than conventional diesel engines, it is expected that the housing impacts of HSR will be different from that of the conventional rail system. It is assumed that the development of HSR is likely to generate a positive impact on housing prices due to the improvement in accessibility. However, the magnitude of impacts could vary among different cities, spatial ranges, and HSR locations. For instance, Andersson et al. (Citation2010) showed that the impact of HSR on housing prices in Taiwan was minor due to high ticket prices and entrenched residential location patterns. Similarly, Chen and Haynes (Citation2015a) indicated that HSR’s impact on housing values is significant in small and medium cities in China. The authors further suggested that spatial dependence should be considered; otherwise, the estimation may be biased and inefficient. Conversely, Geng, Bao, and Liang (Citation2015) revealed that due to negative effects from HSR such as noise and pollution, the system might negatively impact housing prices near a station. Moreover, Diao, Zhu, and Zhu (Citation2017) indicated that the location of HSR stations should be considered when measuring the impacts of HSR on housing values.
The hedonic price model is often used to assess the impact of HSR on housing values. The distance from a property to an HSR station is considered a critical accessibility attribute. The impacts of HSR on housing values are evaluated based on the identification of the statistical relationship between variations in housing prices and that of the distance to a station. Moreover, the functional forms of the hedonic price model can be set as either linear or nonlinear. The most common functional forms in hedonic price estimations include log-linear, semi-logarithmic, and Box–Cox-transformed forms (Andersson et al., Citation2010). Conversely, to capture the nonlinear relationship between housing prices and distance to HSR stations, the linear model can also be revised using a spline function of distance to HSR stations while holding other variables linear (Diao et al., Citation2017; Geng et al., Citation2015).
2.6 Labour market and industry
The impact evaluation of HSR on the labour market (e.g. employment change, labour mobility, firm location, and industry agglomeration/diffusion) has also received increasing attention. Some studies, such as Lin (Citation2017), found that the opening of HSR service is associated with an increased employment rate. Other studies also found that the development of HSR can promote labour migration and facilitate labour mobility due to the improvement of accessibility (Guirao, Campa, & Casado-Sanz, Citation2018; Guirao, Lara-Galera, & Campa, Citation2017). In addition, the opening of an HSR service was also found to have an association with the change of firm location, as the improved accessibility would make certain locations more attractive to businesses (Willigers & van Wee, Citation2011), although other studies argued that the effect of HSR on the location choice of firms is not deterministic (Beckerich, Benoit-Bazin, & Delaplace, Citation2017).
The impact of HSR on the economic performance of industries was also evaluated. For instance, Shao, Tian, and Yang (Citation2017) investigated the effects of HSR on the agglomeration of the service sector, in which they found that the effect was more significant in production service than consumer service and public service-related industries. Dai, Xu, and Wang (Citation2018) investigated three types of industries, which showed that HSR generated both an agglomeration and a diffusion effect on the secondary industry and tertiary industry, although the agglomeration effect is more significant in cities with HSR stations while the diffusion effect is more evident in cities without HSR stations.
The evaluation of HSR’s impacts on the labour market and industry is primarily conducted using econometric analysis. Labour mobility is generally measured in the number of non-resident persons (Guirao et al., Citation2017; Guirao et al., Citation2018). Industrial output is often measured in employment rate or employment density. The location quotient is often used to measure industrial agglomeration (Dai et al., Citation2018; Shao et al., Citation2017). In terms of HSR measurements, dummy variables that represent whether or not there is an HSR service in the study area are often adopted. In addition, other studies, such as Shao et al. (Citation2017), measured the effect of HSR using the number of trains as a proxy.
2.7 Economic performance impacts
Economic performance is a concept that includes economic growth, productivity growth, and consumer welfare (Dedrick, Gurbaxani, & Kraemer, Citation2003). Economic growth is generally measured in GDP, gross output and employment changes, whereas productivity is often defined as a ratio between the output volume and the input volume and it measures the efficiency to use resources. Consumer welfare addresses the benefits obtained by the consumption of goods and services. Most studies on the economic performance impacts of HSR mainly explore two issues: how the development of HSR promotes economic growth, and how its effect on economic growth varies among different regions. Several studies revealed that HSR investment has a positive effect on promoting economic growth given the improvement of intercity accessibility (Chen et al., Citation2016; Chen & Silva, Citation2015; Diao, Citation2018; Li, Strauss, Shunxiang, & Lui, Citation2018). However, other scholars, such as de Rus and Nombela (Citation2007) argued that the effect of HSR on economic growth depends on the transportation demand, and they further indicated that a positive economic effect from HSR is difficult to achieve when the number of passengers is below 8–10 million for a line with a distance of 500 km. Moreover, some studies revealed that the economic impacts of HSR vary depending on other factors, such as different lines (Ke, Chen, Hong, & Hsiao, Citation2017; Martín & Nombela, Citation2007), the distance of service (Meng, Lin, & Zhu, Citation2018), industries (Circella, Citation2015), and different stages of economic development (Cheng, Loo, & Vickerman, Citation2015). Nash (Citation2015) indicated that the economic success of HSR projects is influenced by several factors, such as construction costs, travel time saving, traffic demand, and the level of congestion of the existing transportation network.
Different research methods, such as cost–benefit analysis (CBA), econometric models, and simulation analysis, were often adopted for the economic impact assessment of HSR. For instance, de Rus and Inglada (Citation1997) and de Rus (Citation2011) found that the economic impacts of the Spanish HSR system could be positive with a higher transport demand using CBA. Similarly, CBA has also been applied to analyse HSR in Taiwan (Cheng, Citation2010) and many other systems (Button, Citation2012; Nash, Citation2015). Although CBA has been widely adopted for large infrastructure project evaluations, Hansjürgens (Citation2004) indicated that the method also has several limitations. For instance, benefits such as quality improvement and social welfare are hard to weigh up against the costs. The method also has a limitation of quantifying long-term economic benefits because future benefits need to be discounted to the current value using a discount factor which should be selected cautiously. Different discount factors might lead to various evaluation results. In addition, CBA tends to evaluate the direct benefits such as operation revenues, time savings, reduction of traffic congestion and accidents, and environmental impact (de Rus & Inglada, Citation1997), regardless of follow-on economic activities.
Instead, econometric analysis methods have been adopted as a complement to the CBA for the long-term economic impact assessment of HSR projects. The econometric analysis approach captures both direct benefits like time-saving and indirect/induced benefits generated by follow-on economic activities such as tourism and labour migration after new infrastructure investment. In econometric models, the economic output is often measured using macroeconomic indicators, such as GDP, GDP per capita, income, or employment. The economic impacts of HSR can be generally estimated using econometric models, through identifying the statistical relationship between the economic output variables and HSR variables.
Specifically, the difference-in-differences (DID) method is one of the most frequently adopted econometric approaches for HSR assessment (Ahlfeldt & Feddersen, Citation2018; Diao, Citation2018; Hernández & Jiménez, Citation2014; Li & Xu, Citation2018; Sun & Mansury, Citation2016). One critical step in DID analysis is to determine control groups and treatment groups. The rationale of the DID method is to compare the economic output between cities/regions that have HSR and those counterparts without it to identify whether the influence of HSR on economic outputs varies significantly among different groups. It has become a common practice that cities/regions with an HSR project or service and those without are considered the treatment group and control group, respectively. Given that large infrastructure projects, such as HSR, often have a strong spillover effect, the development of HSR may affect not only the city/region it is located in; it also influences neighbouring cities/regions even though they do not have an HSR station. As a result, it is possible that the control group may not be chosen appropriately.
Another limitation of DID is that the specification of the intervention for the treatment group can be problematic since the identification of the change of a “policy” (which, in this case, the development of HSR) in different periods is required. For instance, some studies, such as Diao (Citation2018), considered the year when HSR is in operation as the intervention in their DID model, whereas other works, such as Ahlfeldt and Feddersen (Citation2018) considered the year of HSR construction as the intervention instead. Unfortunately, it remains unclear to what extent the outcome of assessments may be different due to these various considerations.
Moreover, in the absence of treatment, it is generally assumed that the difference between the “treatment” and “control” groups is constant over time in a DID setting. However, the assumption may not be reasonable since many evaluations were conducted based on a dataset with a long-term period. As a result, the assumption is less likely to hold, which could lead to biased estimation.
To control for the influence of unobserved differences between the control group and treatment group, an advanced version of DID, known as the propensity score matching – difference-in-differences (PSM-DID) was also adapted (Jia, Zhou, & Qin, Citation2017; Meng et al., Citation2018). The method has an advantage over the basic DID in that the treatment effect is predicted based on a randomised estimation.Footnote1 Hence, it is reasonable to assume that the outcomes of the socioeconomic impact assessment of HSR can be dissimilar due to the different methods being adopted.
Overall, the literature review suggests that although extensive studies have investigated the socioeconomic impact of HSR, there is a lack of systematic review of the outcomes of these studies, although the results were found to vary substantially, and in some cases, with contradictory findings. It is also unclear whether such variations reflect the genuine outcomes of different HSR systems due to the different objectives and transport policy settings of HSR projects, or if they reflect an inconsistency among various statistical models. Moreover, the variations of estimated outcomes may be essentially influenced by the intrinsic characteristics of the assessment framework, such as data, method, and assumptions. Hence, it becomes imperative to examine to what extent the evaluation outcomes may be influenced by various factors so that sound implications can be developed for future evaluation and decision-making.
3. Data and methodology
3.1 Data
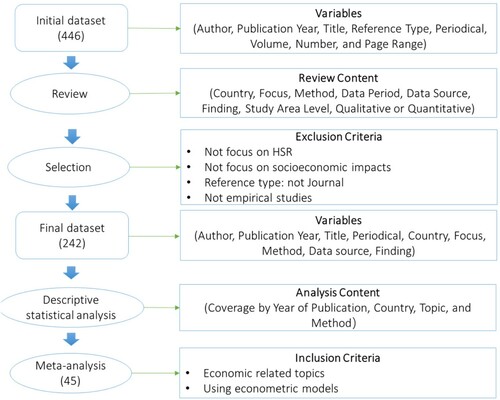
To understand how the socioeconomic impacts of HSR were evaluated in previous studies, we reviewed the HSR-related academic papers published until October 2020. The search was conducted through “Google Scholar” and “ScienceDirect,” using keywords such as “high speed rail”, “impact,” and the related terms. In addition, to avoid omitting important studies, we also conducted a manual search with a focus on relevant journalsFootnote2, such as Transportation Research Part A, B, C, D, E, and F, Transport Reviews, Journal of Transport Geography, Urban Studies, Cities, Environmental Planning A, B and C, Journal of Economic Geography, Journal of Regional Science, Journal of Benefit–Cost Analysis, and several railway specific journals. The process of review is illustrated in . The initial search returned 446 articles. Given that our focus is on the empirical studies of the socioeconomic impacts of HSR, the samples were refined. Eventually, 242 papers were found the most relevant.
Figure 2. Data selection process
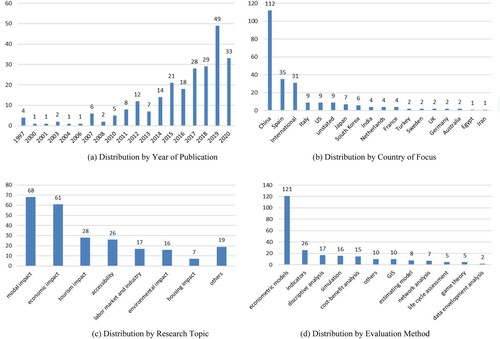
The publications were classified in terms of year of publication, country of focus, area of evaluation, and research method, respectively. As illustrated in (a), the number of publications related to socioeconomic impact evaluations of HSR has increased substantially since 1997. In terms of the country of focus, (b) shows that most evaluations focus on China and Spain, which is not surprising given that both countries have developed a large-scale HSR system in recent decades. We also note a high correlation between the HSR length and the number of publications in our review database divided by countries, which is approximate 0.95.Footnote3 In addition, extensive studies have also attempted to evaluate the impact of HSR from an international comparative perspective. The topics of evaluation are summarized in (c). The modal impact of HSR has received the most attention, which accounts for 28% of the total publications. The evaluations of economic, tourism, and accessibility impacts are also extensive, which account for 25%, 11.6%, and 10.7%, respectively. (d) summarizes the distribution of evaluations by research method. Almost 46% of the samples evaluated the impact of HSR using econometric models, including OLS regression model, difference-in-difference model, discrete choice model, Poisson regression model, spatial econometric models such as geographically weighted regression model, spatial lag model, spatial error model, and so on. In addition, other research methods, such as the indicator approach, cost–benefit method, and simulation method, have also been frequently adopted.
Figure 3. The Comparison of the Empirical Studies on Socioeconomic Impact Evaluations of HSR
3.2 Meta-Analysis
A meta-analysis was adopted to examine to what extent different empirical evaluation outcomes may be influenced by modelling characteristics. Meta-analysis is a statistical extrapolative technique, meaning it extracts information from previous studies to identify the influences of various data characteristics and analytical features on the output estimates (Fang, Citation2015; Graves, Citation2019; Park, Huang, & Newman, Citation2016). The basic structure of meta-analysis is formulated as equation 1:
(1)
(1) where
refers to the output estimate,
is the coefficient associated with the HSR variables, and
represents the coefficients associated with variable
, representing different modelling characteristics (also called factors) in the jth empirical model.
is the error term corresponding to the jth observation; n represents the total number of HSR variables; and m represents the total number of factors.
To achieve a reasonable comparison, we focus on empirical work that evaluates HSR’s economic impact using econometric models only. Moreover, we focus on those models where dependent variables were taken log transformation. In that case, the coefficients of HSR variables could be explained as the percent change of economic output brought by a 1% change of the HSR variable, which is comparable across papers. The estimates of HSR variables that represent HSR’s impact on economic outputs were collected from 45 papers (summarized in Appendix 3). In total, 368 estimates were obtained from various studies with a mean value of 0.149, a median value of 0.06, a minimum value of −3.487, and a maximum value of 6.155. Moreover, the standard deviations (SD) of these estimates, representing the variation of estimated HSR’s impact on economic outputs, were also analysed. These SD estimates were treated as an outcome variable and were regressed on various independent variables that capture model and data characteristics. It should be noted that some papers reported t-value, standard error, or p-value instead of SD. Hence, we used this information and converted the outcome variable into a consistent format, measured in SD. In total, 315 observations of SD were collected with a mean value of 2.88, ranging between 0 and 42.12. The distributions of output estimates and their SD were summarized in Appendix4.
As summarized in Appendix 5, the explanatory variables adopted in the meta-analysis are classified into the following five categories:
Dependent variable: various dummy variables were introduced to represent different dependent variables used to measure socioeconomic outputs, such as population, GDP, personal income, and employment. In addition, other dependent variables such as housing price, number of tourists, tourism revenue, night lighting were also introduced to examine whether the output estimates vary given the different types of dependent variables being adopted. It should be noted that for categorial variables, the reference category should be removed due to the consideration of avoiding collinearity. GDP is treated as the reference of the dependent variable group. The estimated values of the remaining categories represent the variation compared with other categories and the reference group.
HSR variable: the dummy variables in this category represent different types of indicators that were used to quantify the effect of HSR among various studies. HSR dummy was the most frequently used variable in previous studies to represent the effects of HSR. Hence, it was selected as the reference case of HSR variable group. The variable of “hsrafter” was introduced to represent the interaction term of “HSR×After,” which has often been adopted to capture the change before and after the implementation of HSR as well as the difference between cities/regions with and without it. In addition, the effects of HSR were also measured using other indicators, such as frequency, the number of services, and the level of accessibility.
Control variable: variables in this group capture various types of control variables that were adopted in the evaluation. For example, the variable of the year was often introduced to control for the time-fixed effect. The variables, such as province, county, and city (base case), were often introduced to control the regional-fixed effect. Other variables, such as dummy variables representing different industrial sectors, were widely used to control the sectorial effect. In addition, dummy variables that represent other transport modes, such as air and highway, were also introduced to control the corresponding effects.
Data characteristics: these variables were introduced to examine to what extent the output estimates of HSR impact evaluations vary given the consideration of date characteristics, such as data type, periods, source, and format. For instance, the dummy variable of “panel” was introduced to represent the fact that whether the output was estimated based on the panel dataset. To examine the variation of estimated outcome concerning the geographic unit of data analysis, three dummies representing county-level, city-level, and country-level, were introduced to control for the different scales of data adopted in different studies. The “city-level” was treated as the reference case, which hence was left out of the meta-analysis model. The basic assumption was that output estimates are likely to vary when the geographic unit of analysis is different. The variable “data length” was adopted to indicate how many years the panel data covers. The variable “time difference” was used to represent the time difference between the year of data collection and the year that HSR started to be in operation. In addition, to examine whether the impact of HSR differs among different countries, country-specific variables were also introduced.
Model specification: variables in this group examine if modelling structure influences the output estimates. In particular, the following modelling types were examined: difference-in-difference (DID), discrete choice, Poisson, and spatial econometrics, and the basic OLS model (which was treated as the reference case). Additionally, the variable “iv” was introduced to examine whether the output coefficient estimated from a model with an instrumental variable differs from other regression models. In addition, the function type of models, such as log-linear, log-dummy, and log–log (reference case), was introduced to compare whether the variation of estimates is also influenced by such modelling specifications.
The meta-analysis was conducted separately in six groups to assure robustness and consistency. Group 1–5 examine the influences of the corresponding five groups of explanatory variables on the output estimate, respectively, whereas Group 6 examines the influence of the aggregate factors of all the variables. Moreover, the output estimates representing HSR’s impact on economic output and its SD are adopted as dependent variables of the meta-analysis.
4. Results
The detailed results of the meta-analysis are summarized in Appendix 6. Model 1 shows the influence of dependent variables on the estimated output. The impact of HSR on the economy, in general, is more substantial if the output variable reflects socioeconomic performance at the individual level rather than at the macroeconomic level. For example, the impact of HSR was found relatively higher if the dependent variable is measured in personal income, employment, or population rather than GDP. Moreover, the impact of HSR was found to be relatively higher if the dependent variable is measured in Gross regional product (GRP), which suggests that the impact of HSR is found relatively higher at the regional level than at the national level. Such an outcome may reflect the fact that the distributional effect of HSR can be uneven within a country. As a result, the effects are attenuated if the analysis covers the entire country rather than some regions with HSR services. In addition, the estimation was found to be relatively higher if the dependent variable is measured in total factor productivity (TFP) rather than GDP. In other words, HSR assessment using TFP as the dependent variable is likely to find a relatively higher coefficient than that using GDP. The result suggests that the impact of HSR on production efficiency as a consequence of economic efficiency improvement was found more significant than that on GDP.
The analysis also shows that the variable representing the brightness of night light is statistically significant (at a 5% level), which indicates that the output estimated value of HSR’s impacts is 21.7% higher if it is measured by night lighting instead of other measures, such as GDP. Conversely, the impact of HSR was found to be relatively lower if the dependent variable is measured in proportions of secondary industries rather than other types of dependent variables. It implies that the impact of HSR on secondary industries is lower than on other output measures, such as GDP.
Model 2 displays the influence of HSR variables on the output estimate of impact evaluations. It shows that the estimated output was found to be relatively higher if the effect of HSR was measured by accessibility indicators like WATT rather than other variables, such as the HSR dummy generated based on the year of service availability. Such a result suggests that the impact of HSR is likely to be greater if the key variable is able to capture the quality change (e.g. accessibility, frequency, cost) brought by HSR, rather than a spatial and temporal change (e.g. which is often captured through an HSR dummy variable) of the system. The analysis also shows that the estimated output was likely to be relatively higher if the effect of HSR was measured by the average share of HSR trips out of all trips. Such a result suggests that the impact of HSR is likely to be greater when compared with other travel modes. In addition, the estimated output coefficient value is likely to be lower when both the regional and temporal effects of HSR are measured simultaneously by “HSR×After” rather than other forms of HSR variable, although it is not statistically significant in our model.
Model 3 summarizes the influences of control variables on the output estimate in HSR’s impact assessment studies. One of the key findings is that some of the control variables such as year, regional fixed effect, sociodemographic characteristics, geographic location, and other transport modes have statistically significant influences on the estimated outcomes of impact evaluations. For instance, the output estimate of HSR’s impact was found to be relatively higher if the assessment was conducted at the province level, if sociodemographic variables such as age and wage were controlled for, or if geographic location like distance to core city was controlled. Conversely, the control of the temporal effect using a year dummy variable is likely to be associated with a 26.8% lower value of the outcome, ceteris paribus. This could be explained by the fact that the evaluation outcome tends to be more accurate if the temporal effect of the socioeconomic output growth is controlled. Moreover, the output estimate of HSR’s impact is likely to be lower if highway features such as the length, numbers, or density of highways are controlled for in the modelling framework, ceteris paribus, because in such a way, the independent effects of HSR could be separated from that of other competitive transport modes like the highway.
Model 4 reveals the statistical association between data characteristic variables and the output estimate of HSR’s impact. The key findings are summarized in the following aspects. First, the output estimate tends to be dissimilar given the different geographic units of data analysis. In general, a relatively larger impact outcome is likely to be observed if the geographic unit of assessment is at a province-level rather than at a city-level. In other words, A study that adopted province as the unit of analysis is likely to observe a relatively larger impact than that based on a unit of analysis at the city-level. Such a result suggests that the assessment with a larger geographic unit is likely to capture spillover effects of HSR, which could hardly be measured at the city-level of analysis that may only consider the neighbouring areas within the urban scale. This may also reflect the fact that the agglomeration effect of HSR, which refers to the phenomenon that HSR promotes the concentration of economic activity at a larger geographic scale, is more likely to be captured at a more aggregate level of assessment. The reason for such an outcome, as explained by Giuliano, Kang, and Yuan (Citation2019), could be that large areas have the benefits of scale, labour diversity, extensive transport and communication network. In addition, a relatively large scale of area is likely to capture the agglomeration activities among multiple centres, which lower costs of land, wage, and congestion while still preserve agglomeration benefits.
The output estimates also show spatial heterogeneity, which means that the estimation outcome is likely to change among different types of areas. In particular, the impact of HSR was found to be higher in urban areas when compared with rural areas. Third, a relatively higher impact output is likely to be observed if the time difference between data collection and the start of the operation of HSR is higher, which implies that the impact of HSR is enlarged with the continuous operation of HSR. It also confirms the time frame of the analysis (i.e. whether HSR has been there for a long time or is relatively new) is an important factor that influences the impact of HSR.
Model 5 shows the influence of model specification on the output estimate. The results show that compared to the result using basic models, such as OLS, the estimated outcome is likely to be higher if the following types of models are adopted in the assessment: DID, discrete choice, and models with fixed effects. Conversely, the estimated outcome is found to be generally lower than average if the assessment adopted either the propensity score matching - difference in differences (PSM-DID) model or spatial econometrics method. The results, in general, suggest that a relatively lower estimate is likely to be achieved if the issue of spatial heteroscedasticity is addressed in the assessment. The analysis also reveals that a higher output estimate is likely to be observed when the output variable and HSR variable are estimated in a log-linear format than the log–log format. This may reflect the different meanings of output coefficients being estimated from different modelling structures.Footnote4
Model 6 shows the influences on the output estimates of the socioeconomic impacts of HSR, with control of all the key variables from the five categories of factors. Some variables were omitted due to multicollinearity. Only those variables that are statistically significant are displayed. Although the values of the estimated coefficients of each factor vary slightly, the results are generally consistent with those estimated in separate models in terms of sign and significance. This confirms that the results of the meta-analysis are robust. Overall, the R-squared value of Model 6 is 0.571, suggesting that 57.1% of the influences on the variation of the output estimate in HSR’s impact assessment are explained.
Moreover, the meta-analysis results using standard deviation (SD) as the output estimates are summarized in Appendix 7. The SD models show how the selection of variables and the model specification affect the variability of the output estimates of HSR’s impact. It helps us to understand how the economic effects of HSR fluctuate under different model settings. Overall, the analysis reveals the following major findings:
Firstly, Model 7 shows that the variability of estimated effects was found higher if the output variable is a human-related metric, such as employment and population, rather than an economic metric (such as GDP). Such a pattern suggests that the effects of HSR might be found more varied if the human-related metrics were adopted. Secondly, Model 8 displays that the variance of estimation is likely to be higher if the effect of HSR is measured by HSR*After (often used in DID models) and distance variables than the HSR dummy variable. This could be because the DID parameter and distance variable may better reflect the quality change of intercity travel by HSR than the simple dummy variable approach, which may provide a wide range of impact outcomes given the variability of the corresponding characteristics. Thirdly, Model 9 suggests that the introduction of key control variables, such as alternative transport mode, population density, neighbourhood factors, and other geographic and temporal factors, may also reduce the variability of estimated outcomes. In other words, a modelling framework with considerations of all the key control variables is likely to generate a more robust estimate result.
In addition, Model 10 reveals that the variations of the estimated HSR effects are also relatively lower in European cases (such as Spain, Italy, Germany, and France) than that of the cases in Asian countries (such as China, Japan, Korea), which suggests that there is also a systematic difference in the socioeconomic impact assessment outcomes of various HSR systems globally. The impact of European systems, in general, was found to have less variation than that in Asia, which may also reflect the levels of maturity of the system.
In sum, the comparison of the estimates based on mean estimates and SD reveals that the models with higher estimated HSR effects tend to be associated with higher variability of the estimates. We also observed that previous empirical assessments of HSR tend to primarily report the results of output mean-estimates, whereas SD was less often reported directly, although some studies may report either T-statistics, standard error, or p-value instead.
5. Conclusion
Despite a rising number of empirical studies attempting to understand the socioeconomic impact of different HSR systems, the evaluation outcomes remain unsatisfactory as the research outcomes are quite heterogeneous. While such a difference may reflect the various impacts of different systems and varying specific areas, it is likely that other factors related to the modelling designs may also cause a major difference. As a result, there is a lack of systematic understanding of how the issues were investigated in the field and how reliable and robust the empirical results are, given the adoptions of different modelling frameworks with varying considerations.
This paper tends to fill this gap by conducting a comprehensive overview of empirical studies focusing on socioeconomic impact assessments of HSR. Our analysis reveals that previous studies mainly attempted to evaluate the impact of the system from the aspects, such as accessibility change, modal impact, environmental impact, tourism impact, housing or land impact, labour market impact, and economic performance impact. In particular, most assessments were evaluated from the aspects of accessibility, economic impact, and modal impact. In terms of the regional focus, most of the empirical assessments evaluated the HSR systems in China and Spain, which is not surprising given that both countries have developed a large-scale HSR system. Hence, there are more pressing desires to understand the impact from an ex-post perspective in these countries than others.
In terms of research methods, econometric analysis was found to be the most frequently adopted method. However, as revealed in , the outcomes of impact estimates were found to be heterogeneous and are influenced by various factors, including the specifications of the variables, data characteristics, and models. To summarize, the meta-analysis provides the following major research findings.
Table 1. Estimated Sign of Various Variables
First, the study confirms that both the estimated result of HSR’s socioeconomic impact and the corresponding SD tend to be higher if the dependent variable is measured using variables, such as population, employment than the base case, which adopted GDP as the dependent variable. In addition, the impact was also found to be relatively higher when the output is measured in personal income GRP and TFP.
Second, our analysis revealed that a larger impact of HSR is likely to be found if the effect of HSR was measured using quality indicators representing HSR service (e.g. accessibility change) rather than a simple dummy variable, which has been excessively used to capture the time difference before and after the implementation of the HSR system. Similarly, the variation of the outcome may also be relatively higher, as reflected in the SD result, suggesting that these variables may provide a wider range of distributions of impact outcomes.
Third, the study confirms that the impact outcome is likely to vary substantially if key control variables, such as the temporal trend (year dummy), regions of the focused area, geographic location, and competing transport modes are not controlled. These results suggest a more careful approach to empirical modelling development is the key to guarantee the robustness of the estimation outcomes.
Fourth, the estimated result of HSR’s socioeconomic impact was found relatively higher if the evaluation is based on a panel dataset. Conversely, the impact estimates are often lower if the geographic unit of data analysis is smaller (e.g. at the city level instead of a provincial level). In addition, the impact estimates were found higher if the HSR being evaluated has a relatively long period. These findings suggest that different evaluation outcomes may reflect various degrees of agglomeration/spillover effects and temporal effects of the HSR captured in the assessment. Hence, future analysis should be selective in terms of identifying the appropriate geographic unit for the impact assessment.
Lastly, the model specification was also found to have a significant influence on the output estimate. In particular, a relatively higher impact is likely to be generated when research methods, such as DID and discrete choice modelling, were adopted. Conversely, a relatively lower output estimate is likely to be found in spatial econometrics models when the issue of spatial dependence is controlled.
These findings also explain why the evaluation outcomes are different in some studies. For example, Chen and Haynes (Citation2017) used GDP to measure the economic performance at the national level, while Sun and Mansury (Citation2016) used household income instead and conducted the analysis at the regional level. Our study reveals that the impact of HSR was relatively higher if the economic outcome is measured in personal income rather than GDP. Moreover, the effects of HSR were found to be somewhat higher at the regional level than at the national level. Therefore, the different findings of Sun and Mansury (Citation2016) and Chen and Haynes (Citation2017) may reflect the different modelling characteristics, such as the selected variables and the geographic scope of analysis.
In sum, the research findings provide detailed guidance and implications for scholars and practitioners to improve their impact evaluation framework for HSR in future assessment endeavours. The evaluation of the socioeconomic impacts of HSR should be conducted more cautiously, with a thorough consideration of data, scale, and modelling specification. Hopefully, these aforementioned key findings may provide some guidance for researchers to develop appropriate empirical models for future assessment. Specifically, the following recommendations can be drawn from this paper. First, although the mean estimation is essential to reflect the level of HSR’s socioeconomic impacts, other metrics, such as standard deviation and confidence interval, can also be valuable as they provide additional information to understand the robustness of the estimates and the distribution of the impact outcomes. Hence, we suggest that scholars consider providing information on the estimation outcomes, such as standard deviations or confidence intervals, in their future impact assessment of HSR. In addition, robust tests of models should be added to help readers understand the extent of the robustness of the analytical results.
Second, given that the impact assessment results were found sensitive to the specifications of geographic and temporal scales, future work on socioeconomic impact assessment of HSR should consider choosing an appropriate scale of analysis if necessary. In particular, a larger geographic unit of data (e.g. at the province level) should be considered if the objective of assessment involves capturing the spatial spillover effects and agglomeration effects that the system generates. In addition, it is important to obtain a longer period of data so that the temporal impacts could be captured more accurately.
Third, we suggest that future impact assessment of HSR should adopt relevant indicators or variables that reflect a quality improvement of the services per se, such as accessibility, travel time, and frequency. Such an assessment could tell more meaningful insights than those analyses based on a simple dummy approach.
Fourth, in terms of evaluation methods, given that spatial heteroscedasticity can be a common issue in mega infrastructure impact assessment due to the scale of these projects involved, we suggest that advanced statistical methods, such as PSM-DID and spatial econometrics models shall be considered as a norm for the assessment, as long as the relevant data is available.
In addition, we also suggest that future research of the socioeconomic impact assessment of HSR could be further expanded in terms of enhancing the linkage between the theoretical foundation and empirical modelling framework, the focus on the social impact generated by the HSR system, such as social equity and travel behaviour changes, and the substitution between HSR and other transportation modes, such as conventional rail and buses, so that the impact of HSR on the change in demand and environment could be further understood.
One should note that our evaluation also has a few limitations, which deserve further research. For instance, the research findings were mainly derived from the selected publications. Hence, the issue of variable selection bias may be unavoidable. As the literature keeps expanding, a continuous effort is needed to expand the database and analysis further. In addition, the analysis can be further expanded by using bibliometric and scientometric analysis and knowledge graph analysis so that the knowledge structure of the field could be further understood.
Acknowledgement
An earlier version of the paper was presented at the 15th biennial NECTAR conference “Towards Human Scale Cities - Open and Happy”, hosted at the University of Helsinki during 5–7 June 2019. The authors want to thank the valuable comments received from both the conference participants and the two anonymous reviewers. Views presented in this study do not represent any organisations, and authors are responsible for any errors or mistakes.
Disclosure statement
No potential conflict of interest was reported by the author(s).
Additional information
Funding
Notes
1 This is due to the fact that the bias caused by confounding variables can be reduced in PSM. The confounding variables could be found in an estimate of the treatment effect obtained from a simple comparison of the outcomes among units that received the treatment and those that did not.
2 The full list of key journals surveyed for the review is summarized in Appendix 1.
3 The length of HSR lines by countries is summarized in Appendix 2.
4 The value estimated from a log-log structure is essentially interpreted as elasticity, whereas the structure of the log-linear models is interpreted as the percent change of the output as the unit change of the independent variable.
References
- Ahlfeldt, G. M., & Feddersen, A. (2018). From periphery to core: Measuring agglomeration effects using high-speed rail. Journal of Economic Geography, 18(2), 355–390. https://doi.org/https://doi.org/10.1093/jeg/lbx005
- Åkerman, J. (2011). The role of high-speed rail in mitigating climate change–The Swedish case europabanan from a life cycle perspective. Transportation Research Part D: Transport and Environment, 16(3), 208–217. https://www.sciencedirect.com/science/article/pii/S1361920910001689
- Albalate, D., Campos, J., & Jiménez, J. L. (2017). Tourism and high speed rail in Spain: Does the AVE increase local visitors? Annals of Tourism Research, 65, 71–82.
- Albalate, D., & Fageda, X. (2016). High speed rail and tourism: Empirical evidence from Spain. Transportation Research Part a: Policy and Practice, 85, 174–185. https://www.sciencedirect.com/science/article/pii/S0965856416000094
- Andersson, D. E., Shyr, O. F., & Fu, J. (2010). Does high-speed rail accessibility influence residential property prices? Hedonic estimates from southern Taiwan. Journal of Transport Geography, 18(1), 166–174. https://www.sciencedirect.com/science/article/pii/S0966692308001257
- Beckerich, C., Benoit-Bazin, S., & Delaplace, M. (2017). Does high speed rail affect the Behaviour of firms located in districts around central stations? The results of Two Surveys conducted in reims in 2008 and 2014. Transportation Research Procedia, 25, 3017–3034. https://doi.org/https://doi.org/10.1016/j.trpro.2017.05.287
- Behrens, C., & Pels, E. (2012). Intermodal competition in the London–Paris passenger market: High-speed rail and air transport. Journal of Urban Economics, 71(3), 278–288. https://doi.org/https://doi.org/10.1016/j.jue.2011.12.005
- Bešinović, N. (2020). Resilience in railway transport systems: A literature review and research agenda. Transport Reviews, 40(4), 457–478. https://doi.org/https://doi.org/10.1080/01441647.2020.1728419
- Bueno, G., Hoyos, D., & Capellán-Pérez, I. (2017). Evaluating the environmental performance of the high speed rail project in the basque country. Spain. Research in Transportation Economics, 62, 44–56. https://doi.org/https://doi.org/10.1016/j.retrec.2017.02.004
- Button, K. (2012). Is there any economic justification for high-speed railways in the United States? Journal of Transport Geography, 22, 300–302.
- Campa, J. L., López-Lambas, M. E., & Guirao, B. (2016). High speed rail effects on tourism: Spanish empirical evidence derived from China's modelling experience. Journal of Transport Geography, 57, 44–54. https://www.sciencedirect.com/science/article/pii/S096669231630237X
- Campa, J. L., Pagliara, F., López-Lambas, M. E., Arce, R., & Guirao, B. (2019). Impact of high-speed rail on cultural tourism development: The experience of the Spanish museums and monuments. Sustainability, 11(20), 5845. https://doi.org/https://doi.org/10.3390/su11205845
- Cao, J., Liu, X. C., Wang, Y., & Li, Q. (2013). Accessibility impacts of China’s high-speed rail network. Journal of Transport Geography, 28, 12–21. https://www.sciencedirect.com/science/article/pii/S096669231200261X
- Carbo, J. M., Graham, D. J., Anupriya, C., & Melo, D., & C, P. (2019). Evaluating the causal economic impacts of transport investments: Evidence from the Madrid–Barcelona high speed rail corridor. Journal of Applied Statistics, 46(9), 1714–1723. https://doi.org/https://doi.org/10.1080/02664763.2018.1558188
- Cartenì, A., Pariota, L., & Henke, I. (2017). Hedonic value of high-speed rail services: Quantitative analysis of the students’ domestic tourist attractiveness of the main Italian cities. Transportation Research Part a: Policy and Practice, 100, 348–365. https://www.sciencedirect.com/science/article/pii/S0965856416305365
- Castillo-Manzano, J. I., Castro-Nuño, M., López-Valpuesta, L., Pedregal-Tercero, D. J., & Garrido-Michó, J. M. (2018). High speed rail: Fast tracking tourism in the EU? Annals of Tourism Research, 71, 64–66. https://doi.org/https://doi.org/10.1016/j.annals.2018.02.005
- Castillo-Manzano, J. I., Pozo-Barajas, R., & Trapero, J. R. (2015). Measuring the substitution effects between high speed rail and air transport in Spain. Journal of Transport Geography, 43, 59–65. https://www.sciencedirect.com/science/article/pii/S0966692315000101
- Chai, J., Zhou, Y., Zhou, X., Wang, S., Zhang, Z. G., & Liu, Z. (2018). Analysis on shock effect of China’s high-speed railway on aviation transport. Transportation Research Part a: Policy and Practice, 108, 35–44. https://doi.org/https://doi.org/10.1016/j.tra.2017.12.001
- Chang, B., & Kendall, A. (2011). Life cycle greenhouse gas assessment of infrastructure construction for california’s high-speed rail system. Transportation Research Part D: Transport and Environment, 16(6), 429–434. https://www.sciencedirect.com/science/article/pii/S1361920911000484
- Chen, C.-L., & Wei, B. (2013). High-Speed rail and urban transformation in China:The case of Hangzhou East rail station. Built Environment, 39(3), 385–398. https://doi.org/https://doi.org/10.2148/benv.39.3.385
- Chen, G., & Silva, J. d. A. e. (2015). Using dynamic simultaneous-equation model to estimate the regional impacts of high-speed rail in Spain. Transportation Research Procedia, 10, 296–305. https://doi.org/https://doi.org/10.1016/j.trpro.2015.09.079
- Chen, Y. (2019). High-speed railway and regional economic growth: A case of Beijing-Shanghai high-speed railway. HOLISTICA – Journal of Business and Public Administration, 10(2), 95–104. https://doi.org/https://doi.org/10.2478/hjbpa-2019-0018
- Chen, Z. (2017). Impacts of high-speed rail on domestic air transportation in China. Journal of Transport Geography, 62, 184–196. https://www.sciencedirect.com/science/article/pii/S096669231730008X
- Chen, Z., & Haynes, K. E. (2015a). Impact of high speed rail on housing values: An observation from the Beijing–Shanghai line. Journal of Transport Geography, 43, 91–100. https://www.sciencedirect.com/science/article/pii/S0966692315000149
- Chen, Z., & Haynes, K. E. (2015b). Impact of high-speed rail on international tourism demand in China. Applied Economics Letters, 22(1), 57–60.
- Chen, Z., & Haynes, K. E. (2017). Impact of high-speed rail on regional economic disparity in China. Journal of Transport Geography, 65, 80–91. https://www.sciencedirect.com/science/article/pii/S0966692316304963
- Chen, Z., Haynes, K. E., Zhou, Y., & Dai, Z. (2019). High speed rail and China's new economic geography: Impact assessment from the regional science perspective. New horizons in regional science. Cheltenham, UK: Edward Elgar Publishing.
- Chen, Z., & Wang, Y. (2019). Impacts of severe weather events on high-speed rail and aviation delays. Transportation Research Part D: Transport and Environment, 69, 168–183.
- Chen, Z., Xue, J., Rose, A. Z., & Haynes, K. E. (2016). The impact of high-speed rail investment on economic and environmental change in China: A dynamic CGE analysis. Transportation Research Part a: Policy and Practice, 92, 232–245. https://www.sciencedirect.com/science/article/pii/S0965856416306681
- Cheng, Y.-H. (2010). High-speed rail in Taiwan: New experience and issues for future development. Transport Policy, 17(2), 51–63. https://doi.org/https://doi.org/10.1016/j.tranpol.2009.10.009
- Cheng, Y.-s., Loo, B. P. Y., & Vickerman, R. (2015). High-speed rail networks, economic integration and regional specialisation in China and Europe. Travel Behaviour and Society, 2(1), 1–14. https://doi.org/https://doi.org/10.1016/j.tbs.2014.07.002
- Chong, Z., Chen, Z., & Qin, C. (2019). Estimating the economic benefits of high-speed rail in China. The Journal of Transport and Land Use, 12(1), 287–302. https://www.jstor.org/stable/26911269
- Circella, G. (2015). Book review: The Economics and politics of high-speed rail: Lessons from experiences abroad. Journal of Planning Literature, 30(3), 296–297. https://doi.org/https://doi.org/10.1177/0885412215593256
- Dai, X., Xu, M., & Wang, N. (2018). The industrial impact of the Beijing-Shanghai high-speed rail. Travel Behaviour and Society, 12, 23–29. https://doi.org/https://doi.org/10.1016/j.tbs.2018.03.002
- Dalkic, G., Balaban, O., Tuydes-Yaman, H., & Celikkol-Kocak, T. (2017). An assessment of the CO 2 emissions reduction in high speed rail lines: Two case studies from Turkey. Journal of Cleaner Production, 165, 746–761. https://doi.org/https://doi.org/10.1016/j.jclepro.2017.07.045
- Danapour, M., Nickkar, A., Jeihani, M., & Khaksar, H. (2018). Competition between high-speed rail and air transport in Iran: The case of Tehran–isfahan. Case Studies on Transport Policy. https://doi.org/https://doi.org/10.1016/j.cstp.2018.05.006
- Dedrick, J., Gurbaxani, V., & Kraemer, K. L. (2003). Information technology and economic performance. ACM Computing Surveys, 35(1), 1–28. https://doi.org/https://doi.org/10.1145/641865.641866
- Delaplace, M., Pagliara, F., Perrin, J., & Mermet, S. (2014). Can high speed rail foster the choice of destination for tourism purpose? Procedia - Social and Behavioral Sciences, 111, 166–175. https://doi.org/https://doi.org/10.1016/j.sbspro.2014.01.049
- Deng, T., Gan, C., Perl, A., & Wang, D. (2020). What caused differential impacts on high-speed railway station area development? Evidence from global nighttime light data. Cities, 97, 102568. https://doi.org/https://doi.org/10.1016/j.cities.2019.102568
- de Rus, G. (2011). The BCA of HSR: Should the government invest in high speed rail infrastructure? Journal of Benefit-Cost Analysis, 2(01), 1–28. https://doi.org/https://doi.org/10.2202/2152-2812.1058
- de Rus, G., & Inglada, V. (1997). Cost-benefit analysis of the high-speed train in Spain. The Annals of Regional Science, 31(2), 175–188. https://doi.org/https://doi.org/10.1007/s001680050044
- de Rus, G., & Nombela, G. (2007). Is investment in high speed rail socially profitable? Journal of Transport Economics and Policy (JTEP), 41(1), 3–23. http://www.ingentaconnect.com/content/lse/jtep/2007/00000041/00000001/art00002
- Diao, M. (2018). Does growth follow the rail? The potential impact of high-speed rail on the economic geography of China. Transportation Research Part a: Policy and Practice, 113, 279–290. https://doi.org/https://doi.org/10.1016/j.tra.2018.04.024
- Diao, M., Zhu, Y., & Zhu, J. (2017). Intra-city access to inter-city transport nodes: The implications of high-speed-rail station locations for the urban development of Chinese cities. Urban Studies, 54(10), 2249–2267.
- Fang, L. (2015). Do clusters encourage innovation? A meta-analysis. Journal of Planning Literature, 30(3), 239–260. https://doi.org/https://doi.org/10.1177/0885412215589848
- Gao, Y., Song, S., Sun, J., & Zang, L. (2020). Does high-speed rail connection really promote local economy? Evidence from China’s Yangtze River delta. Review of Development Economics, 24(1), 316–338. https://doi.org/https://doi.org/10.1111/rode.12642
- Gao, Y., Su, W., & Wang, K. (2019). Does high-speed rail boost tourism growth? New Evidence from China. SSRN Electronic Journal, 72, 220–231. https://doi.org/https://doi.org/10.2139/ssrn.3289421
- Geng, B., Bao, H., & Liang, Y. (2015). A study of the effect of a high-speed rail station on spatial variations in housing price based on the hedonic model. Habitat International, 49, 333–339. https://doi.org/https://doi.org/10.1016/j.habitatint.2015.06.005
- Giuliano, G., Kang, S., & Yuan, Q. (2019). Agglomeration economies and evolving urban form. The Annals of Regional Science, 63(3), 377–398. https://doi.org/https://doi.org/10.1007/s00168-019-00957-4
- Graves, E. (2019). Moving to improve? A qualitative meta-analysis of neighborhood violence and residential decision-making among housing voucher holders. Journal of Planning Literature, 34(1), 19–37. https://doi.org/https://doi.org/10.1177/0885412218795267
- Guirao, B., Campa, J. L., & Casado-Sanz, N. (2018). C: The role of high speed rail commuting in Spain. Cities, 78, 140–154. https://www.sciencedirect.com/science/article/pii/S0264275117312520
- Guirao, B., Lara-Galera, A., & Campa, J. L. (2017). High speed rail commuting impacts on labour migration: The case of the concentration of metropolis in the Madrid functional area. Land Use Policy, 66, 131–140. https://doi.org/https://doi.org/10.1016/j.landusepol.2017.04.035
- Gutiérrez, J. (2001). Location, economic potential and daily accessibility: An analysis of the accessibility impact of the high-speed line Madrid–barcelona–French border. Journal of Transport Geography, 9(4), 229–242. https://doi.org/https://doi.org/10.1016/S0966-6923(01)00017-5
- Hansjürgens, B. (2004). Economic valuation through cost-benefit analysis–possibilities and limitations. Toxicology, 205(3), 241–252. https://doi.org/https://doi.org/10.1016/j.tox.2004.06.054
- Hernández, A., & Jiménez, J. L. (2014). Does high-speed rail generate spillovers on local budgets? Transport Policy, 35, 211–219. https://doi.org/https://doi.org/10.1016/j.tranpol.2014.06.003
- Heuermann, D. F., & Schmieder, J. F. (2019). The effect of infrastructure on worker mobility: Evidence from high-speed rail expansion in Germany. Journal of Economic Geography, 19(2), 335–372. https://doi.org/https://doi.org/10.1093/jeg/lby019
- Huang, T., Xi, J.-C., & Ge, Q.-S. (2017). Spatial differentiation and integration optimization of an Urban Agglomeration tourism system under the influence of high-speed railway network evolution. Applied Spatial Analysis and Policy, 12(2), 349–376. https://doi.org/https://doi.org/10.1007/s12061-017-9245-3.
- Jia, S., Zhou, C., & Qin, C. (2017). No difference in effect of high-speed rail on regional economic growth based on match effect perspective? Transportation Research Part a: Policy and Practice, 106, 144–157. https://www.sciencedirect.com/science/article/pii/S0965856416311545
- Jiang, C., & Zhang, A. (2016). Airline network choice and market coverage under high-speed rail competition. Transportation Research Part a: Policy and Practice, 92, 248–260. https://www.sciencedirect.com/science/article/pii/S0965856416305249
- Jiang, M., & Kim, E. (2016). Impact of high-speed railroad on regional income inequalities in China and korea. International Journal of Urban Sciences, 20(3), 393–406. https://doi.org/https://doi.org/10.1080/12265934.2016.1213139
- Jiménez, J. L., & Betancor, O. (2012). When trains go faster than planes: The strategic reaction of airlines in Spain. Transport Policy, 23, 34–41. https://doi.org/https://doi.org/10.1016/j.tranpol.2012.06.003
- Jin, C., Xu, J., Lu, Y., & Huang, Z. (2013). The impact of Chinese shanghai–Nanjing high-speed rail on regional accessibility. Geografisk Tidsskrift-Danish Journal of Geography, 113(2), 133–145. https://doi.org/https://doi.org/10.1080/00167223.2013.836787
- Jin, M., Lin, K.-C., Shi, W., Lee, P. T. W., & Li, K. X. (2020). Impacts of high-speed railways on economic growth and disparity in China. Transportation Research Part a: Policy and Practice, 138, 158–171. https://doi.org/https://doi.org/10.1016/j.tra.2020.05.013
- Ke, X., Chen, H., Hong, Y., & Hsiao, C. (2017). Do China's high-speed-rail projects promote local economy?—New evidence from a panel data approach. China Economic Review, 44, 203–226. https://doi.org/https://doi.org/10.1016/j.chieco.2017.02.008
- Li, F., Su, Y., Xie, J., Zhu, W., & Wang, Y. (2020). The impact of high-speed rail opening on city Economics along the silk road economic belt. Sustainability, 12(8), 3176. https://doi.org/https://doi.org/10.3390/su12083176
- Li, H., Strauss, J., Shunxiang, H., & Lui, L. (2018). Do high-speed railways lead to urban economic growth in China? A panel data study of China’s cities. The Quarterly Review of Economics and Finance, 69, 70–89. https://doi.org/https://doi.org/10.1016/j.qref.2018.04.002
- Li, L. S. Z., Yang, F. X., & Cui, C. (2019). High-speed rail and tourism in China: An urban agglomeration perspective. International Journal of Tourism Research, 21(1), 45–60. https://doi.org/https://doi.org/10.1002/jtr.2240
- Li, Y., Chen, Z., & Wang, P. (2020). Impact of high-speed rail development on urban economic efficiency in China. Transport Policy. Advance online publication. https://doi.org/https://doi.org/10.1016/j.tranpol.2020.08.001
- Li, Z., & Xu, H. (2018). High-speed railroads and economic geography: Evidence from Japan. Journal of Regional Science, 105, 493. https://doi.org/https://doi.org/10.1111/jors.12384
- Li, Z.-C., & Sheng, D. (2016). Forecasting passenger travel demand for air and high-speed rail integration service: A case study of Beijing-guangzhou corridor, China. Transportation Research Part a: Policy and Practice, 94, 397–410. https://doi.org/https://doi.org/10.1016/j.tra.2016.10.002
- Lin, Y. (2017). Travel costs and urban specialization patterns: Evidence from China’s high speed railway system. Journal of Urban Economics, 98, 98–123. https://doi.org/https://doi.org/10.1016/j.jue.2016.11.002
- Martín, J. C., & Nombela, G. (2007). Microeconomic impacts of investments in high speed trains in Spain. The Annals of Regional Science, 41(3), 715–733. https://doi.org/https://doi.org/10.1007/s00168-007-0116-8
- Martín, J. C., & Reggiani, A. (2007). Recent methodological developments to measure spatial interaction: Synthetic accessibility indices applied to high-speed train investments. Transport Reviews, 27(5), 551–571.
- Meng, X., Lin, S., & Zhu, X. (2018). The resource redistribution effect of high-speed rail stations on the economic growth of neighbouring regions: Evidence from China. Transport Policy, 68, 178–191. https://doi.org/https://doi.org/10.1016/j.tranpol.2018.05.006
- Moyano, A., Martínez, H. S., & Coronado, J. M. (2018). From network to services: A comparative accessibility analysis of the Spanish high-speed rail system. Transport Policy, 63, 51–60. https://doi.org/https://doi.org/10.1016/j.tranpol.2017.11.007
- Nash, C. (2015). When to invest in high speed rail. Journal of Rail Transport Planning & Management, 5(1), 12–22. https://doi.org/https://doi.org/10.1016/j.jrtpm.2015.02.001
- Okamoto, C., & Sato, Y. (2019). Impacts of High-Speed Rail Construction on Urban Agglomerations: Evidence from Kyushu in Japan. Available at SSRN 3466056.
- Pagliara, F. (2019). High speed rail, megalopolis and house prices: What is the link? RELAND: International Journal of Real Estate & Land Planning, 2(0), 125–136.
- Pagliara, F., La Pietra, A., Gomez, J., & Manuel Vassallo, J. (2015). High speed rail and the tourism market: Evidence from the Madrid case study. Transport Policy, 37, 187–194. https://doi.org/https://doi.org/10.1016/j.tranpol.2014.10.015
- Pagliara, F., & Mauriello, F. (2019). High speed rail vs. Other factors affecting the tourism market in Italy. International Journal of Humanities and Social Sciences, 13(5), 587–591. https://doi.org/https://doi.org/10.5281/ZENODO.3298641
- Pagliara, F., Mauriello, F., & Di Martino, S. (2019). An analysis of the link between high speed transport and tourists’ behaviour. Tourism: An International Interdisciplinary Journal, 67(2), 116–125.
- Pagliara, F., Mauriello, F., & Garofalo, A. (2017). Exploring the interdependences between high speed rail systems and tourism: Some evidence from Italy. Transportation Research Part a: Policy and Practice, 106, 300–308. https://www.sciencedirect.com/science/article/pii/S0965856417303300
- Park, Y., Huang, S.-K., & Newman, G. D. (2016). A statistical meta-analysis of the design components of New urbanism on housing prices. Journal of Planning Literature, 31(4), 435–451. https://doi.org/https://doi.org/10.1177/0885412216667898
- Roberts, M., Melecky, M., Bougna, T., & Xu, Y. (2020). Transport corridors and their wider economic benefits: A quantitative review of the literature. Journal of Regional Science, 60(2), 207–248. https://doi.org/https://doi.org/10.1111/jors.12467
- Robertson, S. (2016). The potential mitigation of CO2 emissions via modal substitution of high-speed rail for short-haul air travel from a life cycle perspective – An Australian case study. Transportation Research Part D: Transport and Environment, 46, 365–380. https://doi.org/https://doi.org/10.1016/j.trd.2016.04.015
- Sánchez-Mateos, H. S. M., & Givoni, M. (2012). The accessibility impact of a new high-speed rail line in the UK–a preliminary analysis of winners and losers. Journal of Transport Geography, 25, 105–114. https://www.sciencedirect.com/science/article/pii/S0966692311001463
- Shao, S., Tian, Z., & Yang, L. (2017). High speed rail and urban service industry agglomeration: Evidence from China's Yangtze River Delta region. Journal of Transport Geography, 64, 174–183. https://www.sciencedirect.com/science/article/pii/S096669231630775X
- Shaw, S.-L., Fang, Z., Lu, S., & Tao, R. (2014). Impacts of high speed rail on railroad network accessibility in China. Journal of Transport Geography, 40, 112–122. https://www.sciencedirect.com/science/article/pii/S0966692314000544
- Shi, W., Lin, K.-C., McLaughlin, H., Qi, G., & Jin, M. (2020). Spatial distribution of job opportunities in China: Evidence from the opening of the high-speed rail. Transportation Research Part a: Policy and Practice, 133, 138–147. https://doi.org/https://doi.org/10.1016/j.tra.2020.01.006
- Sun, F., & Mansury, Y. S. (2016). Economic impact of high-speed rail on household income in China. Transportation Research Record: Journal of the Transportation Research Board, 2581, 71–78. https://doi.org/https://doi.org/10.3141/2581-09
- Takebayashi, M. (2016). How could the collaboration between airport and high speed rail affect the market? Transportation Research Part a: Policy and Practice, 92, 277–286. https://doi.org/https://doi.org/10.1016/j.tra.2016.06.010
- Wan, Y., Ha, H.-K., Yoshida, Y., & Zhang, A. (2016). Airlines’ reaction to high-speed rail entries: Empirical study of the northeast Asian market. Transportation Research Part a: Policy and Practice, 94, 532–557. https://www.sciencedirect.com/science/article/pii/S0965856416303202
- Wang, C., Meng, W., & Hou, X. (2020). The impact of high-speed rails on urban economy: An investigation using night lighting data of Chinese cities. Research in Transportation Economics, 80, 100819. https://doi.org/https://doi.org/10.1016/j.retrec.2020.100819
- Wang, D.-g., Niu, Y., & Qian, J. (2018). Evolution and optimization of China's urban tourism spatial structure: A high speed rail perspective. Tourism Management, 64, 218–232. https://doi.org/https://doi.org/10.1016/j.tourman.2017.08.010
- Wang, L., Liu, Y., Sun, C., & Liu, Y. (2016). Accessibility impact of the present and future high-speed rail network: A case study of Jiangsu Province, China. Journal of Transport Geography, 54, 161–172. https://www.sciencedirect.com/science/article/pii/S0966692316300527
- Wang, R., Ye, L., & Chen, L. (2019). The impact of high-speed rail on housing prices: Evidence from China’s prefecture-level cities. Sustainability, 11(13), 3681. https://doi.org/https://doi.org/10.3390/su11133681
- Wang, X., Huang, S., Zou, T., & Yan, H. (2012). Effects of the high speed rail network on China's regional tourism development. Tourism Management Perspectives, 1, 34–38. https://doi.org/https://doi.org/10.1016/j.tmp.2011.10.001
- Wang, Y., Liu, X., & Wang, F. (2018). Economic impact of the high-speed railway on housing prices in China. Sustainability, 10(12), 4799. https://doi.org/https://doi.org/10.3390/su10124799
- Westin, J., & Kågeson, P. (2012). Can high speed rail offset its embedded emissions? Transportation Research Part D: Transport and Environment, 17(1), 1–7. https://www.sciencedirect.com/science/article/pii/S1361920911001155
- Wetwitoo, J., & Kato, H. (2017). High-speed rail and regional economic productivity through agglomeration and network externality: A case study of inter-regional transportation in Japan. Case Studies on Transport Policy, 5(4), 549–559. https://doi.org/https://doi.org/10.1016/j.cstp.2017.10.008
- Willigers, J., & van Wee, B. (2011). High-speed rail and office location choices. A stated choice experiment for the Netherlands. Journal of Transport Geography, 19(4), 745–754. https://www.sciencedirect.com/science/article/pii/S0966692310001493
- Wu, W., Zheng, S., Wang, B., & Du, M. (2020). Impacts of rail transit access on land and housing values in China: A quantitative synthesis. Transport Reviews, 40(5), 629–645. https://doi.org/https://doi.org/10.1080/01441647.2020.1747570
- Xia, W., & Zhang, A. (2017). Air and high-speed rail transport integration on profits and welfare: Effects of air-rail connecting time. Journal of Air Transport Management, 65, 181–190. https://doi.org/https://doi.org/10.1016/j.jairtraman.2017.06.008
- Yang, Z., & Li, T. (2020). Does high-speed rail boost urban tourism economy in China?. Current Issues in Tourism, 23(16), 1973–1989.
- Yao, S., Zhang, F., Wang, F., & Ou, J. (2019). Regional economic growth and the role of high-speed rail in China. Applied Economics, 51(32), 3465–3479. https://doi.org/https://doi.org/10.1080/00036846.2019.1581910
- Yu, F., Lin, F., Tang, Y., & Zhong, C. (2019). High-speed railway to success? The effects of high-speed rail connection on regional economic development in China. Journal of Regional Science, 59(4), 723–742. https://doi.org/https://doi.org/10.1111/jors.12420
- Yue, Y., Wang, T., Liang, S., Yang, J., Hou, P., Qu, S., … Xu, M. (2015). Life cycle assessment of high speed rail in China. Transportation Research Part D: Transport and Environment, 41, 367–376. https://doi.org/https://doi.org/10.1016/j.trd.2015.10.005
- Zhang, A., Wan, Y., & Yang, H. (2019). Impacts of high-speed rail on airlines, airports and regional economies: A survey of recent research. Transport Policy, 81, A1–A19. https://doi.org/https://doi.org/10.1016/j.tranpol.2019.06.010
- Zhang, Q., Yang, H., & Wang, Q. (2017). Impact of high-speed rail on China’s Big three airlines. Transportation Research Part a: Policy and Practice, 98, 77–85. https://doi.org/https://doi.org/10.1016/j.tra.2017.02.005
- Zhang, Z. (2019). The impact of opening high-speed railway on guangxi’s economic growth—An empirical analysis based on DID model. Modern Economy, 10(3), 707–719. https://doi.org/https://doi.org/10.4236/me.2019.103048
- Zheng, L., Long, F., Chang, Z., & Ye, J. (2019). Ghost town or city of hope? The spatial spillover effects of high-speed railway stations in China. Transport Policy, 81, 230–241. https://doi.org/https://doi.org/10.1016/j.tranpol.2019.07.005
- Zhu, Y., Diao, M., & Fu, G. (2016). The evolution of accessibility surface of China in the high-speed-rail era. Environment and Planning A: Economy and Space, 48(11), 2108–2111.
Appendix
Appendix 1. Key Journal List for Literature Review
Appendix 2. Summary of HSR and its Socioeconomic Impact Publications by Country
Appendix 3. Studies Included in the Meta-Analysis
Appendix 4. Distribution of Output Estimates and Standard Deviations
Appendix 5. Explanatory Variables Used in Meta-Analysis
Appendix 6. Results of the Meta-Analysis (1)
Appendix 7. Results of the Meta-Analysis (2)
