
ABSTRACT
Regular physical activity prevents several non-communicable chronic conditions and premature mortality. The benefits of physical activity can be achieved through active transport, which refers to non-motorised/active means (e.g. walking, cycling, rollerblading) to move from one place to another. Active transport can be integrated into daily routines such as commuting to and from school and work. We undertook an overview of reviews to examine the association between active transport and physical activity across age groups. We aimed to provide a critical appraisal of research to date, and to identify research gaps that need to be addressed to advance the field. Eleven systematic reviews were included. Across children, youth and adults, active transport (mainly to school and work) was positively associated with physical activity and contributed approximately 5–45 additional minutes per day. The certainty of the evidence ranged from very low to moderate and was highest among studies that included both children and youth. There does not appear to be any clear differences by sex, measurement method for active transport or physical activity or review quality; however, some reviews noted that age and sex might moderate the association. Future research is needed to better understand the association among preschool-aged children and older adults, by sex and gender, in different socioeconomic and ethnic groups, and across the urban-rural spectrum. The field would benefit from more longitudinal and experimental research using device- and location-based measures to establish causality and separating location of destinations and mode of active transport (e.g. walking separate from cycling). Overall, evidence suggests that active transport is an important means to achieve daily physical activity recommendations.
Introduction
Regular physical activity (PA) prevents several non-communicable chronic conditions and premature mortality (2018 Physical Activity Guidelines Advisory Committee, Citation2018; Warburton & Bredin, Citation2017). The benefits of PA are achievable through a variety of domains including transport, household, school/occupation and recreation/leisure. Active transport (AT), using non-motorised/active means (i.e. walking, cycling, running, rollerblading, etc.) to move from one place to another, has often been recognised as a promising domain for achieving PA recommendations (Chaix et al., Citation2014; Tudor-Locke, Ainsworth, & Popkin, Citation2001). It is especially promising for increasing PA levels as it can be integrated into daily habits, for example, by commuting to and from school or work.
Transport professionals are well positioned to contribute to the improvement of public health by promoting active living through supportive community design. Collaboration between the transport, planning and public health fields continues to be important and continues to further our understanding of the public health implications of infrastructure investment (Sallis, Frank, Saelens, & Kraft, Citation2004). The relationships between built environments, individual behaviour and health are complex. Community design that is based on evidence-based strategies can ensure that healthier choices (e.g. walking instead of taking motorised transport) are easier choices. Built environment features such as walkability, greater street connectivity, mixed land-use, AT infrastructure and public transit access can support active ways to get to locations and improve public health (Karmeniemi, Lankila, Ikaheimo, Koivumaa-Honkanen, & Korpelainen, Citation2018). Built environments that promote AT, also have several co-benefits including the promotion of social belonging and human capital, environmental sustainability through reduced emissions and pollutants, the prevention of injuries from motorised vehicles, and economic benefits related to land value, job development, reduced healthcare costs, and improved economic performance of cities (Sallis et al., Citation2015).
Evidence suggests that children who engage in active commuting to school are more physically active as adults (Yang et al., Citation2014). Evidence also suggests that PA achieved by transport remains unchanged during the transition from childhood to adolescence (Kemp, Cliff, Chong, & Parrish, Citation2019). Globally, the prevalence of AT among children and youth is 47–53% (González, Aubert, Barnes, Larouche, & Tremblay, Citation2020), in adults, it accounts for 36% of total moderate-to-vigorous intensity PA (MVPA) (Strain et al., Citation2020). Among children and youth, English-speaking countries such as Canada, Ireland, New Zealand, and the United States have some of the lowest levels of AT as a usual mode of commute to school (Larouche, Citation2018). Among adults, PA and AT prevalence is lower in higher income countries (González et al., Citation2020; Guthold, Stevens, Riley, & Bull, Citation2018; Strain et al., Citation2020) and has been on the decline in most developed countries (McDonald, Citation2007; Reimers et al., Citation2021; Van der Ploeg, Merom, Corpuz, & Bauman, Citation2008). Walking is the most prevalent form of AT among children and adults, with most countries except Central and Northern Europe having a low prevalence of cycling (Larouche, Citation2018).
The positive association between AT and health is likely attributed to gains in PA by replacing time spent sedentary (i.e. sitting in a vehicle) with more active movement (i.e. walking to school/work). It is also possible that those who engage in AT compensate by reducing their PA in other domains, otherwise termed as “behavioural compensation”. Behavioural compensation has been observed in PA interventions and between domains of PA, whereby uptake of exercise or PA in one domain does not alter overall levels of PA because of declines in other domains (Gomersall, Rowlands, English, Maher, & Olds, Citation2013; Melanson, Citation2017; Nooijen et al., Citation2018; Ridgers, Timperio, Cerin, & Salmon, Citation2014). Other research has suggested an “activity synergy” exists, whereby increases in PA in one area result in gains in others (Butler, Orpana, & Wiens, Citation2007; Goodman, Mackett, & Paskins, Citation2011; Sahlqvist, Goodman, Cooper, & Ogilvie, Citation2013; Sugiyama, Merom, Reeves, Leslie, & Owen, Citation2010). Several previous systematic reviews have explored the association between AT and PA in specific age groups either as the primary focus of the review, or more broadly as a behavioural consequence of built environments. It is not yet clear if there is an effect of age on the relationship, but life stage has been shown to impact PA levels and the types of PA that individuals engage in (Christiansen, Madsen, Schipperijn, Ersbøll, & Troelsen, Citation2014; Gropper, John, Sudeck, & Thiel, Citation2020; Hirvensalo & Lintunen, Citation2011; Slingerland et al., Citation2007; Sprod et al., Citation2017). The objective of this study was to undertake an overview of reviews to systematically summarise and assess the certainty of evidence from all eligible systematic reviews in the past 20 years examining the association between AT and PA in high-income Organisation for Economic Co-operation and Development (OECD) countries across age groups. Given that there are a number of reviews that contain data of varying quality and scope, an overview of reviews helps us to understand the breadth of information on the association between AT and PA, while providing the ability to compare findings. Overviews help to synthesise results from previous systematic reviews allowing for critical appraisal of research to date and are useful for identifying areas where gaps exist.
Methods
Context and protocol registration
This overview of reviews is a sub-study of a larger overview looking at associations between the built environment and PA in high-income countries, which was prospectively registered with the International prospective register of systematic reviews (PROSPERO: CRD42020183182). For this overview, we explicitly looked at all systematic reviews within the last 20 years that examined the association between AT (built environment behaviour) and PA and met all inclusion criteria (see below). The overview adheres to the Preferred Reporting Items for Systematic Reviews and Meta-Analyses (PRISMA) statement (Page et al., Citation2021).
Study inclusion criteria
Population: No age restrictions were placed, but studies were grouped based on age distribution (e.g. pre-school aged children [0–4 years], school-aged children [5–11 years], youth [12–17 years], children and youth [<18 years], adults [≥18 years], older adults [≥65 years]). Review target populations were limited to include those who are “apparently healthy” (i.e. no chronic condition or disease) with generalisability to community settings. Reviews were required to include ≥80% of independent studies from the 37 high-income OECD countries (The World Bank, Citation2021). High-income OECD countries include: Australia; Austria; Belgium; Canada; Chile; Columbia; Czech Republic; Denmark; Estonia; Finland; France; Germany; Greece; Hungary; Iceland; Ireland; Israel; Italy; Japan; Korea; Latvia; Lithuania; Luxembourg; Mexico; Netherlands; New Zealand; Norway; Poland; Portugal; Slovak Republic; Slovenia; Spain; Sweden; Switzerland; Turkey; United Kingdom; and, United States.
Exposure: AT refers to using active ways to get from place to place, and could include walking, cycling, running, and other modes (e.g. skateboard, scooter, rollerblades). AT could be characterised according to a specific purpose/location (e.g. AT to school or work) or as general use. AT could be measured by self-report (e.g. questionnaire, diary/log) or by device(s) (e.g. combined GPS and accelerometer).
Outcome: PA defined as “any bodily movement produced by skeletal muscles that results in energy expenditure” (Caspersen, Powell, & Christenson, Citation1985). It includes behaviours with an energy expenditure of 1.5 or more metabolic equivalents (METs) and can include time spent in light (1.6–3.0 METs), moderate (3–6 METs) and vigorous (> 6 METs) intensity (Ainsworth et al., Citation2011), as well as step counts. PA could be measured either via self-report (e.g. questionnaire, diary/log), device (e.g. pedometers, accelerometers) or direct observation (e.g. bike/pedestrian counting).
Study designs: Systematic reviews with or without meta-analyses defined as reviews that searched a minimum of two bibliographic databases and provided a sample search strategy either in-text or in a supplemental file. Reviews that did not include a systematic search were ineligible as they pose a greater potential of introducing bias through the selection of literature.
Publication status and language restrictions: Only publications in English or French were eligible based on authors’ language capacity. Eligible systematic reviews included peer-reviewed publications, indexed dissertations, or grey literature (e.g. governmental or organisational reports). Conference abstracts were not eligible. No study design limitations were placed upon the primary studies included in the systematic reviews.
Timeframe: Systematic reviews published during the last 20 years (i.e. January 2000–1 May 2020).
Search strategy
A research librarian (KM) in collaboration with the authorship team created the search strategy. The search was first created in Medline using a combination of subject headings and keywords related to built environments and PA. A date limit of 2000–2020 was applied. A systematic review filter was adapted from “Strings Attached: CADTH’s Database Search Filters” (CADTH, Citation2019). Trial searches were run and modified to ensure that pre-identified key papers were captured by the search strategy. Once the strategy was finalised, the following electronic bibliographic databases were searched: Ovid Medline(R) All; Ovid Embase; Ovid APA PsycINFO; ProQuest Public Health; and, Scopus (see Supplemental Table 1 for search strategies). The reference lists of overviews of reviews identified in the search were screened for additional relevant papers.
A separate grey literature search was designed by the research librarian (KM) and carried out by the researchers. The grey literature search was completed on 11 May 2020 using a series of advanced Google search strings. All Google searches were conducted outside of a Google account. The full list of search strings can be found in Supplemental Table 1.
Selection of studies
Articles were imported into RefWorks and duplicates were removed. Screening was conducted in Covidence. Grey literature searches were exported and screened in Google Sheets. Two independent reviewers (SAP, NA, MdG, AJG) screened the titles and abstracts of all studies/reports to identify potentially relevant articles. The full texts of all studies that either met the inclusion criteria or provided insufficient information in the abstract to exclude were obtained and reviewed. Two independent reviewers (SAP, NA, MdG, AJG) screened the full texts for inclusion. If conflicts arose, discussion between the reviewers and a possible third reviewer was conducted to achieve a final decision. Reviewers were not blinded to the authors of the studies when screening. Study authors did not extract data or assess the quality for any of their own papers.
When more than one systematic review was identified within an age group, we assessed and reported on the degree of overlap in the primary studies using the corrected cover area (CCA) (Pieper, Antoine, Mathes, Neugebauer, & Eikermann, Citation2014). The degree of overlap within the primary studies was interpreted as slight (0–5%), moderate (6–10%), high (11–15%), or very high (> 15%) (Pieper et al., Citation2014). We reported on the degree of overlap for each age group, but this was not used as an exclusion criterion.
Quality assessment
The quality of the individual systematic reviews was assessed using the second edition of A MeaSurement Tool to Assess systematic reviews 2 (AMSTAR2) checklist, which is a widely applied critical appraisal tool for systematic reviews (Shea et al., Citation2017). An expansion of the AMSTAR, the AMSTAR 2 includes the capacity to assess the quality of systematic reviews that include non-randomised studies that are highly prevalent in the evidence base evaluating built environment interventions. Reviews which did not undertake a risk of bias/quality assessment using a validated tool, and which did not consider risk of bias/quality in the interpretation of the results were considered critically flawed and automatically considered to be of “critically low” quality. The quality of reviews was rated as: “high” – zero or one non-critical weakness, but no critical flaws; “moderate” – more than one critical weakness, but no critical flaws; “low” – one critical flaw with or without non-critical weaknesses; and, “critically low” – more than one critical flaw with or without non-critical weaknesses. Multiple non-critical weaknesses may reduce confidence in a review and may have resulted in reducing the overall appraisal down from moderate to low. One reviewer (SAP, SL, JJL or HSK) independently assessed the quality of each systematic review and a second (SAP, SL and/or NA) verified each assessment. If disagreements occurred, they were resolved through discussion or third-party adjudication.
Certainty of the evidence
The certainty of the evidence per age group was assessed as “high”, “moderate”, “low” or “very low” using the Grading of Recommendations Assessment, Development and Evaluation (GRADE) approach adapted for narrative syntheses. Certainty was based on the quality of the reviews, study designs within the reviews, population coverage, adequacy of sample sizes, and consistency of findings between reviews (Balshem et al., Citation2011; Murad, Mustafa, Schünemann, Sultan, & Santesso, Citation2017). Reviews that included >10% of the evidence from randomised controlled trials, quasi-experimental, natural experiment evaluations (or controlled trials) or prospective cohort studies began at “high”, whereas cross-sectional evidence began as “low”. Evidence was downgraded based on risk of bias (AMSTAR2 rating of the reviews’ quality), inconsistency between reviews (e.g. direction of effect consistent, heterogeneity), indirectness (e.g. external validity related to population studied, appropriateness of interventions, validity of measures), or imprecision (e.g. sample sizes, number of included studies). See Supplemental table 2 for a summary of the decision rules for assessing the certainty of the evidence. One reviewer (SAP) independently assessed the certainty of evidence for each age group and an additional reviewer (JJL) verified each assessment.
Data extraction and analysis
All extractors, using an initial subset of papers, piloted standardised data extraction forms using Google Forms. Extraction was completed by one reviewer (SAP, SL, JJL, or HSK) and verified by another (SAP, SL or NA). Results were summarised using a narrative synthesis and harvest plots. To identify the strength of the association between AT and PA, we used the methodology proposed by Sallis, Prochaska, and Taylor (Citation2000) and widely used by others in the field of PA (Choi, Lee, Lee, Kang, & Choi, Citation2017; Prince, Reed, McFetridge, Tremblay, & Reid, Citation2017; Rhodes, Saelens, & Sauvage-Mar, Citation2018; Stierlin et al., Citation2015; Zhang, Wulff, Duan, & Wagner, Citation2019). Evidence was considered inconsistent/mixed and presented using a “?” symbol when <60% of the studies within a review lacked a clear direction in association. A consistent association was identified when ≥60% of the studies within a review reported a positive (+), negative (–) or lack of association (0) based on statistical significance. Reviews with four or more studies which supported a direction of association, were coded as “++”, “- -“, “00” or “??”. Where possible, we calculated the direction of association ourselves if a study used a different cut-off (i.e. > 50%) or did not apply our cut-off. In some cases, the conclusions of review authors with respect to the direction of association differed from ours based on the cut-off. If the text of a review was strictly narrative and did not provide sufficient information for a count, we relied on the direction provided by the text. If independent studies included ages from other groups, they were included based on where the mean or mid-point of a range fell. Some reviews were included more than once if they examined multiple age groups separately.
Harvest plots were used to display the data visually in terms of association between AT and PA (positive, negative, mixed/null) within each age group and were based on the counting method. AMSTAR2 assessments were incorporated into the harvest plots by lowering the study bar height by one unit for each decrease in the quality level of the reviews (4 = high, 1 = critically low). Additionally, reviews that were considered more narrative in nature (i.e. literature reviews, not systematic reviews) (Grant & Booth, Citation2009), were excluded from the plots. A priori identified subgroup analyses included an examination of data by sex, age group, socioeconomic status, urban vs. rural location, and self-report vs. objective built environment and PA measures where possible. In contrast to what was mentioned in our protocol, we were unable to compare results by socioeconomic status or urban vs. rural location due to a consistent lack of reporting of these details in the reviews.
Results
Description of studies
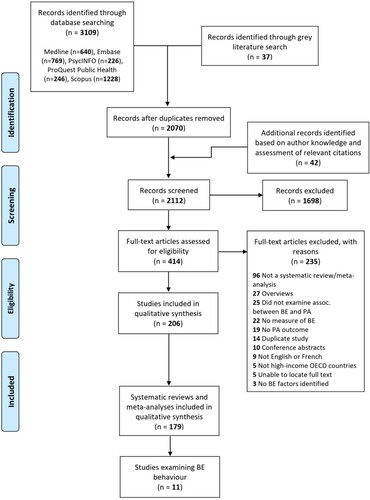
provides a detailed diagram of the literature search and screening process including common reasons for exclusion. The search of the electronic databases identified 3109 potentially relevant papers. Of these, 640 were identified in Medline, 769 in Embase, 226 in PsycINFO, 246 in ProQuest Public Health, and 1228 in Scopus. The grey literature search identified an additional 37 papers and author’s knowledge and scanning the bibliographies of overviews of reviews identified a further 42 papers for assessment. A preliminary title and abstract review resulted in the retrieval of 414 full-text papers for assessment. Of these, 11 met the criteria for inclusion in this overview of reviews. A list of excluded full texts and reasons can be found in Supplemental table 3.
Figure 1. PRISMA flow diagram.
See and for individual study characteristics and findings and for the summary of findings table including the certainty of evidence. The primary studies summarised in the included reviews were published over a 15-year period from 2002 to 2017 and included 28 different countries/regions (i.e. Europe, U.K.). No studies focused on or included an analysis of pre-school children, three reported results in school-aged children, three in youth, six summarised children and youth together, three looked at adults ≥18 years, and none looked specifically at other adult groups such as older adults. AT and PA were both assessed with a mix of self-report and device measures in each age group, those that used device measures tended to include smaller sample sizes. AT most often captured walking and cycling combined, or walking only, and represented the “usual” or “predominant” mode of transport to specific locations (i.e. use of AT to school or work, walk to school or work). Most studies included in the reviews were cross-sectional.
Table 1. Included review characteristics by age group.
Table 2. Descriptive study findings by age group.
Table 3. Summary of findings table for association between AT and PA across age groups.
Review quality
The AMSTAR2 assessments are provided in Supplemental table 4. Just over half (6/11) were assessed as being of critically low quality, two were low, one was moderate and two were of high quality. Most reviews did not: reference a pre-established protocol; explain requirements for study design inclusion criteria; perform screening or data extraction in duplicate; or, assess the risk of bias in individual studies. None reported on the funding sources of the studies included in the review. Most described the included studies in adequate detail and reported whether any potential conflicts of interest were present. Just over half discussed possible sources of heterogeneity in results. All but one clearly described their research question and inclusion criteria.
Outcomes across age groups
Children (∼5–11 years)
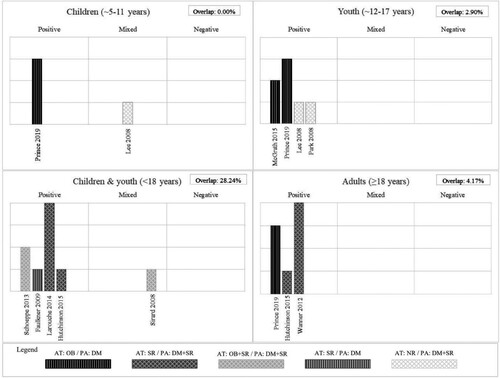
Two reviews (Lee, Orenstein, & Richardson, Citation2008; Prince, Butler, Rao, & Thompson, Citation2019), representing 14 unique cross-sectional studies with more than 4255 participants from five countries examined the association between AT to school and PA in school-aged children ((a)). One additional review was identified (Masoumi, Citation2017) but not included in the harvest plot because of its unsystematic assessment of the literature. This review generally reported a positive association between AT to school and total PA and commented that the linkage appears stronger in boys than in girls. Findings from the studies included in the harvest plot generally identified a positive association between AT to school and total PA; with one finding that AT was positively associated with total PA and one with mixed associations (55% positive). The review that included only studies that used objective measures for AT and PA were all consistently positive (Prince et al., Citation2019), whereas there was no clear direction in the review that included self-reported AT and a combination of self-reported and device-assessed PA (Lee et al., Citation2008). Lee et al. (Citation2008) found that AT contributed 11 to 45 minutes per day of additional PA and Prince et al. (Citation2019) found that among children who undertake active travel to school, AT comprised 11–22% of total MVPA. There was no clear difference in the degree of association between boys and girls. Neither review assessed the risk of bias for the child-specific studies. There was also no overlap between the two child-aged reviews. The certainty of the evidence for children is very low.
Figure 2. Review summary of associations between active transport and physical activity among: 2a: Children, 2b: Youth, 2c: Children and youth, 2d: Adults. Notes: Each bar represents a systematic review. The height of each bar indicates the review quality; with higher bars assessed as higher quality. Shading of bars represents the measurement methods of active transport and physical activity among the independent studies captured by each review. AT – active transport, DM – device measured, OB – objectively measured, PA – physical activity, SR – self-reported.
Youth (∼12–17 years)
Four systematic reviews (Lee et al., Citation2008; McGrath, Hopkins, & Hinckson, Citation2015; Park & Kim, Citation2008; Prince et al., Citation2019), representing 23 unique papers reporting on cross-sectional studies with 34,133 participants from 11 countries/regions examined the association between AT to school and PA in youth ((b)). Review quality ranged from critically low to moderate. Two reviews (McGrath et al., Citation2015; Prince et al., Citation2019) included a focus on studies that examined objectively measured locations and device-assessed PA. Findings consistently identified a positive association between AT and total PA. Lee et al. (Citation2008) found that AT contributes between 5 and 42 minutes per day of additional PA. One study indicated that among youth who undertook active travel, AT comprised between 35–58% of daily MVPA (Prince et al., Citation2019). Another suggested that the AT and PA association is present in urban but not rural settings (Park & Kim, Citation2008), although this was based on one cross-sectional study. There is no clear difference in the magnitude of association between boys and girls or by measurement method for AT and PA. The overlap between the reviews was considered slight (2.9%). The certainty of the evidence for youth is very low.
Children & youth combined (<18 years)
Five systematic reviews (Faulkner, Buliung, Flora, & Fusco, Citation2009; Hutchinson, Prady, Smith, White, & Graham, Citation2015; Larouche, Saunders, Faulkner, Colley, & Tremblay, Citation2014; Schoeppe, Duncan, Badland, Oliver, & Curtis, Citation2013; Sirard & Slater, Citation2008), including 85 unique papers with 389,684 participants from 22 countries/regions examined the association between AT and PA among children and youth combined ((c)). Review quality ranged from critically low to high. Findings generally identified a positive and consistent association between AT to school and total PA; with four of the five reviews finding that AT to school was positively associated with total PA, and one reporting mixed associations. Larouche et al.’s (Citation2014) review found that AT to school interventions led to increases in PA in three out of four included studies. They also found that the difference between AT users and passive travellers often exceeded the amount associated with the trip to school and that AT users were more active across the entire day (Larouche et al., Citation2014). Sirard and Slater (Citation2008) also found some evidence to suggest that active commuters are more active in general when compared to non-AT users during the afternoon, evening and weekends.
One review identified that independent mobility (without adult supervision) including travel to school and to leisure-time related locations was associated with greater PA (Schoeppe et al., Citation2013). Only one review included AT to destinations other than school and found it to be associated with total PA (Schoeppe et al., Citation2013). AT contributes from ∼0 to 45 minutes per day of additional PA (Faulkner et al., Citation2009; Larouche et al., Citation2014) and 663 to 3477 additional steps per day (Faulkner et al., Citation2009). There does not appear to be any clear differences in association by age, sex or measurement of PA (self-report vs. device). Larouche et al. (Citation2014) noted that many studies found inconsistencies in associations between boys and girls. The degree of overlap for child and youth studies was considered very high at 28.2%. The certainty of the evidence is moderate.
Adults (≥18 years)
Three systematic reviews (Hutchinson et al., Citation2015; Prince et al., Citation2019; Wanner, Götschi, Martin-Diener, Kahlmeier, & Martin, Citation2012), representing 60 unique papers with 666,490 participants from 16 countries/regions examined the association between AT and PA among adults largely using cross-sectional studies ((d)). Review quality ranged from critically low to high. Findings identified a consistent and positive association between AT and total PA. In contrast to children and youth, a greater number of studies examined AT in general and to a variety of destinations including work, services and parks, though many focused on commute to/from work. Only one review summarised the contribution of AT to overall PA, with AT contributing between 33% and 68% of total MVPA (Prince et al., Citation2019). Prince et al. (Citation2019) also found that the mode choice for trips determined time spent in various intensities of movement. Overall, there was a lack of evidence for older adults, and for whether findings differ by age, sex, or measurement of PA/AT. Study quality was only assessed in one review, with included studies largely being assessed as low quality, but the low-quality evidence did not have an impact on the overall pattern of associations (Wanner et al., Citation2012). The degree of overlap was slight at 4.2%. The certainty of the evidence is very low.
Discussion
This overview of reviews summarises and assesses the certainty of evidence for the association between AT and PA across age groups. We found a consistent and positive association between AT, mainly to school and work, and PA among children, youth and adults, with AT contributing approximately 5–45 minutes per day of additional PA. The certainty of the evidence was very low for reviews that investigated children and youth separately and adults (≥18 years) and moderate for reviews that combined children and youth. Most evidence to date has been cross-sectional and there is a lack of reviews in younger (i.e. ≤ 5 years) and older (i.e. ≥65 years) populations. Although limited by a lack of reporting, regardless of age group, there does not appear to be any clear differences by sex, AT or PA measurement method, or study quality. Some reviews noted that age and sex might moderate the association between PA and AT.
Comparisons with the literature
The evidence suggests that those who engage in AT are more physically active than those who do not. It is possible there is a bi-directional relationship between AT and PA, in that those who are more physically active in general are more likely to use AT. Research has identified that previous PA participation is a significant determinant of current PA (Bauman et al., Citation2012). As previously mentioned, there is conflicting evidence that supports both behavioural compensation (i.e. uptake of one type of PA results in reductions in others) (Gomersall et al., Citation2013; Melanson, Citation2017; Nooijen et al., Citation2018; Ridgers et al., Citation2014) and activity synergy (i.e. gains in PA by one means results in gains in other areas) (Butler et al., Citation2007; Goodman et al., Citation2011; Sahlqvist et al., Citation2013; Sugiyama et al., Citation2010). Most of the work summarised by the reviews included in this study were informed by cross-sectional studies (91% of studies), thereby limiting causal inferences. Among those reviews that included cohort or intervention studies, although limited in number, AT generally resulted in greater total PA suggesting activity synergy. Additionally, when reviews examined weekday/weekend differences among children and youth (Faulkner et al., Citation2009; Larouche et al., Citation2014), they often found similar weekend PA levels between those who used AT and those who did not to commute to school suggesting that AT is in addition to baseline PA levels.
AT has been shown to be influenced by the built environment. Greater distance to destinations is consistently negatively associated with AT to these locations (Rothman, Macpherson, Ross, & Buliung, Citation2018; Zhu et al., Citation2020). There is evidence to suggest that distances between homes and schools/workplaces are increasing among some high-income countries (Andersson, Malmberg, & Östh, Citation2012; McDonald, Citation2007; Statistics Canada, Citation2017). In the United States, 47% of the decline in walking to school has been attributed to the increased distance between home and school (McDonald, Citation2007). While the prevalence of AT to school appears to be on the decline in many countries (Grize, Bringolf-Isler, Martin, & Braun-Fahrländer, Citation2010; McDonald, Citation2007; Reimers et al., Citation2021; Van der Ploeg et al., Citation2008), AT to work is relatively stable or on the incline (Butler et al., Citation2007; Whitfield, Paul, & Wendel, Citation2015; Zander, Rissel, Rogers, & Bauman, Citation2014). Some of those most common cited barriers to AT by parents and youth include greater distance to school, concerns over traffic safety, and lack of time (Aranda-Balboa, Huertas-Delgado, Herrador-Colmenero, Cardon, & Chillón, Citation2020; Lu et al., Citation2014). Interventions focused on AT to school have resulted in small to moderate and promising increases in AT, though with a great degree of heterogeneity among studies and a need for longer follow-ups (Jones et al., Citation2019). Walking school buses and educational strategies, thus far, have proved to be the most effective (Jones et al., Citation2019). Interventions that combine both education and infrastructure changes are more effective than either alone (Larouche, Mammen, Rowe, & Faulkner, Citation2018). Among adults, low-quality evidence found that interventions aimed at shifting away from car transport to AT by using communication tools (e.g. mass media campaigns, written materials), economic tools (e.g. subsidies, reward systems), and supportive infrastructure (e.g. bike facilities at work, bike renting systems) are generally effective (Scheepers et al., Citation2014). Moderate quality evidence among all age groups has found that new infrastructure for walking, cycling and public transport have resulted in increased AT and overall PA (Karmeniemi et al., Citation2018). Additionally, high-quality evidence supports that improvements in accessibility by way of destinations, land-use mix, and public transit availability and higher walkability are associated with increased AT and overall PA (Karmeniemi et al., Citation2018). Most evidence from intervention studies has been among adults (Karmeniemi et al., Citation2018), but it is likely that the built environment may influence the PA of children and adults differently. As an example, bike lanes that provide separation from traffic are perceived as more important for children, compared to adults (Aldred, Elliott, Woodcock, & Goodman, Citation2016). While different built environment characteristics may influence age groups differently, evidence has suggested that the AT environment is an important location for PA among all age groups (Prince et al., Citation2019). Environmental characteristics that promote AT such as walkability, destinations, street connectivity, and walking and cycling infrastructure are generally positively associated with PA among both children and adults, though more research is needed to better understand effects among young children and older adults (Smith et al., Citation2017).
Strengths and limitations
The strengths of this overview include an a priori established protocol, a comprehensive and peer-reviewed search strategy including a grey literature search, the use of harvest plots that integrate review quality in addition to the direction of association, a life course approach, and the use of GRADE to assess the certainty of evidence. Our overview is largely limited by the evidence captured and the quality of the reviews. Our broad inclusion criteria for reviews meant that many did not apply rigorous systematic review methods; this is ultimately reflected in the AMSTAR2 assessments. Only one review assessed the certainty of evidence (using the GRADE approach) and three reviews assessed the quality of the independent studies. The evidence itself limits our review findings, relying on predominantly cross-sectional studies, heterogeneity in the assessment of PA and a reliance on crude self-report measures of AT use. The combined use of GPS and accelerometers is emerging, but only two reviews captured these location-based studies of PA.
Conclusions
Implications for future research
This overview of reviews was able to highlight important gaps in the research to date. Few reviews looked at the association between AT and PA among younger children (≤ 5 years) or older adults (≥ 65 years). It is important for future work to continue to better understand the contribution of AT to PA by age group, and whether age moderates the association between the built environment and these behaviours. Additionally, results were not consistently disaggregated by sex. There were no clear differences in association between males and females, but a couple of reviews noted that sex was found to moderate associations in some studies. Gender is a distinctly different concept than sex, and may influence AT and PA behaviours through social norms (Canadian Institutes of Health Research, Citation2014). Future research would also benefit from including a measure of gender (Clayton & Tannenbaum, Citation2016).
There is a need for future research to disaggregate by mode of AT (i.e. walking, cycling, scooter, etc.) and to incorporate more detailed measures of AT. Most studies reported walking and cycling combined as an indicator of AT, or walking only. AT was often quantified as the “usual” or “predominant” mode of transport to specific locations (i.e. use of AT to school, walk to school). These measures do not allow for AT that may be accrued through multi-modal travel (i.e. mix of walking and public transit), nor does it account for occasional use or use in a single direction of the commute (e.g. walk from home to school, bus from school to home). Research has shown that public transit use is also associated with greater PA, likely via multi-modal transit (i.e. walking to transit) (Hutchinson et al., Citation2015; Rissel, Curac, Greenaway, & Bauman, Citation2012). It is, therefore, important to capture AT associated with public transit use. Importantly, there is also a need for research looking at youth’s independent mobility (ability to move around in public areas unsupervised) and across all ages, AT to destinations outside of school and work.
Most research to date has focused on the contribution of AT to total PA or MVPA, few have reported on the contribution to light intensity PA or displacement of sedentary behaviour. It is also suggested to not only report associations by way of daily minutes of PA, but also as a proportion of the day to account for variation in wake time duration and relative to time in other intensities/behaviours. One of the reviews suggested that AT to/from school be reported as a continuous variable that reflects both frequency and distance to estimate a dose-response relationship between the two (Larouche et al., Citation2014). Fewer studies have used device measures of PA and even fewer have assessed AT via objective methods (e.g. GPS). AT is usually self-reported, while PA may be self-reported or device-assessed. Self-reports suffer from recall and response biases. Device-based location studies (e.g. combined GPS and accelerometers) help to objectively assess both AT and PA. Location-based studies to date have relied on smaller convenience samples that suffer from a lack of generalisability (Prince et al., Citation2019). There is a need for location-based studies with large representative samples to help advance this area of research. The differences in PA measurement (objective/device vs. self-report measures) and inherent biases with each likely contributed to the wide range (5–45 minutes per day) of additional PA attributed to AT alongside the heterogeneity in populations. As an example, systematic review evidence suggests an approximate 44% difference between self-reports and device measures (Prince et al., Citation2008).
There is a continued need for longitudinal and experimental studies to help confirm a causal link between the use of AT and PA levels. Since the publication of the included systematic reviews, new longitudinal and experimental studies have emerged (Brown, Tharp, Smith, & Jensen, Citation2017; Ek et al., Citation2020; Smith, Aggio, & Hamer, Citation2017). Additionally, studies may consider the use of compositional data analysis to understand how AT affects other behaviours (Foley, Dumuid, Atkin, Olds, & Ogilvie, Citation2018). While this overview focused on research from high-income OECD countries, most research has emerged from Europe (largely United Kingdom), Australia and the United States and has focused on urban dwelling populations. There is a need for future studies to examine and compare AT and PA in different countries and settings (e.g. rural, suburban, urban) and among different socioeconomic and ethnic groups.
Implications for practice
The World Health Organization’s Global Action Plan on Physical Activity 2018–2030 has a target of a 15% reduction in the global prevalence of physical inactivity in youth and adults by 2030 (World Health Organization, Citation2018). In some countries, the high rates of physical inactivity are attributed to changing patterns of transport, reliance on technology and urbanisation (World Health Organization, Citation2018). The Global Action Plan calls for investments in policies to promote walking and cycling in the wake of declining AT in many countries. Strategic objectives include strengthening the integration of urban and transport planning to promote walking, cycling and other forms of active mobility across urban, suburban and rural communities (World Health Organization, Citation2018).
While countries look to increase PA and AT in response to the Global Action Plan, the COVID-19 pandemic has posed both a challenge and opportunity affecting both PA and transport modes. Some areas have found that while public transit use has declined, AT and the use of private motor vehicles have increased as people look to maintain social distancing while travelling (de Haas, Faber, & Hamersma, Citation2020; Molloy et al., Citation2021; Savage & Turcotte, Citation2020). Additionally, it is likely that some have modified how they derive their PA (i.e. stopped attending gyms or playing sports) due to the need to maintain social distancing (De Vos, Citation2020). Over the course of the pandemic, cycling in Europe, Canada, the United States, and Australia has increased (Buehler & Pucher, Citation2021). Increases were largely observed on the weekends than on the weekdays. It was posited that smaller growth or reductions in weekday cycling was the result of declines in traveling to work/school and other destinations due to lockdowns and travel restrictions; suggesting that the growth in cycling rates were attributable to recreation cycling. Data also found that when cities emerged from lockdowns, cycling rates rose sharply, indicating a shift in mode of utilitarian travel (Buehler & Pucher, Citation2021). The pandemic provides an important opportunity to look at renewed promotion of AT. Walking and cycling can provide safe means of transport alongside health benefits and reductions in the severe outcomes resulting from COVID-19 (Brooks, Tingay, & Varney, Citation2021). Additionally, PA helps to promote physical and mental health during this stressful time. Some regions have responded to this need by swiftly changing or augmenting built environments to support AT (Fischer & Winters, Citation2021; Kraus & Koch, Citation2021), providing an excellent case study for novel ways to improve opportunities for AT. There is certainly a need for jurisdictions to invest in well-designed built environments that promote AT amongst residents. Moving forward, it will be important to better understand how rates of AT and PA change over the course of the pandemic and in response to environmental and policy changes.
Research has shown that the creation and improvements of infrastructure that supports pedestrians and cyclists results in increased AT and PA (Karmeniemi et al., Citation2018). Integrating AT into daily habits will not only increase PA, but shifting away from motorised transport also contributes to reductions in traffic and emissions and improved air quality, thereby representing an important means for combatting climate change and improving human health (Frank, Greenwald, Winkelman, Chapman, & Kavage, Citation2010; Lindsay, Macmillan, & Woodward, Citation2011; Rissel, Citation2009; Rojas-Rueda et al., Citation2016; Xia, Zhang, Crabb, & Shah, Citation2013). Additionally, improving AT infrastructure has the potential for positive economic impacts by stimulating retail and food-related spending through the patronage of cyclists and pedestrians (Volker & Handy, Citation2021).
Supplementary_Material
Download Zip (113.5 KB)Acknowledgements
We would like to thank Lisa Glandon for peer reviewing the Medline strategy and Hugues Sampasa-Kanyinga for his assistance with data extraction. The content and views expressed in this article are those of the authors and do not necessarily reflect those of the Government of Canada. SAP, NA, AJG, MdG, and RG conceived the study. SAP, NA, AJD, MdG, and RG designed the study. SAP, SL, JJL, NA, AJG, and MdG screened the studies and participated in data extraction. SAP and SL performed the data syntheses. SAP led the writing of the paper. All authors edited and critically reviewed the manuscript. SAP has the primary responsibility for the final manuscript. All authors read and approved the final manuscript.
Disclosure statement
No potential conflict of interest was reported by the author(s).
Data availability statement
All data generated or analysed during this study are included in this published article and its additional files.
References
- 2018 Physical Activity Guidelines Advisory Committee. (2018). 2018 Physical Activity Guidelines Advisory Committee scientific report. Washington, DC: Department of Health and Human Services.
- Ainsworth, B. E., Haskell, W. L., Herrmann, S. D., Meckes, N., Bassett, D. R., Tudor-Locke, C., … Leon, A. S. (2011). 2011 compendium of physical activities: A second update of codes and MET values. Medicine and Science in Sports and Exercise, 43(8), 1575–1581.
- Aldred, R., Elliott, B., Woodcock, J., & Goodman, A. (2016). Cycling provision separated from motor traffic: A systematic review exploring whether stated preferences vary by gender and age. Transport Reviews, 37(1), 29–55. http://doi.org/10.1080/01441647.2016.1200156
- Andersson, E., Malmberg, B., & Östh, J. (2012). Travel-to-school distances in Sweden 2000–2006: Changing school geography with equality implications. Journal of Transport Geography, 23, 35–43.
- Aranda-Balboa, M., Huertas-Delgado, F., Herrador-Colmenero, M., Cardon, G., & Chillón, P. (2020). Parental barriers to active transport to school: A systematic review. International Journal of Public Health, 65(1), 87–98.
- Balshem, H., Helfand, M., Schünemann, H. J., Oxman, A. D., Kunz, R., Brozek, J., … Guyatt, G. H. (2011). GRADE guidelines: 3. Rating the quality of evidence. Journal of Clinical Epidemiology, 64(4), 401–406.
- Bauman, A. E., Reis, R. S., Sallis, J. F., Wells, J. C., Loos, R. J., & Martin, B. W. (2012). Correlates of physical activity: Why are some people physically active and others not? Lancet, 380(9838), 258–271.
- Brooks, J. H. M., Tingay, R., & Varney, J. (2021). Social distancing and COVID-19: An unprecedented active transport public health opportunity. British Journal of Sports Medicine, 55(8), 411–412.
- Brown, B. B., Tharp, D., Smith, K. R., & Jensen, W. A. (2017). Objectively measured active travel and uses of activity-friendly neighborhood resources: Does change in use relate to change in physical activity and BMI? Preventive Medicine Reports, 8, 60–66.
- Buehler, R., & Pucher, J. (2021). COVID-19 impacts on cycling, 2019–2020. Transport Reviews, 41(4), 393–400. http://doi.org/10.1080/01441647.2021.1914900
- Butler, G. P., Orpana, H. M., & Wiens, A. J. (2007). By your own two feet. Canadian Journal of Public Health, 98(4), 259–264.
- CADTH. (2019). Strings attached: CADTH database search filters, 2020. https://www.cadth.ca/resources/finding-evidence/strings-attached-cadths-database-search-filters
- Canadian Institutes of Health Research. (2014). What is gender? What is sex? 2021. https://cihr-irsc.gc.ca/e/48642.html
- Caspersen, C. J., Powell, K. E., & Christenson, G. M. (1985). Physical activity, exercise, and physical fitness: Definitions and distinctions for health-related research. Public Health Reports, 100(2), 126–131.
- Chaix, B., Kestens, Y., Duncan, S., Merrien, C., Thierry, B., Pannier, B., … Perchoux, C. (2014). Active transportation and public transportation use to achieve physical activity recommendations? A combined GPS, accelerometer, and mobility survey study. International Journal of Behavioral Nutrition and Physical Activity, 11(1), 1–11.
- Choi, J., Lee, M., Lee, J., Kang, D., & Choi, J. (2017). Correlates associated with participation in physical activity among adults: A systematic review of reviews and update. BMC Public Health, 17(1), 356.
- Christiansen, L. B., Madsen, T., Schipperijn, J., Ersbøll, A. K., & Troelsen, J. (2014). Variations in active transport behavior among different neighborhoods and across adult life stages. Journal of Transport & Health, 1(4), 316–325.
- Clayton, J. A., & Tannenbaum, C. (2016). Reporting sex, gender, or both in clinical research? JAMA, 316(18), 1863–1864.
- de Haas, M., Faber, R., & Hamersma, M. (2020). How COVID-19 and the Dutch ‘intelligent lockdown’ change activities, work and travel behaviour: Evidence from longitudinal data in the Netherlands. Transportation Research Interdisciplinary Perspectives, 6, 100150.
- De Vos, J. (2020). The effect of COVID-19 and subsequent social distancing on travel behavior. Transportation Research Interdisciplinary Perspectives, 5, 100121.
- Ek, A., Alexandrou, C., Söderström, E., Bergman, P., Delisle Nyström, C., Direito, A., … Löf, M. (2020). Effectiveness of a 3-month mobile phone-based behavior change program on active transportation and physical activity in adults: Randomized controlled trial. JMIR Mhealth Uhealth, 8(6), e18531.
- Faulkner, G. E., Buliung, R. N., Flora, P. K., & Fusco, C. (2009). Active school transport, physical activity levels and body weight of children and youth: A systematic review. Preventive Medicine, 48(1), 3–8.
- Fischer, J., & Winters, M. (2021). COVID-19 street reallocation in mid-sized Canadian cities: Socio-spatial equity patterns. Canadian Journal of Public Health, 112, 376–390.
- Foley, L., Dumuid, D., Atkin, A. J., Olds, T., & Ogilvie, D. (2018). Patterns of health behaviour associated with active travel: A compositional data analysis. International Journal of Behavioral Nutrition and Physical Activity, 15(1), 26.
- Frank, L. D., Greenwald, M. J., Winkelman, S., Chapman, J., & Kavage, S. (2010). Carbonless footprints: Promoting health and climate stabilization through active transportation. Preventive Medicine, 50, S99–S105.
- Gomersall, S. R., Rowlands, A. V., English, C., Maher, C., & Olds, T. S. (2013). The ActivityStat hypothesis. Sports Medicine, 43(2), 135–149.
- González, S. A., Aubert, S., Barnes, J. D., Larouche, R., & Tremblay, M. S. (2020). Profiles of active transportation among children and adolescents in the global matrix 3.0 initiative: A 49-country comparison. International Journal of Environmental Research and Public Health, 17(16), 5997.
- Goodman, A., Mackett, R. L., & Paskins, J. (2011). Activity compensation and activity synergy in British 8–13 year olds. Preventive Medicine, 53(4–5), 293–298.
- Grant, M. J., & Booth, A. (2009). A typology of reviews: An analysis of 14 review types and associated methodologies. Health Information & Libraries Journal, 26(2), 91–108.
- Grize, L., Bringolf-Isler, B., Martin, E., & Braun-Fahrländer, C. (2010). Trend in active transportation to school among Swiss school children and its associated factors: Three cross-sectional surveys 1994, 2000 and 2005. International Journal of Behavioral Nutrition and Physical Activity, 7(1), 28.
- Gropper, H., John, J. M., Sudeck, G., & Thiel, A. (2020). The impact of life events and transitions on physical activity: A scoping review. PloS One, 15(6), e0234794.
- Guthold, R., Stevens, G. A., Riley, L. M., & Bull, F. C. (2018). Worldwide trends in insufficient physical activity from 2001 to 2016: A pooled analysis of 358 population-based surveys with 1·9 million participants. The Lancet Global Health, 6(10), e1077–e1086.
- Hirvensalo, M., & Lintunen, T. (2011). Life-course perspective for physical activity and sports participation. European Review of Aging and Physical Activity, 8(1), 13–22.
- Hutchinson, J., Prady, S. L., Smith, M. A., White, P. C. L., & Graham, H. M. (2015). A scoping review of observational studies examining relationships between environmental behaviors and health behaviors. International Journal of Environmental Research and Public Health, 12(5), 4833–4858.
- Jones, R. A., Blackburn, N. E., Woods, C., Byrne, M., van Nassau, F., & Tully, M. A. (2019). Interventions promoting active transport to school in children: A systematic review and meta-analysis. Preventive Medicine, 123, 232–241.
- Karmeniemi, M., Lankila, T., Ikaheimo, T., Koivumaa-Honkanen, H., & Korpelainen, R. (2018). The built environment as a determinant of physical activity: A systematic review of longitudinal studies and natural experiments. Annals of Behavioral Medicine, 52(3), 239–251.
- Kemp, B. J., Cliff, D. P., Chong, K. H., & Parrish, A. (2019). Longitudinal changes in domains of physical activity during childhood and adolescence: A systematic review. Journal of Science and Medicine in Sport, 22(6), 695–701.
- Kraus, S., & Koch, N. (2021). Provisional COVID-19 infrastructure induces large, rapid increases in cycling. Proceedings of the National Academy of Sciences, 118(15), e2024399118.
- Larouche, R. (2018). Last child walking?—Prevalence and Trends in active transportation. In Richard Larouche (Ed.), Children's active transportation (pp. 53–75). Elsevier.
- Larouche, R., Mammen, G., Rowe, D. A., & Faulkner, G. (2018). Effectiveness of active school transport interventions: A systematic review and update. BMC Public Health, 18.
- Larouche, R., Saunders, T. J., Faulkner, G. E. J., Colley, R., & Tremblay, M. (2014). Associations between active school transport and physical activity, body composition, and cardiovascular fitness: A systematic review of 68 studies. Journal of Physical Activity and Health, 11(1), 206–227.
- Lee, M. C., Orenstein, M. R., & Richardson, M. J. (2008). Systematic review of active commuting to school and children’s physical activity and weight. Journal of Physical Activity and Health, 5(6), 930–949.
- Lindsay, G., Macmillan, A., & Woodward, A. (2011). Moving urban trips from cars to bicycles: Impact on health and emissions. Australian and New Zealand Journal of Public Health, 35(1), 54–60.
- Lu, W., McKyer, E. L., Lee, C., Goodson, P., Ory, M. G., & Wang, S. (2014). Perceived barriers to children's active commuting to school: A systematic review of empirical, methodological and theoretical evidence. International Journal of Behavioral Nutrition and Physical Activity, 11, 140–140.
- Masoumi, H. E. (2017). Associations of built environment and children's physical activity: A narrative review. Reviews on Environmental Health, 32(4), 315–331.
- McDonald, N. C. (2007). Active transportation to school: Trends among U.S. Schoolchildren, 1969–2001. American Journal of Preventive Medicine, 32(6), 509–516.
- McGrath, L. J., Hopkins, W. G., & Hinckson, E. A. (2015). Associations of objectively measured built-environment attributes with youth moderate-vigorous physical activity: A systematic review and meta-analysis. Sports Medicine, 45(6), 841–865.
- Melanson, E. (2017). The effect of exercise on non-exercise physical activity and sedentary behavior in adults. Obesity Reviews, 18, 40–49.
- Molloy, J., Schatzmann, T., Schoeman, B., Tchervenkov, C., Hintermann, B., & Axhausen, K. W. (2021). Observed impacts of the covid-19 first wave on travel behaviour in Switzerland based on a large GPS panel. Transport Policy, 104, 43–51.
- Murad, M. H., Mustafa, R. A., Schünemann, H. J., Sultan, S., & Santesso, N. (2017). Rating the certainty in evidence in the absence of a single estimate of effect. Evidence-Based Medicine, 22(3), 85–87.
- Nooijen, C. F. J., Del Pozo-Cruz, B., Nyberg, G., Sanders, T., Galanti, M. R., & Forsell, Y. (2018). Are changes in occupational physical activity level compensated by changes in exercise behavior? European Journal of Public Health, 28(5), 940–943.
- Page, M. J., McKenzie, J. E., Bossuyt, P. M., Boutron, I., Hoffmann, T. C., Mulrow, C. D., … Moher, D. (2021). The PRISMA 2020 statement: An updated guideline for reporting systematic reviews. BMJ, 372, n71.
- Park, H., & Kim, N. (2008). Predicting factors of physical activity in adolescents: A systematic review. Asian Nursing Research, 2(2), 113–128.
- Pieper, D., Antoine, S., Mathes, T., Neugebauer, E. A. M., & Eikermann, M. (2014). Systematic review finds overlapping reviews were not mentioned in every other overview. Journal of Clinical Epidemiology, 67(4), 368–375.
- Prince, S. A., Adamo, K. B., Hamel, M., Hardt, J., Connor Gorber, S., & Tremblay, M. (2008). A comparison of direct versus self-report measures for assessing physical activity in adults: a systematic review. International Journal of Behavioral Nutrition and Physical Activity, 5(1), 56. http://doi.org/10.1186/1479-5868-5-56
- Prince, S. A., Butler, G. P., Rao, D. P., & Thompson, W. (2019). Evidence synthesis – where are children and adults physically active and sedentary? – a rapid review of location-based studies. Health Promotion and Chronic Disease Prevention in Canada: Research, Policy and Practice, 39(3), 67–103.
- Prince, S. A., Reed, J. L., McFetridge, C., Tremblay, M. S., & Reid, R. D. (2017). Correlates of sedentary behaviour in adults: A systematic review. Obesity Reviews, 18(8), 915–935.
- Reimers, A. K., Marzi, I., Schmidt, S. C. E., Niessner, C., Oriwol, D., Worth, A., & Woll, A. (2021). Trends in active commuting to school from 2003 to 2017 among children and adolescents from Germany: The MoMo study. European Journal of Public Health, 31(2), 373–378.
- Rhodes, R. E., Saelens, B. E., & Sauvage-Mar, C. (2018). Understanding physical activity through interactions between the built environment and social cognition: A systematic review. Sports Medicine, 48(8), 1893–1912.
- Ridgers, N. D., Timperio, A., Cerin, E., & Salmon, J. (2014). Compensation of physical activity and sedentary time in primary school children. Medicine and Science in Sports and Exercise, 46(8), 1564–1569.
- Rissel, C., Curac, N., Greenaway, M., & Bauman, A. (2012). Physical activity associated with public transport use – a review and modelling of potential benefits. International Journal of Environmental Research and Public Health, 9(7), 2454–2478.
- Rissel, C. E. (2009). Active travel: A climate change mitigation strategy with co-benefits for health New South Wales. Public Health Bulletin, 20(1–2), 10–13.
- Rojas-Rueda, D., de Nazelle, A., Andersen, Z. J., Braun-Fahrländer, C., Bruha, J., Bruhova-Foltynova, H., … Nieuwenhuijsen, M. J. (2016). Health impacts of active transportation in Europe. PLoS One, 11(3), e0149990.
- Rothman, L., Macpherson, A. K., Ross, T., & Buliung, R. N. (2018). The decline in active school transportation (AST): A systematic review of the factors related to AST and changes in school transport over time in North America. Preventive Medicine, 111, 314–322.
- Sahlqvist, S., Goodman, A., Cooper, A. R., & Ogilvie, D. (2013). Change in active travel and changes in recreational and total physical activity in adults: Longitudinal findings from the iConnect study. International Journal of Behavioral Nutrition and Physical Activity, 10(1), 28.
- Sallis, J. F., Frank, L. D., Saelens, B. E., & Kraft, M. K. (2004). Active transportation and physical activity: Opportunities for collaboration on transportation and public health research. Transportation Research Part A: Policy and Practice, 38(4), 249–268.
- Sallis, J. F., Prochaska, J. J., & Taylor, W. C. (2000). A review of correlates of physical activity of children and adolescents. Medicine and Science in Sports and Exercise, 32(5), 963–975.
- Sallis, J. F., Spoon, C., Cavill, N., Engelberg, J. K., Gebel, K., Parker, M., … Ding, D. (2015). Co-benefits of designing communities for active living: An exploration of literature. International Journal of Behavioral Nutrition and Physical Activity, 12, Article no. 30.
- Savage, K., & Turcotte, M. (2020, April 21). Commuting to work during COVID-19, 2021.
- Scheepers, C. E., Wendel-Vos, G., den Broeder, J. M., van Kempen, E. E. M. M., van Wesemael, P. J. V., & Schuit, A. J. (2014). Shifting from car to active transport: A systematic review of the effectiveness of interventions. Transportation Research Part A: Policy and Practice, 70, 264–280.
- Schoeppe, S., Duncan, M. J., Badland, H., Oliver, M., & Curtis, C. (2013). Associations of children's independent mobility and active travel with physical activity, sedentary behaviour and weight status: A systematic review. Journal of Science and Medicine in Sport, 16(4), 312–319.
- Shea, B. J., Reeves, B. C., Wells, G., Thuku, M., Hamel, C., Moran, J., … Henry, D. A. (2017). AMSTAR 2: A critical appraisal tool for systematic reviews that include randomised or non-randomised studies of healthcare interventions, or both. BMJ, 358, j4008.
- Sirard, J. R., & Slater, M. E. (2008). Walking and bicycling to school: A review. American Journal of Lifestyle Medicine, 2(5), 372–396.
- Slingerland, A. S., van Lenthe, F. J., Jukema, J. W., Kamphuis, C. B., Looman, C., Giskes, K., … Brug, J. (2007). Aging, retirement, and changes in physical activity: Prospective cohort findings from the GLOBE study. American Journal of Epidemiology, 165(12), 1356–1363.
- Smith, L., Aggio, D., & Hamer, M. (2017). Active travel to non-school destinations but not to school is associated with higher physical activity levels in an ethnically diverse sample of inner-city schoolchildren. BMC Public Health, 17(1), 13.
- Smith, M., Hosking, J., Woodward, A., Witten, K., MacMillan, A., Field, A., … Mackie, H. (2017). Systematic literature review of built environment effects on physical activity and active transport – an update and new findings on health equity. International Journal of Behavioral Nutrition and Physical Activity, 14(1), Article no. 158.
- Sprod, J., Olds, T., Brown, W., Burton, N., van Uffelen, J., Ferrar, K., & Maher, C. (2017). Changes in use of time across retirement: A longitudinal study. Maturitas, 100, 70–76.
- Statistics Canada. (2017). Journey to work: Key results from the 2016 Census. 2018. https://www12.statcan.gc.ca/census-recensement/2016/rt-td/jtw-ddt-eng.cfm
- Stierlin, A. S., De Lepeleere, S., Cardon, G., Dargent-Molina, P., Hoffmann, B., Murphy, M. H., De Craemer, M., & On behalf of the, DEDIPAC consortium. (2015). A systematic review of determinants of sedentary behaviour in youth: A DEDIPAC-study. International Journal of Behavioral Nutrition and Physical Activity, 12(1), 133.
- Strain, T., Wijndaele, K., Garcia, L., Cowan, M., Guthold, R., Brage, S., & Bull, F. C. (2020). Levels of domain-specific physical activity at work, in the household, for travel and for leisure among 327 789 adults from 104 countries. British Journal of Sports Medicine, 54(24), 1488–1497.
- Sugiyama, T., Merom, D., Reeves, M., Leslie, E., & Owen, N. (2010). Habitual active transport moderates the association of TV viewing time with body mass index. Journal of Physical Activity and Health, 7(1), 11–16.
- The World Bank. (2021, April 28). Data for High income, OECD members, 2021.
- Tudor-Locke, C., Ainsworth, B. E., & Popkin, B. M. (2001). Active commuting to school. Sports Medicine, 31(5), 309–313.
- Van der Ploeg, H. P., Merom, D., Corpuz, G., & Bauman, A. E. (2008). Trends in Australian children traveling to school 1971–2003: Burning petrol or carbohydrates? Preventive Medicine, 46(1), 60–62.
- Volker, J. M. B., & Handy, S. (2021). Economic impacts on local businesses of investments in bicycle and pedestrian infrastructure: A review of the evidence. Transport Reviews, 41(4), 401–431.
- Wanner, M., Götschi, T., Martin-Diener, E., Kahlmeier, S., & Martin, B. W. (2012). Active transport, physical activity, and body weight in adults: A systematic review. American Journal of Preventive Medicine, 42(5), 493–502.
- Warburton, D. E. R., & Bredin, S. S. D. (2017). Health benefits of physical activity: A systematic review of current systematic reviews. Current Opinion in Cardiology, 32(5), 541–556.
- Whitfield, G. P., Paul, P., & Wendel, A. M. (2015). Active transportation surveillance—United States, 1999–2012. Morbidity and Mortality Weekly Report: Surveillance Summaries, 64(7), 1–17.
- World Health Organization. (2018). Global action plan on physical activity 2018–2030: More active people for a healthier world. https://www.who.int/ncds/prevention/physical-activity/global-action-plan-2018-2030/en/
- Xia, T., Zhang, Y., Crabb, S., & Shah, P. (2013). Cobenefits of replacing car trips with alternative transportation: A review of evidence and methodological issues. Journal of Environmental and Public Health, 2013, 797312.
- Yang, X., Telama, R., Hirvensalo, M., Tammelin, T., Viikari, J. S., & Raitakari, O. T. (2014). Active commuting from youth to adulthood and as a predictor of physical activity in early midlife: The young Finns study. Preventive Medicine, 59, 5–11.
- Zander, A., Rissel, C., Rogers, K., & Bauman, A. (2014). Active travel to work in NSW: Trends over time and the effect of social advantage. Health Promotion Journal of Australia, 25(3), 167–173.
- Zhang, R., Wulff, H., Duan, Y., & Wagner, P. (2019). Associations between the physical environment and park-based physical activity: A systematic review. Journal of Sport and Health Science, 8(5), 412–421.
- Zhu, X., Yoshikawa, A., Qiu, L., Lu, Z., Lee, C., & Ory, M. (2020). Healthy workplaces, active employees: A systematic literature review on impacts of workplace environments on employees’ physical activity and sedentary behavior. Building and Environment, 168, Article no. 106455.