
ABSTRACT
Battery electric vehicles (BEV) are essential in most countries’ transition towards an efficient, cleaner and low-carbon transport system. BEV technology has been making rapid progress, but low market uptake poses major challenges for governments and industry. Based on the PRISMA framework (Preferred Reporting Items for Systematic Reviews and Meta-Analyses), we assessed 94 studies published in the era of BEVs becoming visible market products between 2010 and 2019. The main goal is to understand what we know about attitudes and behaviour of consumers/citizens towards BEVs. In contrast to the conventional wisdom that we know the key facilitators and obstacles in this area, we find that few studies are designed to identify causal effects of facilitators and obstacles, and findings on widely presumed key determinants are surprisingly mixed and context-dependent. We conclude that we still lack robust evidence on the facilitators of BEV uptake and prospective ownership. Moreover, and particularly alarming from a scientific viewpoint, many existing studies cannot be replicated because the respective data is unavailable, neither publicly accessible nor on request. Given the saliency of the issue, the main implication of our assessment is that a concerted, internationally coordinated effort in this area is needed, based on pre-registration of study designs and full accessibility of replication data.
1. Introduction
The passenger transport sector has severe impacts on human health (Nieuwenhuijsen, Citation2018) and the environment (Victor, Geels, & Sharpe, Citation2019) as it contributes both to local air and noise pollution and global climate change (Creutzig et al., Citation2015; Fuglestvedt, Berntsen, Myhre, Rypdal, & Skeie, Citation2008; Howey, Citation2012; Lelieveld, Evans, Fnais, Giannadaki, & Pozzer, Citation2015; Mills et al., Citation2009). For instance, transportation accounts for one-third of global carbon dioxide emissions (International Energy Agency, Citation2020). Motorised private transport, including private cars and vans, accounts for almost half of this share (Anable, Brand, Tran, & Eyre, Citation2012; Intergovernmental Panel on Climate Change, Citation2018; Nejat, Jomehzadeh, Taheri, Gohari, & Majid, Citation2015; Rodrigue, Comtois, & Slack, Citation2020). Reducing emissions from motorised private transport is crucial in meeting the Paris Agreement goals (Rockström et al., Citation2017).
Electric mobility based on battery electric vehicles (BEVs) figures prominently in many countries’ energy transition and sustainable mobility strategies (Koppelaar & Middelkoop, Citation2017). Compared to conventional (internal combustion engine, ICE) vehicles, BEVs allow for individual motorised transportation exclusively based on electricity from the grid or local sources, ideally from low-emission sources (Ajanovic & Haas, Citation2016; Kurani, Axsen, & Caperello, Citation2009). BEV technology has made rapid progress over the past few years. However, BEV uptake has been relatively slow (Almeida Neves, Cardoso Marques, & Alberto Fuinhas, Citation2019), with notable exceptions such as Norway. This paper assesses the existing scientific literature on the facilitators of and obstacles to BEV uptake. We assume that effective policies in this area should be based on a good understanding of consumer attitudes and behaviour.
Existing research on consumers’ attitudes and preferences towards BEVs has focused primarily on technical (acceleration, range, recharging time), contextual (charging availability, environmental impact, policy incentives), cost-related (purchase and operational costs, resale value), sociodemographic (income, education, gender, age), BEV-experience (knowledge and familiarity), or social (norms, neighbourhood effects) factors. However, there is still much debate about which factors are more (or less) relevant in different socio-cultural and decision contexts. Several reviews and meta-studies have looked into attitudes and preferences concerning BEVs, including Lane and Potter (Citation2007), Li, Long, Chen, and Geng (Citation2017), Rezvani, Jansson, and Bodin (Citation2015), Liao, Molin, and van Wee (Citation2017), Daramy-Williams, Anable, and Grant-Muller (Citation2019), Coffman, Bernstein, and Wee (Citation2017), and Hardman et al. (Citation2018). We build and expand on these reviews, focusing on assessing study designs, the reliability of findings, and how these relate to the identified facilitators’ effect directions in the existing literature. In other words, we aim to evaluate the reliability of existing research findings by assessing study designs. To do so, we categorise facilitators affecting consumers’ BEV preferences based on the study design assessment and the identified reliability of the study approaches. Specifically, we categorise effect directions based on whether the studies apply an experimental. Therefore, our approach here goes beyond existing literature reviews and allows us to assess the reliability of already well-studied drivers of BEV acceptance.
Specifically, this literature review aims to answer the following questions: (1) How reliable are these studies on BEV acceptance regarding replicability, generalizability, and survey design? (2) What facilitators affect consumers’ preferences regarding BEV acceptance? Our assessment is based on peer-reviewed studies published in 2010–2019 that use survey methods (including but not limited to survey experiments) to explain BEV preferences and uptake variation. We focus on publications focusing on battery electric vehicles. However, we also included studies dealing with other electric vehicles (such as plug-in hybrids) but only assessed results focusing on BEVs. To gather research articles for the study, we used the search engines and databases Web of Science and Google Scholar as a start. Many of these publications contain a brief review of existing research, which enabled backwards snowballing. We only include studies after 2010 because they cover findings from an era where BEVs reached a considerable amount of market visibility and comprise the most important influence for current studies as technologies are similar.
2. Selection of studies
Along the lines of the “preferred reporting items for systematic reviews and meta-analyses” (PRISMA) approach (Moher, Liberati, Tetzlaff, & Altman, Citation2009), we searched for peer-reviewed scientific journal articles. The literature review and identification of relevant publications were conducted from February to April 2020, focusing on articles published in the last decade (2010–2019). The inclusion criteria were specified in advance. We included articles focusing on facilitators of BEV acceptance based on a consumer or population survey or survey-embedded experiment. The outcome variable of interest was conceptualised broadly in terms of the “intention to buy a BEV,” “willingness to purchase a BEV,” “support of BEV uptake,” (or the negation of the previously mentioned terms), “willingness to pay for a BEV,” “support of BEV uptake,” and “general opinions towards BEVs.” In what follows, we will refer to the aforementioned different words describing attitudes and preferences concerning BEV – although we acknowledge some nuanced differences across the concepts – as BEV acceptance. All search terms were in English. We focused on the years 2010–2019 because BEVs developed from being a small niche product to a visible market product in this period (Koppelaar & Middelkoop, Citation2017). We consider this market visibility important because individuals are more likely to have well-defined attitudes and preferences over something they are at least somewhat familiar with (Liberman, Trope, & Stephan, Citation2007).
Potentially relevant studies were identified using the Web of Science databases using the following search string:
(Ts = ((electric and vehicle and battery) and survey and (intention to buy OR willingness to pay OR acceptance))) and language: (English) and document types: (Article) indexes = SCI-Expanded, sSCI, A&HCI, cPCI-S, cPCI-SSH, bKCI-S, bKCI-SSH, eSCI, CCR-Expanded, IC timespan = 2010–2019
“electric vehicle” OR “battery electric vehicle” OR “battery electric vehicles” OR “BEV” OR “BEVs” AND “survey” OR “intention to buy” OR “willingness to pay” OR “acceptance”
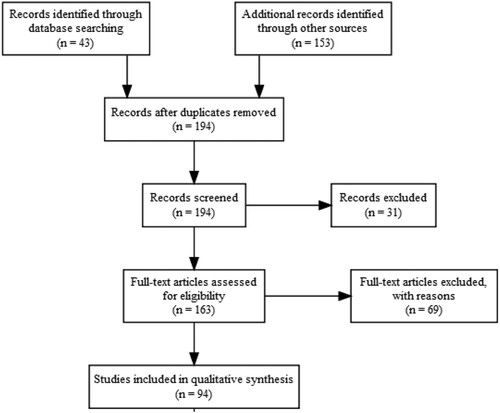
163 articles were consequently selected for a full review. We selected studies based on consumer and population surveys and focused on BEVs. Specifically, studies had to include an analysis assessing facilitators of BEV acceptance or were otherwise excluded if they only focused on other drivetrains such as plug-in hybrid electric vehicles (PHEVs). 69 of these studies did not meet the inclusion criteria because they were not based on a survey. This exclusion results in 94 eligible peer-reviewed articles (see Appendix A2).
Figure 1. Preferred reporting items for systematic reviews and meta-analyses (PRISMA) flow diagram of information through the stages of the review.
The 94 studies on which we base our assessment were published in 41 peer-reviewed journals and used survey-based research to identify the facilitators of BEV uptake. We synthesised those 94 articles by coding each of them according to facilitators of BEV acceptance. We trained paid research assistants as coders. In addition, the authors also coded articles and double-checked the coding results. We then discussed diverging assessments of these pending cases between the authors to make a final decision.
The facilitators were in a first-round identified by the authors and collected by the coders, resulting in a total of 21 explanatory facilitators. In a second round, we then checked in each of those 94 studies whether the respective facilitators were part of the analysis and coded them according to whether they were not present (NA), had a positive (1), negative (−1) or no (0) effect, which is displayed and discussed in section 4. Specifically, results of the analyzed facilitators of BEV acceptance were categorised regarding their overall effect on BEV acceptance: 1 if it had a statistically significant positive effect within a 95% confidence interval, −1 for statistically significant negative effects, and 0 for null-effects and statistically insignificant results. These results are presented in section 4. To summarise and better illustrate the 21 facilitators, we additionally grouped them into seven overarching determinant categories:
Technical determinants: motor power, driving range, reliability, and recharging time;
Contextual determinants: market availability, charging availability, environmental impact, and policy incentives;
Cost related determinants: purchase and operation costs, fuel efficiency, and resale value;
Sociodemographic determinants: income, education, gender, and age;
Attitudinal and behavioural determinants: travel demand, number of vehicles in household, environmental attitudes, and technology attitudes;
BEV-specific experience: knowledge, and familiarity;
Social determinants: social and personal norms, neighbourhood effects, and word-of-mouth effects.
We were solely interested in the direct effects of the studied facilitators on BEV acceptance. However, there are several potential interactions among those facilitators also leading to indirect effects. One example includes policy incentives that can, for example, affect both prices (e.g. cost-related measures such as subsidies) and infrastructure (e.g. infrastructure built-up such as charging stations). We, however, only focused on what the presence or announcement of this specific factor (for example, a policy measure) has on BEV acceptance. We deliberately did not include interaction effects, although several studies also focus and control for these within their research designs.
3. Replication material and study scope assessment
Besides synthesising the 94 studies along those lines, we assessed their overall study design and reliability. Specifically, we examined four aspects indicating the overall quality of the research field: (1) Replication data availability, (2) overall geographical scopes, (3) sampling quality and representativeness, and (4) causal identification strategy.
First, we looked at data availability. Given the replication crisis in various areas of the sciences (Camerer et al., Citation2016; Fanelli, Citation2010), we firmly believe that both scientists and policy-makers should have more confidence in findings that third parties can replicate, including data processing leading from (anonymized) raw survey data to the data that is analyzed and produced the reported findings. This does not mean that study results for which replication data is not available are uninteresting or useless. However, in the absence of replication data, no one except the researcher(s) will judge how reliable and trustworthy the respective findings are.
To assess the 94 identified articles in this respect, we followed a two-step approach. First, we checked whether data for the study was made available in a public repository. Second, until some years ago, it was more common to make data available only on request. We contacted corresponding study authors by emailFootnote1 (if the data was not publicly available) and later additional co-authors if the corresponding author did not respond. After one reminder email (if needed) and still no response, we categorised data availability for the respective study as “no response”. We collected the data sets and codebooks that were accessible online or that we received in a replication data folder. All 94 articles were coded according to these criteria:
Replication data is available online in a public repository.
Replication data is available on request
Replication data is not available
No response (Replication data is not available)Footnote2
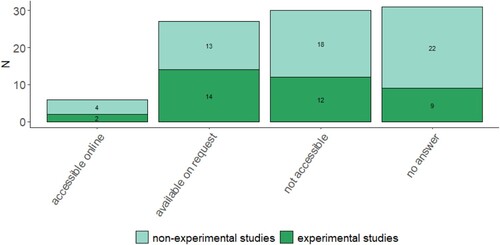
provides an overview of the data availability for the 94 studies in our assessment. Only six studies provide online access to their replication material. Additionally, the authors of 27 studies were willing to send us their data upon request and did so but did not allow us to make data publicly available.Footnote3 The authors of 30 studies were not willing or able to share the data with us. Reasons to not share the data were (1) a university ethics council/IRB agreement incompatible with sharing the data, (2) non-accessibility of the data, and (3) that they were simply not willing to share their data. For another 31 studies, we failed to get any reply to our request – either because we simply did not receive any replies or the contact information was outdated.
Figure 2. Availability of replication material.
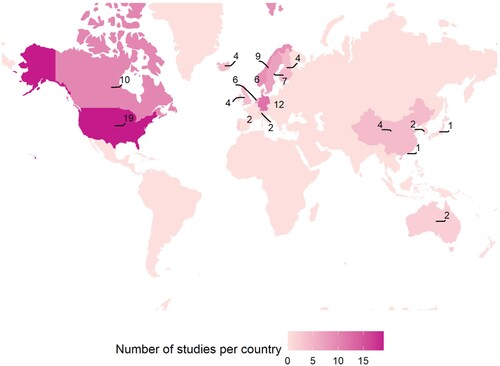
Additionally to replicability as a quality assessment, we were also interested in the geographical scopes of existing studies. Specifically, we argue that in geographical scope, generalizability and external reliability may be limited if only a handful of countries have so far been studied. provides an overview of the geographic scope of the 94 studies, as we argue that cultural, economic, social and political country-context matter. It shows that existing research focuses heavily on North America and Europe, with a few studies also covering countries in Asia. Most studies (23) focus on the U.S., followed by Germany (15), and Canada (11). Nine studies were conducted in Norway and China each, followed by the Netherlands, Denmark, and Sweden with seven studies each. The 94 studies covered 19 countries, whereas seven focused on more than one country but never more than five countries per single study.
Figure 3. Geographical distribution of studies by country.
Unbeknown to us in any previous review of BEV acceptance factors, we also assessed the sampling quality and representativeness of studies. Specifically, we qualified studies by their study population (e.g. the population the study aims to generalise on) and whether it is based on a representative random sample or not (see Appendix A2 for an overview of all studies). This assessment is important because we essentially want to conclude on consumers or citizens view in general, at least for a given country and point in time. But, we can do that only if we have high-quality representative (random) samples of the respective population. For example, studies of technical university employees may show positive effects. However, such results may mean nothing for the average consumer or citizen.
Sampling quality and inferences for the population of consumers and citizens across the identified studies vary greatly. The study population was thus rather diverse. 33 studies used a population-based sample to assess their research questions. 31 studies focused on individuals who were about to buy a car soon or did so within the past few years. Another 20 studies focused merely on motorists, thus only including individuals who already own a car. Five studies specifically asked BEV users. Other studies also focused on driving schools, EV association members, car-sharing members, or technology enthusiasts. In addition, a total of 2 studies did not specify their study population. Of the 94 studies identified, 27 are based on a representative random sampling approach (see Appendix A2). The majority of studies thus does not rely on representative random samples of a population for which inferences are drawn. In addition, a vast majority of the identified studies do not indicate detailed response rates or even the specific population from which they were sampling. These points imply only limited possibilities to generalise findings, draw conclusions on the study population, and replicate individual studies within another context or point in time.
Unbeknown to us in any previous review of BEV acceptance factors, we also differentiated studies by whether their data and findings were based on an experimental or non-experimental study design because experimental approaches are usually considered the “gold standard” for identifying causal effects. However, few studies use such study designs (Graham-Rowe et al., Citation2012; Schmalfuß, Mühl, & Krems, Citation2017). In the following section, we have thus coded the included facilitators by whether studies rely on an experimental or non-experimental study design. Overall, 37 of the 94 studies relied on an experimental approach (or a similar causal identification strategy). Thus, only around 40% of the studies are designed to identify causal effects of facilitators and obstacles.
Overall, the findings for these four assessment criteria are somewhat alarming, specifically as findings on widely presumed key determinants can be highly context-dependent. First, few studies have accessible replication materials, neither publicly nor on request, thus raising questions on their replicability. Second, the geographical scope of the existing research is predominantly limited to North America and some European countries, thus raising questions regarding the robustness and generalizability of the studied results in another context, specifically in developing countries. Third, sampling quality appears to be somewhat skewed towards early adopters rather than the general population. Only a few studies rely on random samples of a population for which inferences are drawn. This finding thus again challenges the generalizability of the presented results. Last but not least, only a minority of papers applied methodological approaches allowing for causal identification strategies, thus questioning the cause–effect connection of BEV acceptance and the studied facilitators.
4. Determinants of BEV acceptance
A rigorous quantitative meta-analysis based on the six online available datasets from the 94 identified studies is prone to errors. The reasons are twofold: first, we seek to synthesise findings for both studies for which replication data is available and for those where this is not the case. Second, depending on scientific discipline and context, outcome variables and determinants are conceptualised, defined, and measured differently, and studies focus on different sets of determinants. For these reasons, the following assessment focuses on the direction of (positive, negative, no effect) identified effects of particular determinants rather than a comparison of significance levels and substantive effects in statistical models.
Overall, the categorisation of findings across different studies by grouping them into the different facilitators allows us to identify consistency of findings across the different studies and thus assess what facilitators have a) shown to be robust across different contexts and over time, and b) been predominantly studied. Our review of the 94 studies results in 21 facilitators classified into the seven determinant groups above, presented in the remainder of this section.
4.1. Technical determinants
shows the coverage of and findings for four technical, car-specific determinants that may affect BEV acceptance. Motor power refers to different concepts usually associated with performance, such as top speed, engine power, and acceleration time. Driving range means the maximum distance a BEV can drive with a single full charge. Reliability refers to how individuals assess the quality and stability of a BEV and how they view BEV technology overall, thus summarising the assessment of technical determinants. Charging time refers to the total time used to recharge a BEV, depending on the battery capacity and the charger's power.
Figure 4. Effect of technical determinants on BEV acceptance.
Note: This figure summarises reporting results on the respective facilitators of BEV acceptance. The effect direction indicates the number of studies reporting significant effects (“negative”,< “b>positive”) or non-significant effects (“none”) on BEV acceptance. Color-codes indicate experimental or non-experimental study design.
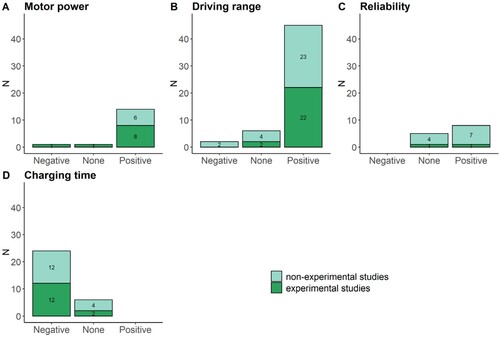
It turns out that 14 out of 16 studies dealing with motor power show that individuals generally prefer more motor power (Larson, Viáfara, Parsons, & Elias, Citation2014; She, Qing Sun, & Xie, & C, Citation2017; Ziegler, Citation2012). However, in Mabit and Fosgerau (Citation2011), acceleration time has no significant effect, probably because heterogeneous preferences in the population may cancel each other out. Specifically, women prefer lower acceleration compared to men who prefer higher-performance vehicles (Mabit & Fosgerau, Citation2011).
Driving range is one of the most frequently studied determinants in this literature and can vary highly depending on car type and usage. For example, the approximate driving range for a 2013 EV was around 120 km, but is steadily increasing with the 2016 Tesla S-90 model approximately reaching up to 500 km (Kempton, Citation2016). 45 out of 53 studies covering this determinant find a positive association between the higher driving range and pro-BEV acceptance. However, many studies focus primarily on (the fear of) limited driving range, which we jointly assessed for comparison. For example, Carley, Krause, Lane, and Graham (Citation2013) report that, based on a survey with citizens in large U.S. cities, over 70% of respondents consider the (comparatively lower) driving range of BEVs to be a disadvantage. Also, focusing on staff members of a technological university, Egbue and Long (Citation2012) find that one-third of the respondents named limited battery range as their major concern. In a nationwide U.S. survey, Hidrue, Parsons, Kempton, and Gardner (Citation2011) found that their respondents were willing to pay $5600 ($12,700) more when increasing the driving range from 75 to 150 (300) miles. Hackbarth and Madlener (Citation2013) found similar results showing that German respondents were willing to pay €16–33 more for each additional kilometre a BEV can drive with one charge.
Views on new technologies may act as a barrier to adoption. For BEVs, such views may appear in the form of concerns and uncertainties about the market readiness of the technology and its reliability (Berkeley, Jarvis, & Jones, Citation2018). Stronger beliefs in the reliability of the BEV technology should thus result in greater BEV acceptance. In an online survey with 481 respondents from a U.S.-based technical university, 10% named reliability their biggest concern (Egbue & Long, Citation2012). In a study of 476 Tianjin (China) urban residents, reliability ranked second among 14 different concerns regarding BEVs (She et al., Citation2017).
Charging time can vary highly depending on the car type, the charger type, and the percentage of the recharged battery. For example, slow charging for a Nissan Leaf takes around 11 hours, and rapid charging 1 hour, while these numbers are approximately double as high for a Tesla Model S. 24 out of 30 studies report that longer charging time is (predominantly negatively) associated with BEV acceptance (Hackbarth & Madlener, Citation2013; Mabit & Fosgerau, Citation2011). For example, Hidrue et al. (Citation2011) identified long charging time as one of the three main concerns of consumers. Based on a choice experiment with 3029 car buyers in the U.S., they observed that respondents valued a charging time reduction by one hour in the order of $425 to $3250 when purchasing a new vehicle. However, Bockarjova and Steg (Citation2014) and Helveston et al. (Citation2015) are among the very few studies that explicitly distinguish between slow and fast charging and find specifically stronger time preferences for fast charging stations.
4.2. Contextual determinants
shows the results for four contextual determinants affecting BEV acceptance. Market availability refers to the number of car models available on the market that may differ in design, size and other characteristics. Charging availability indicates the actual and perceived accessibility of both slow and fast charging stations available to study participants in public and private spaces. The environmental impact refers to how respondents assess the environmental impact of BEVs compared to conventional cars. Policy incentives refer to measures to foster BEV acceptance and uptake and can range from information measures, over road space privileges, to subsidies when purchasing a BEV (for examples of such policies, see Brückmann & Bernauer, Citation2020; Huber & Wicki, Citation2021; Wicki, Huber, & Bernauer, Citation2020).
Figure 5. Effect of contextual determinants on BEV acceptance.
Note: This figure summarises reporting results on the respective facilitators of BEV acceptance. The effect direction indicates the number of studies reporting significant effects (“negative”,< “b>positive”) or non-significant effects (“none”) on BEV acceptance. Color-codes indicate experimental or non-experimental study design.
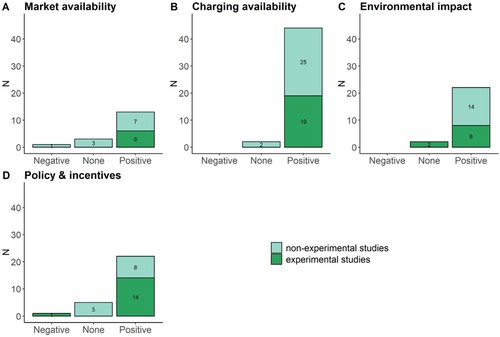
A larger number of market-available BEV models consumers can choose from has a positive effect in 13 out of the identified 16 studies covering this factor. For example, Chorus, Koetse, and Hoen (Citation2013) and Hoen and Koetse (Citation2014) observe that having more BEV models on the market increases respondents’ probability of choosing a BEV as their next car.
Availability of charging infrastructure has an overwhelmingly positive effect. Only 2 out of 46 studies covering this determinant did not find a significant positive effect. In the study by Egbue and Long (Citation2012) around, 1 in 5 of their 481 predominantly technophile U.S. respondents named lacking charging infrastructure as their biggest BEV concern. In a study with UK residents and employees of an energy company, Skippon and Garwood (Citation2011) find that more charging infrastructure increases the stated willingness to purchase a BEV. The possibility for home and workplace charging were ranked as the most critical determinant of pro-BEV choices (Skippon & Garwood, Citation2011). Several authors thus conclude that more public charging infrastructure is needed to alleviate concerns about BEV range and promote BEV adoption (Axsen & Kurani, Citation2013; Graham-Rowe et al., Citation2012).
The environmental impact of BEVs is ambivalently discussed in the literature, although current studies clearly show that BEVs are superior compared to conventional vehicles. While most studies have identified BEVs as an effective option to alleviate GHG emissions by ICEVs in the road transport sector (Choi, Shin, & Woo, Citation2018; Hoekstra, Citation2019; Moro & Lonza, Citation2018; Woo, Choi, & Ahn, Citation2017), other studies show that if electricity is produced mainly using fossil fuels, BEVs may report higher GHG emissions than conventional cars (Rangaraju, De Vroey, Messagie, Mertens, & Van Mierlo, Citation2015). The vast majority of studies show that the reduced environmental impact of BEVs, relative to ICE cars, positively affects BEV acceptance. In 22 out of 24 studies covering this determinant, individuals prefer environmentally friendly car alternatives. For example, a survey with around 3000 Dutch car owners shows that they were more likely to choose a BEV when they perceived the environmental impacts of conventional vehicles to be highly negative and at the same time perceived BEVs to decrease those negative impacts (Bockarjova & Steg, Citation2014; Jensen, Cherchi, & Mabit, Citation2013; Kormos, Axsen, Long, & Goldberg, Citation2019; Peters & Dütschke, Citation2014).
Several studies have examined the effects of particular policy measures on BEV uptake. Examples include through governmental support lowered vehicle prices (Coffman et al., Citation2017) and policies to increase public charging infrastructure (Egbue & Long, Citation2012). Wang, Wang, Li, Wang, and Liang (Citation2018) find strongest effects for convenience policies, such as high occupancy vehicle (HOV) lane access for EVs or, dedicated parking spaces and no restrictions from the even-and odd-numbered licence plates scheme in their study with interested people in China. 22 out of 26 studies covering policy instruments to promote BEV uptake report positive effects.
4.3. Costs
summarises findings for four cost-related determinants. The purchase price refers to the total acquisition costs when buying a BEV. Operational costs pertain to all costs that have to be paid regularly, such as insurance, maintenance, and energy costs. Fuel efficiency refers to how long it takes to offset a higher vehicle purchase price through savings on fuel. Last but not least, resale value refers to the expected price for a BEV on the second-hand market.
Figure 6. Effect of cost determinants on BEV acceptance.
Note: This figure summarises reporting results on the respective facilitators of BEV acceptance. The effect direction indicates the number of studies reporting significant effects (“negative”,< “b>positive”) or non-significant effects (“none”) on BEV acceptance. Color-codes indicate experimental or non-experimental study design.
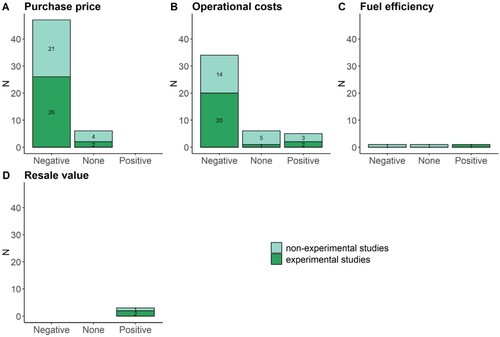
A (higher) purchase price negatively affects BEV acceptance in most of the 53 studies covering this determinant, especially when measured as willingness to pay for or buy a BEV. Individuals who primarily buy second-hand cars are particularly sensitive to costs (Hoen & Koetse, Citation2014; Jensen et al., Citation2013). However, Jensen et al. (Citation2013) do not find significant income effects but observe that individuals who buy small cars are more price-sensitive. However, a higher resale value may be an option to address higher purchase prices, as three identified studies show that expecting higher revenues when selling a car on the second-hand market increases BEV acceptance.
The picture for operation costs looks similar, but somewhat less clear: 34 out of 45 studies identified a negative relation between higher operational costs and BEV acceptance. Most studies use energy costs to measure operation costs. Energy costs are thereby either operationalised as cost per distance, fuel price, or efficiency (Musti & Kockelman, Citation2011). Also, regular maintenance costs are included in some studies (Hess, Fowler, Adler, & Bahreinian, Citation2012), while others combine both energy and costs per distance into an overall operation cost measure (Mabit & Fosgerau, Citation2011). In addition, Jensen et al. (Citation2013) found that fuel costs for BEVs appear to be significantly more important than for conventional vehicles. The findings show that these operational costs, as they also do for ICE vehicles, predominantly negatively affect BEV acceptance. However, they have lower energy costs than ICE vehicles do, which would result in lower operational costs (Jensen et al., Citation2013). This relative assessment might also be the reason for the rather counter-intuitive finding in five studies stating that higher operation costs can have a positive effect, as respondents may (unconsciously) compare these costs to conventional vehicles where operational costs may also rise in the future – and are already today underestimated by half (Andor, Gerster, Gillingham, & Horvath, Citation2020).
With only three studies, fuel efficiency appears to be a rarely studied factor to explain BEV acceptance in academic research. However, it might play an essential role in the future when specific surcharges and pricing mechanism policies are introduced that are dependent on vehicle emissions. However, fuel efficiency is likely to correlate with operational costs and environmental impacts, potentially also explaining the rather diverse outcome regarding effect directions of the three identified studies. For example, Beck, Rose, and Hensher (Citation2011) conducted a choice experiment among 793 recent car buyers in Australia to identify the potential of their respondents to switch to more fuel-efficient cars such as BEVs with lower emissions. In their survey experiment, they include fuel efficiency of differently fuelled car types and add varying usage-dependent and annual charges to represent the link to potential emission surcharges such as road pricing and find that both surcharges have a significant role in modifying vehicle purchase decisions (Beck et al., Citation2011).
4.4. Sociodemographic determinants
shows how socioeconomic characteristics, such as income, education, gender, and age correlate with BEV acceptance. Sociodemographic differences regarding BEV acceptance have been included in 54 studies. Individuals more accepting of BEV are on average different compared to the general population. Namely, they have a higher income, are better educated, and tend to be younger. Additionally, males are in tendency more accepting of BEVs, though these findings are contested.
Figure 7. Effect of sociodemographic attitudes on BEV acceptance.
Note: This figure summarises studies reporting results on the respective facilitators of BEV acceptance. The effect direction indicates the number of studies reporting significant effects (“negative”,< “b>positive”) or non-significant effects (“none”) on BEV acceptance. For gender, female was chose as the baseline category thus indicating that, for example, negative effects mean that females have lower BEV acceptance. Color-codes indicate experimental or non-experimental study design.
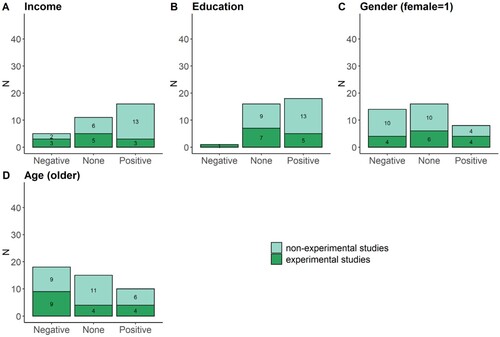
Overall, the evidence regarding sociodemographic determinants is quite mixed. Regarding age, Tran, Banister, Bishop, and McCulloch (Citation2013), based on surveys for the EU and U.S., show early BEV adopters to be predominantly middle-aged males with a high education and high income. These results are supported by various surveys focusing on early adopters. Specifically, results show that BEV owners are predominantly highly educated middle-aged men (Hidrue et al., Citation2011; Trommer, Jarass, & Kolarova, Citation2015).
Individuals more accepting of BEVs tend to have a higher income than their country's average (Trommer et al., Citation2015). Several studies also observe an income effect: individuals with higher income are less price-sensitive than others (Hackbarth & Madlener, Citation2013; Hess et al., Citation2012; Mabit & Fosgerau, Citation2011). However, in a study with U.S. respondents, Hidrue et al. (Citation2011) found no evidence that a higher income increased respondents’ likelihood of being BEV-oriented and, in fact, even reduced the likelihood of purchasing a BEV.
Individuals with higher education tend to place a higher value on protecting the environment which could explain why they exhibit stronger BEV acceptance (Sovacool, Kester, Noel, & de Rubens, Citation2018). These findings are also in line with several studies concluding that a higher level of education makes individuals more likely to purchase a BEV (Carley et al., Citation2013; Hackbarth & Madlener, Citation2013; Hidrue et al., Citation2011).
The results regarding gender are ambiguous. The studied papers predominantly approach a binary gender definition and none of the included studies has obtained effect for any other (e.g. non-binary, agender) gender category. Generally, women appear to be less accepting of BEVs. However, these findings might be driven by some additional variables, such as technology interest, that were not controlled for in most of the respective surveys. Gender has been found to affect BEV acceptance in four ways: via travel patterns, environmental values, differences in transport mode choice preferences, and via gender roles (Sovacool et al., Citation2018). In a study conducted by Berkeley et al. (Citation2018), women appear to be more sceptical regarding how reliable BEV technology and infrastructure are and whether it will be ready for usage soon. However, the authors state that this finding might be linked to general technology interest and vehicle technology in particular (Berkeley et al., Citation2018).
4.5. Attitudes and behavior
summarises the results for individual attitudes and behaviour that studies report as affecting BEV acceptance. We identified individual travel demand, meaning how much respondents travel for private and business reasons. Also, the number of vehicles per household was identified to affect BEV acceptance. Regarding individual attitudes, there are two concepts frequently addressed when studying BEV acceptance: first, how much an individual is generally in favour of (new) technologies and second, how important the protection of the climate and environment are to an individual.
Figure 8. Effect of individual attitudes and behaviour on BEV acceptance.
Note: This figure summarises reporting results on the respective facilitators of BEV acceptance. The effect direction indicates the number of studies reporting significant effects (“negative”,< “b>positive”) or non-significant effects (“none”) on BEV acceptance. For example, technology-affine individuals (“positive”) have a higher BEV acceptance. Color-codes indicate experimental or non-experimental study design.
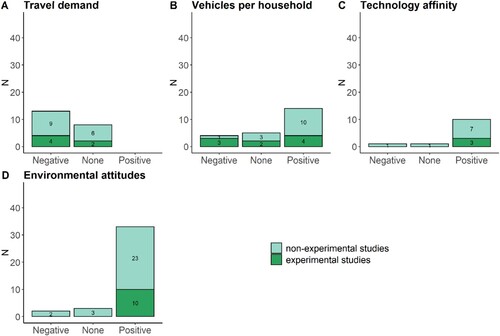
In tendency, higher travel demand – mostly measured by the annual kilometers/miles travelled by car – appears to harm BEV acceptance. The interpretation of this effect usually is that individuals with less annually travelled distance by car also assign a lower importance to high driving range (Hoen & Koetse, Citation2014).
Also, more cars per household can decrease range anxieties (Jakobsson, Gnann, Plötz, Sprei, & Karlsson, Citation2016; Karlsson, Citation2017; Tamor & Milačić, Citation2015). For example, Jensen et al. (Citation2013) found in their stated preference survey among 369 Danish respondents that driving range concerns are substantially lower in households owning more than one car. The rationale is that these households do not only rely solely on a BEVs as they have one or more conventional cars for longer trips (or as backup). In contrast, Hidrue et al. (Citation2011) found in a stated preference survey among 3029 U.S. respondents that multi-car households were less likely to be oriented towards BEVs. However, the results appear to be highly context-dependent: while the number of vehicles per household is important in Canada (Axsen, Goldberg, & Bailey, Citation2016), Denmark (Jensen et al., Citation2013) and Austria (Priessner, Sposato, & Hampl, Citation2018), it appears to be not so much the case according to findings for the USA (Javid & Nejat, Citation2017; Nazariadli, Morais, Barbieri, & Smith, Citation2018). However, there are also studies showing a positive effect of multi-car households (Lee, Hardman, & Tal, Citation2019) in the U.S., which may also be explained by confounding factors such as environmental consciousness of participants that may drive these results.
33 of 38 studies find that individuals’ environmental attitudes are positively correlated with BEV acceptance. The reported negative and null effects can predominantly be explained by the diversely discussed impact of BEVs already elaborated on in the section on environmental impacts. For example, Jensen et al. (Citation2013) found a positive relationship between preference for BEVs and environmental attitudes. Results from a survey by Carley et al. (Citation2013) among 2303 U.S. respondents show that early BEV adopters are likely to be environmentally friendly. Hidrue et al. (Citation2011) found in their survey that their 3029 U.S. respondents value pollution reduction when purchasing cars. However, the magnitude of this effect is substantially smaller compared to, for example, how respondents assess the importance of car performance.
4.6. BEV-Specific experience
The concept of knowledge refers to how much individuals know about BEVs’ potential benefits and differences to other car types, such as Hybrid Electric Vehicles and is also closely related to the ability (introduced by interest) to memorise facts about BEVs. For example, awareness of market availability could be measured by whether respondents would be able to identify a BEV on the street. Familiarity (also referred to as experience) refers to having driving experience with (or owning) a BEV. shows how experience with BEVs may affect BEV acceptance.
Figure 9. Effect of BEV-specific experience on BEV acceptance.
Note: This figure summarises reporting results on the respective facilitators of BEV acceptance. The effect direction indicates the number of studies reporting significant effects (“negative”,< “b>positive”) or non-significant effects (“none”) on BEV acceptance. Color-codes indicate experimental or non-experimental study design.
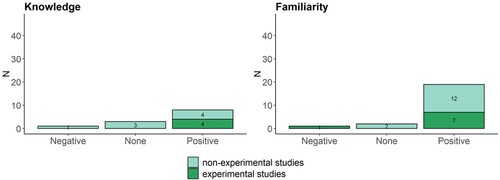
Several studies find that knowledge and familiarity matter for stated interest in BEVs (Burgess, King, Harris, & Lewis, Citation2013; Bühler, Cocron, Neumann, Franke, & Krems, Citation2014; Egbue & Long, Citation2012; Graham-Rowe et al., Citation2012; Jensen et al., Citation2013; Peters & Dütschke, Citation2014; Plötz, Schneider, Globisch, & Dütschke, Citation2014; Schmalfuß et al., Citation2017). In 8 out of 12 studies, higher knowledge about BEVs leads to higher BEV acceptance. In China, Wang et al. (Citation2018) surveyed 230 respondents using confirmatory factor analysis. They found a significant positive relationship between knowledge about BEVs and their perceived usefulness, which in the end, makes it more likely that respondents adopt BEVs. Krause, Carley, Lane, and Graham (Citation2013) found in a survey among 2302 U.S. respondents that almost two-thirds answered questions about BEVs incorrectly. In addition, 75% of respondents underestimated the advantages of BEVs (Krause et al., Citation2013). Zhang, Yu, and Zou (Citation2011) arrived at similar findings in their stated preference experiment among 299 Chinese consumers. Overall, these studies show that individuals might be biased against BEVs due to misperceptions and information deficiencies.
16 of 18 studies find that higher familiarity and experience with BEVs affect BEV acceptance positively. Larson et al. (Citation2014) find in a survey among 240 Canadian consumers that individuals with experience or exposure to BEVs differ from the general population and are willing to pay more for BEVs. However, these findings are not only limited to BEV experience. For example, some studies also found that experience with an Hybrid Electric Vehicles is strongly related with individuals’ interest in potentially purchasing a BEV (Carley et al., Citation2013; Hidrue et al., Citation2011).
Direct experience with BEVs may help in reducing range anxiety. Franke and Krems (Citation2013) found in a quasi-experiment among 40 German respondents that their range anxiety decreased after test driving a BEV. In contrast, Jensen et al. (Citation2013) found that individuals who drove a BEV for three months almost double their estimate of BEV driving range. However, other studies show that BEV experience does not affect the relation of BEV acceptance and environmental attitudes (Jensen et al., Citation2013). Finally, the general population appears only to have low awareness of BEV charging availability. However, individuals aware of charging infrastructure tend also to have higher BEV acceptance (Bailey, Miele, & Axsen, Citation2015).
4.7. Social determinants
summarises the findings for how social determinants affect BEV acceptance. Norms refer to personal as well as social norms. The neighbourhood effect refers to how much an individual is affected by the (perceived) BEV acceptance and ownership of people living within their neighbourhood – being either an indirect effect (e.g. social pressure to buy a BEV) or direct (e.g. experience by neighbours), but is usually measured by the mere amount of BEVs in respondents neighbourhoods. The direct effect is also known as word of mouth, referring to direct personal communication between consumers within a social environment. However, we distinguish between the two concepts because there are two not entirely distinguishable explanations for neighbourhood effects.
Figure 10. Effect of social determinants on BEV acceptance.
Note: This figure summarises reporting results on the respective facilitators of BEV acceptance. The effect direction indicates the number of studies reporting significant effects (“negative”,< “b>positive”) or non-significant effects (“none”) on BEV acceptance. Color-codes indicate experimental or non-experimental study design.
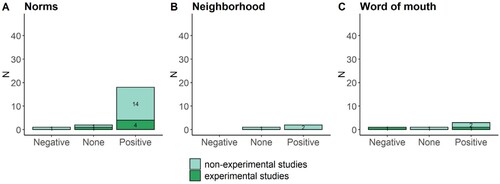
Overall, the three facilitators discussed here are generally found to positively affect BEV acceptance, although survey research on neighbourhood effects and word-of-mouth effects is scarce. Both neighbourhood and word-of-mouth research thereby predominantly shows a positive effect of a) more BEVs in direct proximity (e.g. the neighbourhood), and b) (positive) personal communication of BEVs among consumers.
In addition, both social and individual norms so far have been studied only with the assumption of positive effects on BEV acceptance, thus resulting in 18 out of 21 studies showing positive correlations between the two concepts. In a survey conducted in Germany, Barth et al. (Citation2016) found that consumers’ social norms and views of collective efficacy can predict a person’s general acceptance of BEVs. In their survey among individuals in San Diego, California, who had recently purchased a new car, Axsen and Kurani (Citation2013) found that interest in BEVs correlates with the belief that the public associates these vehicles with intelligence, responsibility, environmental protection, and support of the nation. The authors also observed that interpersonal influence from individuals’ social and professional networks was prone to affect views on BEVs.
In addition to the findings synthesised so far in this section, we assessed how congruent those findings are for studies that provide replication data and those that do not. The results for the 21 determinants classified into the seven overarching categories are displayed in Figures A1-A7 in the appendix. We could not detect any clear patterns based on whether the study materials were available or not. However, it is important to note that this finding should not be interpreted in the sense that replicability is unimportant because we cannot detect significant differences between replicable and non-replicable studies.
5. Conclusion
This paper aimed to identify what existing research knows about BEV acceptance by following two overarching research questions: (1) How reliable are these studies on BEV acceptance regarding replicability, generalizability, and survey design? (2) What facilitators affect consumers’ preferences regarding BEV acceptance? Following this approach allows us to both assess and summarise existing knowledge on BEV acceptance and at the same time also evaluate the quality of existing research and thus its reliability.
Our analysis points to rather severe limitations to what we know about BEV acceptance. To start with, there are fewer studies on the subject than we initially assumed. 94 peer-reviewed scientific articles is very little considering the policy-relevance of the issue, the enormous decarbonisation potential through a transition from ICEV to BEV use, and the economic size of the actual and potential global market for BEVs. The global skewdness is also striking but could be partially explained by our choice to only look at articles written in English (REFERENCE). There is, of course, much additional published work on BEV acceptance that we may have excluded from our literature assessment for the specific decade.
Furthermore, at the bottom of the proverbial “research iceberg” may be a lot of company-internal marketing research on BEV acceptance. However, we are unable to assess the amount and quality of this research. Hence, we did what is commonly done for such assessments, e.g. by the Intergovernmental Panel on Climate Change (Citation2018), which is to rely on peer-reviewed academic publications. However, we strongly suspect that the grey literature and non-published work on the subject are very unlikely to be superior to the 94 studies in our sample in terms of data quality and methodological rigour.
Many of the 94 studies we focus on have severe limitations. The first is that many studies generalise on consumers or citizens per se, or individuals in a given country at a specific time. As we show in detail in appendix A2, however, many studies do not rely on representative population samples from which inferences are drawn. Related to this, many studies do not indicate response rates or the specific population from which they were sampling. Such information is commonly needed for assessing common survey errors, such as coverage errors or selection biases.
The second limitation is that very few studies are based on samples from more than one country and one point in time. Moreover, the substantial heterogeneity of survey items and study designs does not allow for rigorous comparison of results across countries. However, it still allows for a synthesis of findings for particular facilitators of BEV acceptance, as reported in this paper. We suggest researchers to submit their survey items to databases where they can be cited and reused.
The third limitation (of previous studies) is the absence of causal identification of facilitators for BEV acceptance, all else equal. Survey-embedded experiments or field experiments are the gold standards for this, to the extent that experimental manipulation of specific potential facilitators is feasible (one exception, for instance, is gender). Many of the studies we assessed are entirely correlational. Even with the best effort to control confounding variables and the best statistical method available, this cannot solve confounding problems through unobservable and complex interaction effects between different potential facilitators.
The fourth limitation, which was also quite surprising to us, concerns replication. For very few studies replication data was openly available to begin with. For many studies, authors were not willing or able to make such data available without severe constraints for use. And for some other studies, authors did not respond or could not be reached. Of course, we cannot conclude that non-replicable studies are of lower quality. Nevertheless, from a scientific viewpoint, we can conclude that we cannot say how reliable the respective results are because they cannot be replicated independently from the authors.
Besides these limitatios, our assessment also points to some facilitators that have fairly consistent effects on BEV acceptance in different study contexts. Predominantly positive facilitators that can potentially foster BEV acceptance include, for instance, high technology affinity, policy incentives, the overarching positive environmental impact and environmental-friendly attitudes, familiarity and experience with BEVs, and social norms. Contrarily, several factors were identified to affect BEV acceptance negatively, be it – compared to conventional cars – limited motor power, lower driving range, (perceived) higher purchase and operational costs, long charging time, low market availability of different car models, or insufficient charging availability. For various presumed facilitators, however, existing research has produced ambiguous evidence. Such facilitators include, for instance, reliability, the number of vehicles per household, income, education, gender, age, and travel demand. Other potential facilitators are only based on few studies, thus not allowing for a final assessment. These include fuel efficiency, resale value, knowledge, neighbourhood effects, and word of mouth.
Overall, a higher driving range, more available charging infrastructure, lower prices, and pro-environmental attitudes are among the most frequently discussed facilitators of BEV acceptance with highly robust effect directions across the literature. However, our review also points to some somewhat ambivalent and mixed results regarding effect directions for some facilitators, namely vehicles per household, travel demand, and generally sociodemographic characteristics. These equivocal findings could be the possibility that these individual characteristics might be correlated with other BEV acceptance facilitators, thus skewing these results. This calls for further studies on the specific causal mechanisms that condition experimental methods. Similarly, our overview points to a few studies indicating rather unexpected effect directions, for example, adverse effects of driving range, market availability, environmental attitudes, and knowledge. Possible reasons are that these results are highly context-dependent and may also depend on the specific survey framing. However, assessing these framing effects is difficult as data and survey instruments are predominantly not accessible for validation for the identified studies. For example, individuals with high environmental concerns could potentially be unfavourable against any form of individual motorised transport. Similarly, the driving range could be of lower importance depending on the context, as the annual driving range differs highly depending on country of residence or settlement density. Still, the studies pointing to such unexpected results are predominantly based on non-experimental methods and often rely on non-probability based samples, thus potentially indicating methodological flaws.
The literature review at hand and its focus also have some limitations. First, this paper focuses on the consumer perspective and how (perceived) facilitators affect BEV acceptance. This review does thus not directly look at how the producer side, e.g. industry, and politics may affect BEV uptake by directly addressing the discussed consumer barriers or other, non-related facilitators beyond the scope of this paper. Second, our focus on the 10-year timespan covering the years 2010–2019 excludes publications published afterwards. While this literature is still growing and also improving on scientifically sound research designs and replicability, our findings are still eminent regarding a necessary improvement of the applied scientific approaches. Third, the search strings used may not have fully identified all relevant studies, resulting in potential exclusion of relevant publications. This is also displayed in the unequal distribution of papers identified through search engines (N = 43) and papers added (N = 153) after snowballing. This may have been prevented by including additional strings such as study, preference, attitudes, or purchase. However, we are confident that we have been able to identify all relevant publications within the respective timespan by applying backwards and forward snowballing. Fourth, while using English keywords may also lead to papers with English abstracts and written in another language, we haven’t found any, although we did not deliberately exclude them. Still, only working with English search strings has likely excluded most of the non-English publications, thus potentially resulting in a bias towards Anglophone research.
Overall, the identified limitations of existing research require internationally concerted efforts to develop more homogenous study designs that can be implemented in a wide range of different countries with representative samples from the general population or parts thereof, and at several points in time. Such study designs should rely to a more considerable degree on survey and field experiments in order to be able to identify the causal effects of particular facilitators on BEV acceptance. Finally, pre-registered study designs and (anonymized) raw data should be made publicly available, including questionnaires and used scales.
Supplemental Material
Download Zip (1.3 MB)Acknowledgments
The research for this article was funded by the “Energieforschung Stadt Zürich” and supported by an ETH Zurich ISTP Research Incubator Grant. We are grateful to Mirjam Grünholz for valuable research assistance.
Disclosure statement
No potential conflict of interest was reported by the author(s).
Additional information
Funding
Notes
1 For the exact email wording, see Appendix A1.
2 We did find contact modes for all first or corresponding authors. However, it was not always clear whether the provided contact addresses were still in use and whether the sent emails were actually read.
3 Some authors stated that a contract due to data disclosure agreements would need to be signed if we wanted to get access to their data. Thus, they were in principal willing to share the data if we would agree to sign a contract with them as well. We thus coded such data as “available on request”.
References
- Ajanovic, A., & Haas, R. (2016). Dissemination of electric vehicles in urban areas: Major factors for successDissemination of electric vehicles in urban areas : Major factors for success. Energy, 115, doi:10.1016/j.energy.2016.05.040
- Almeida Neves, S., Cardoso Marques, A., & Alberto Fuinhas, J. (2019). Technological progress and other factors behind the adoption of electric vehicles: Empirical evidence for EU countries. Research in Transportation Economics, 74, 28–39. doi:10.1016/j.retrec.2018.12.001
- Anable, J., Brand, C., Tran, M., & Eyre, N. (2012). Modelling transport energy demand: A socio-technical approach. Energy Policy, 41, 125–138. doi:10.1016/j.enpol.2010.08.020
- Andor, M. A., Gerster, A., Gillingham, K. T., & Horvath, M. (2020). Running a car costs much more than people think — stalling the uptake of Green travel. Nature, 580(7804), 453–455. doi:10.1038/d41586-020-01118-w
- Axsen, J., Goldberg, S., & Bailey, J. (2016). How might potential future plug-in electric vehicle buyers differ from current “pioneer” owners? Transportation Research Part D: Transport and Environment, 47, 357–370. doi:10.1016/j.trd.2016.05.015
- Axsen, J., & Kurani, K. S. (2013). Hybrid, plug-in hybrid, or electric-What do car buyers want? Energy Policy, 61, 532–543. doi:10.1016/j.enpol.2013.05.122
- Bailey, J., Miele, A., & Axsen, J. (2015). Is awareness of public charging associated with consumer interest in plug-in electric vehicles? Transportation Research Part D: Transport and Environment, 36, 1–9. doi:10.1016/j.trd.2015.02.001
- Barth, M., Jugert, P., & Fritsche, I. (2016). Still underdetected – Social norms and collective efficacy predict the acceptance of electric vehicles in Germany. Transportation Research Part F: Traffic Psychology and Behaviour, 37, 64–77. doi:10.1016/j.trf.2015.11.011
- Beck, M. J., Rose, J. M., & Hensher, D. A. (2011). Behavioural responses to vehicle emissions charging. Transportation, 38(3), 445–463. doi:10.1007/s11116-010-9316-7
- Berkeley, N., Jarvis, D., & Jones, A. (2018). Analysing the take up of battery electric vehicles: An investigation of barriers amongst drivers in the UK. Transportation Research Part D: Transport and Environment, 63, 466–481. doi:10.1016/j.trd.2018.06.016
- Bockarjova, M., & Steg, L. (2014). Can protection motivation theory predict pro-environmental behavior? Explaining the adoption of electric vehicles in the Netherlands. Global Environmental Change, 28(1), 276–288. doi:10.1016/j.gloenvcha.2014.06.010
- Brückmann, G., & Bernauer, T. (2020). What drives public support for policies to enhance electric vehicle adoption? Environmental Research Letters, 15(9), 94002. doi:10.1088/1748-9326/ab90a5
- Bühler, F., Cocron, P., Neumann, I., Franke, T., & Krems, J. F. (2014). Is EV experience related to EV acceptance? Results from a German field study. Transportation Research Part F: Traffic Psychology and Behaviour, 25(PART A), 34–49. doi:10.1016/j.trf.2014.05.002
- Burgess, M., King, N., Harris, M., & Lewis, E. (2013). Electric vehicle drivers’ reported interactions with the public: Driving stereotype change? Transportation Research Part F: Traffic Psychology and Behaviour, 17, 33–44. doi:10.1016/j.trf.2012.09.003
- Camerer, C. F., Dreber, A., Forsell, E., Ho, T.-H., Huber, J., Johannesson, M., … Chan, T. (2016). Evaluating replicability of laboratory experiments in economics. Science, 351(6280), 1433–1436. doi:10.1126/science.aaf0918
- Carley, S., Krause, R. M., Lane, B. W., & Graham, J. D. (2013). Intent to purchase a plug-in electric vehicle: A survey of early impressions in large US cites. Transportation Research Part D: Transport and Environment, 18, 39–45. doi:10.1016/j.trd.2012.09.007
- Choi, H., Shin, J., & Woo, J. R. (2018). Effect of electricity generation mix on battery electric vehicle adoption and its environmental impact. Energy Policy, 121, 13–24. doi:10.1016/j.enpol.2018.06.013
- Chorus, C. G., Koetse, M. J., & Hoen, A. (2013). Consumer preferences for alternative fuel vehicles: Comparing a utility maximization and a regret minimization model. Energy Policy, 61, 901–908. doi:10.1016/j.enpol.2013.06.064
- Coffman, M., Bernstein, P., & Wee, S. (2017). Electric vehicles revisited: A review of factors that affect adoption. Transport Reviews, 37(1), 79–93. doi:10.1080/01441647.2016.1217282
- Creutzig, F., Jochem, P., Edelenbosch, O. Y., Mattauch, L., van Vuuren, D. P., McCollum, D., & Minx, J. (2015). Transport: A roadblock to climate change mitigation? Science, 350(6263), 911 LP–911912. doi:10.1126/science.aac8033
- Daramy-Williams, E., Anable, J., & Grant-Muller, S. (2019). A systematic review of the evidence on plug-in electric vehicle user experience. Transportation Research Part D: Transport and Environment, 71, 22–36. doi:10.1016/j.trd.2019.01.008
- Egbue, O., & Long, S. (2012). Barriers to widespread adoption of electric vehicles: An analysis of consumer attitudes and perceptionsBarriers to widespread adoption of electric vehicles : An analysis of consumer attitudes and perceptions. Energy Policy, 48(September 2012), 717–729. doi:10.1016/j.enpol.2012.06.009
- Fanelli, D. (2010). “Positive” results increase down the hierarchy of the sciences. PloS One, 5(4), e10068. doi:10.1371/journal.pone.0010068
- Franke, T., & Krems, J. F. (2013). Understanding charging behaviour of electric vehicle users. Transportation Research Part F: Traffic Psychology and Behaviour, 21, 75–89. doi:10.1016/j.trf.2013.09.002
- Fuglestvedt, J., Berntsen, T., Myhre, G., Rypdal, K., & Skeie, R. B. (2008). Climate forcing from the transport sectors. Proceedings of the National Academy of Sciences, 105(2), 454–458. doi:10.1073/pnas.0702958104
- Graham-Rowe, E., Gardner, B., Abraham, C., Skippon, S., Dittmar, H., Hutchins, R., & Stannard, J. (2012). Mainstream consumers driving plug-in battery-electric and plug-in hybrid electric cars: A qualitative analysis of responses and evaluations. Transportation Research Part A: Policy and Practice, 46(1), 140–153. doi:10.1016/j.tra.2011.09.008
- Hackbarth, A., & Madlener, R. (2013). Consumer preferences for alternative fuel vehicles: A discrete choice analysis. Transportation Research Part D: Transport and Environment, 25, 5–17. doi:10.1016/j.trd.2013.07.002
- Hardman, S., Jenn, A., Tal, G., Axsen, J., Beard, G., Daina, N., … Witkamp, B. (2018). A review of consumer preferences of and interactions with electric vehicle charging infrastructure. Transportation Research Part D: Transport and Environment, 62, 508–523. doi:10.1016/j.trd.2018.04.002
- Helveston, J. P., Liu, Y., Feit, E. M. D., Fuchs, E., Klampfl, E., & Michalek, J. J. (2015). Will subsidies drive electric vehicle adoption? Measuring consumer preferences in the U.S. and China. Transportation Research Part A: Policy and Practice, 73, 96–112. doi:10.1016/j.tra.2015.01.002
- Hess, S., Fowler, M., Adler, T., & Bahreinian, A. (2012). A joint model for vehicle type and fuel type choice: Evidence from a cross-nested logit study. Transportation, 39(3), 593–625. doi:10.1007/s11116-011-9366-5
- Hidrue, M. K., Parsons, G. R., Kempton, W., & Gardner, M. P. (2011). Willingness to pay for electric vehicles and their attributes. Resource and Energy Economics, 33(3), 686–705. doi:10.1016/j.reseneeco.2011.02.002
- Hoekstra, A. (2019). The underestimated potential of battery electric vehicles to reduce emissions. Joule, 3(6), 1412–1414. doi:10.1016/j.joule.2019.06.002
- Hoen, A., & Koetse, M. J. (2014). A choice experiment on alternative fuel vehicle preferences of private car owners in the Netherlands. Transportation Research Part A: Policy and Practice, 61, 199–215. doi:10.1016/j.tra.2014.01.008
- Howey, D. A. (2012). A challenging future for cars. Nature Climate Change, 2(1), 28. doi:10.1038/nclimate1336
- Huber, R. A., & Wicki, M. (2021). What explains citizen support for transport policy? The roles of policy design, trust in government and proximity among Swiss citizens. Energy Research & Social Science, 75, 101973. doi:10.1016/j.erss.2021.101973
- International Energy Agency. (2020). Data and statistics.
- IPCC, 2018: Summary for Policymakers. (2018). Summary for policymakers. In V. Masson-Delmotte, P. Zhai, H. O. Pörtner, D. Roberts, J. Skea, P. R. Shukla, A. Pirani, W. Moufouma-Okia, C. Péan, R. Pidcock, S. Connors, J. B. R. Matthews, Y. Chen, X. Zhou, M. I. Gomis, E. Lonnoy, T. Maycock, M. Tignor, & T. Waterfield (Eds.), Global warming of 1.5°C. An IPCC special report on the impacts of global warming of 1.5°C above pre-industrial levels and related global greenhouse gas emission pathways, in the context of strengthening the global response to the threat of climate change (pp. 32). Geneva, Switzerland: World Meteorological Organization. http://www.ipcc.ch/report/sr15/
- Jakobsson, N., Gnann, T., Plötz, P., Sprei, F., & Karlsson, S. (2016). Are multi-car households better suited for battery electric vehicles? – driving patterns and economics in Sweden and Germany. Transportation Research Part C: Emerging Technologies, 65, 1–15. doi:10.1016/j.trc.2016.01.018
- Jalali, S., & Wohlin, C. (2012). Systematic literature studies: Database searches vs. backward snowballing. International Symposium on Empirical Software Engineering and Measurement, 2012, 29–38. doi:10.1145/2372251.2372257.
- Javid, R. J., & Nejat, A. (2017). A comprehensive model of regional electric vehicle adoption and penetration. Transport Policy, 54, 30–42. doi:10.1016/j.tranpol.2016.11.003
- Jensen, A. F., Cherchi, E., & Mabit, S. L. (2013). On the stability of preferences and attitudes before and after experiencing an electric vehicle. Transportation Research Part D: Transport and Environment, 25, 24–32. doi:10.1016/j.trd.2013.07.006
- Karlsson, S. (2017). What are the value and implications of two-car households for the electric car? Transportation Research Part C: Emerging Technologies, 81, 1–17. doi:10.1016/j.trc.2017.05.001
- Kempton, W. (2016). Electric vehicles: Driving range. Nature Energy, 1(9), 1–2. doi:10.1038/nenergy.2016.131
- Koppelaar, R., & Middelkoop, W. (2017). The Tesla revolution : Why big oil is losing the energy war. Amsterdam: Amsterdam University Press B.V..
- Kormos, C., Axsen, J., Long, Z., & Goldberg, S. (2019). Latent demand for zero-emissions vehicles in Canada (part 2): Insights from a stated choice experiment. Transportation Research Part D: Transport and Environment, 67, 685–702. doi:10.1016/j.trd.2018.10.010
- Krause, R. M., Carley, S. R., Lane, B. W., & Graham, J. D. (2013). Perception and reality: Public knowledge of plug-in electric vehicles in 21 U.S. Cities. Energy Policy, 63(2013), 433–440. doi:10.1016/j.enpol.2013.09.018
- Kurani, K. S., Axsen, J., & Caperello, N. (2009). UC Davis Recent Work Title Learning from Consumers: Plug-In Hybrid Electric Vehicle (PHEV) Demonstration and Consumer Education, Outreach, and Market Research Program Permalink https://escholarship.org/uc/item/9361r9h7 Publication Date.
- Lane, B., & Potter, S. (2007). The adoption of cleaner vehicles in the UK: Exploring the consumer attitude-action gap. Journal of Cleaner Production, 15(11–12), 1085–1092. doi:10.1016/j.jclepro.2006.05.026
- Larson, P. D., Viáfara, J., Parsons, R. V., & Elias, A. (2014). Consumer attitudes about electric cars: Pricing analysis and policy implications. Transportation Research Part A: Policy and Practice, 69, 299–314. doi:10.1016/j.tra.2014.09.002
- Lee, J. H., Hardman, S. J., & Tal, G. (2019). Who is buying electric vehicles in california? Characterising early adopter heterogeneity and forecasting market diffusion. Energy Research & Social Science, 55, 218–226. doi:10.1016/j.erss.2019.05.011
- Lelieveld, J., Evans, J. S., Fnais, M., Giannadaki, D., & Pozzer, A. (2015). The contribution of outdoor air pollution sources to premature mortality on a global scale. Nature, 525(7569), 367. doi:10.1038/nature15371
- Li, W., Long, R., Chen, H., & Geng, J.. (2017). A review of factors influencing consumer intentions to adopt battery electric vehicles. Renewable and Sustainable Energy reviews, 78, 318–328. doi:10.1016/j.rser.2017.04.076
- Liao, F., Molin, E., & van Wee, B. (2017). Consumer preferences for electric vehicles: A literature review. Transport Reviews, 37(3), 252–275. doi:10.1080/01441647.2016.1230794
- Liberman, N., Trope, Y., & Stephan, E. (2007). Psychological distance. In E. T. Higgins, & A. W. Kruglanski (Eds.), Social psychology: Handbook of basic principles (pp. 353–381). New York: The Guilford Press.
- Mabit, S. L., & Fosgerau, M. (2011). Demand for alternative-fuel vehicles when registration taxes are high. Transportation Research Part D: Transport and Environment, 16(3), 225–231. doi:10.1016/j.trd.2010.11.001
- Mills, N. L., Donaldson, K., Hadoke, P. W., Boon, N. A., MacNee, W., Cassee, F. R., … Newby, D. E. (2009). Adverse cardiovascular effects of air pollution. Nature Reviews Cardiology, 6(1), 36.
- Moher, D., Liberati, A., Tetzlaff, J., & Altman, D. G. (2009). Preferred reporting items for systematic reviews and meta-analyses: The PRISMA statement. PLoS Medicine, 6(7), e1000097. doi:10.1371/journal.pmed.1000097
- Moro, A., & Lonza, L. (2018). Electricity carbon intensity in european member states: Impacts on GHG emissions of electric vehicles. Transportation Research Part D: Transport and Environment, 64, 5–14. doi:10.1016/j.trd.2017.07.012
- Musti, S., & Kockelman, K. M. (2011). Evolution of the household vehicle fleet: Anticipating fleet composition, PHEV adoption and GHG emissions in Austin, texas. Transportation Research Part A: Policy and Practice, 45(8), 707–720. doi:10.1016/j.tra.2011.04.011
- Nazariadli, S., Morais, D. B., Barbieri, C., & Smith, J. W. (2018). Dynamic household vehicle decision modeling considering plug-In electric vehicles. Transportation Research Record, 2672(49), 91–100. doi:10.1177/0361198118796925
- Nejat, P., Jomehzadeh, F., Taheri, M. M., Gohari, M., & Majid, M. Z. A. (2015). A global review of energy consumption, CO2 emissions and policy in the residential sector (with an overview of the top ten CO2 emitting countries). Renewable and Sustainable Energy Reviews, 43, 843–862. doi:10.1016/j.rser.2014.11.066
- Nieuwenhuijsen, M. J. (2018). Influence of urban and transport planning and the city environment on cardiovascular disease. Nature Reviews Cardiology, 15(7), 432–438. doi:10.1038/s41569-018-0003-2
- Peters, A., & Dütschke, E. (2014). How do Consumers Perceive Electric Vehicles? A Comparison of German Consumer Groups. Journal of Environmental Policy & Planning, 16(3), 359–377. doi:10.1080/1523908X.2013.879037
- Plötz, P., Schneider, U., Globisch, J., & Dütschke, E. (2014). Who will buy electric vehicles? Identifying early adopters in Germany. Transportation Research Part A: Policy and Practice, 67, 96–109. doi:10.1016/j.tra.2014.06.006
- Priessner, A., Sposato, R., & Hampl, N. (2018). Predictors of electric vehicle adoption: An analysis of potential electric vehicle drivers in Austria. Energy Policy, 122, 701–714. doi:10.1016/j.enpol.2018.07.058
- Rangaraju, S., De Vroey, L., Messagie, M., Mertens, J., & Van Mierlo, J. (2015). Impacts of electricity mix, charging profile, and driving behavior on the emissions performance of battery electric vehicles: A Belgian case study. Applied Energy, 148, 496–505. doi:10.1016/j.apenergy.2015.01.121
- Rezvani, Z., Jansson, J., & Bodin, J. (2015). Advances in consumer electric vehicle adoption research: A review and research agenda. Transportation Research Part D: Transport and Environment, 34, 122–136. doi:10.1016/j.trd.2014.10.010
- Rockström, J., Gaffney, O., Rogelj, J., Meinshausen, M., Nakicenovic, N., & Schellnhuber, H. J. (2017). A roadmap for rapid decarbonization. Science, 355(6331), 1269–1271. doi:10.1126/science.aah3443
- Rodrigue, J.-P., Comtois, C., & Slack, B. (2020). The geography of transport systems (Fifth Edition). London: Routledge.
- Schmalfuß, F., Mühl, K., & Krems, J. F. (2017). Direct experience with battery electric vehicles (BEVs) matters when evaluating vehicle attributes, attitude and purchase intention. Transportation Research Part F: Traffic Psychology and Behaviour, 46, 47–69. doi:10.1016/j.trf.2017.01.004
- She, Z. Y., Qing Sun, M., & Xie, J. J., & C, B. (2017). What are the barriers to widespread adoption of battery electric vehicles? A survey of public perception in tianjin, China. Transport Policy, 56, 29–40. doi:10.1016/j.tranpol.2017.03.001
- Skippon, S., & Garwood, M. (2011). Responses to battery electric vehicles: UK consumer attitudes and attributions of symbolic meaning following direct experience to reduce psychological distance. Transportation Research Part D: Transport and Environment, 16(7), 525–531. doi:10.1016/j.trd.2011.05.005
- Sovacool, B. K., Kester, J., Noel, L., & de Rubens, G. Z. (2018). The demographics of decarbonizing transport: The influence of gender, education, occupation, age, and household size on electric mobility preferences in the nordic region. Global Environmental Change, 52, 86–100. doi:10.1016/j.gloenvcha.2018.06.008
- Tamor, M. A., & Milačić, M. (2015). Electric vehicles in multi-vehicle households. Transportation Research Part C: Emerging Technologies, 56, 52–60. doi:10.1016/j.trc.2015.02.023
- Tran, M., Banister, D., Bishop, J. D. K., & McCulloch, M. D. (2013). Simulating early adoption of alternative fuel vehicles for sustainability. Technological Forecasting and Social Change, 80(5), 865–875. doi:10.1016/j.techfore.2012.09.009
- Trommer, S., Jarass, J., & Kolarova, V. (2015). Early adopters of electric vehicles in Germany unveiled. World Electric Vehicle Journal, 7(4), 722–732. doi:10.3390/wevj7040722
- Victor, D. G., Geels, F. W., & Sharpe, S. (2019). Accelerating the low carbon transition: The case for stronger, more targeted and coordinated international action. https://www.brookings.edu/wp-content/uploads/2019/12/Coordinatedactionreport.pdf.
- Wang, S., Wang, J., Li, J., Wang, J., & Liang, L. (2018). Policy implications for promoting the adoption of electric vehicles: Do consumer’s knowledge, perceived risk and financial incentive policy matter? Transportation Research Part A: Policy and Practice, 117, 58–69. doi:10.1016/j.tra.2018.08.014
- Wicki, M., Huber, R. A., & Bernauer, T. (2020). Can policy-packaging increase public support for costly policies? Insights from a choice experiment on policies against vehicle emissions. Journal of Public Policy, 40, 599–625. doi:10.1017/S0143814X19000205
- Woo, J. R., Choi, H., & Ahn, J. (2017). Well-to-wheel analysis of greenhouse gas emissions for electric vehicles based on electricity generation mix: A global perspective. Transportation Research Part D: Transport and Environment, 51, 340–350. doi:10.1016/j.trd.2017.01.005
- Zhang, Y., Yu, Y., & Zou, B. (2011). Analyzing public awareness and acceptance of alternative fuel vehicles in China: The case of EVAnalyzing public awareness and acceptance of alternative fuel vehicles in China : The case of EV. Energy Policy, 39(11), 7015–7024. doi:10.1016/j.enpol.2011.07.055
- Ziegler, A. (2012). Individual characteristics and stated preferences for alternative energy sources and propulsion technologies in vehicles: A discrete choice analysis for Germany. Transportation Research Part A: Policy and Practice, 46(8), 1372–1385. doi:10.1016/j.tra.2012.05.016