
ABSTRACT
The view that drivers have from the road can be enjoyable or disturbing, stressful or relaxing, distracting or fatiguing. Road planning guidelines balance aesthetical and safety considerations but are rarely grounded on empirical evidence. This paper reviews evidence on the effects of the roadside visual environment on the wellbeing and behaviour of drivers, focusing on natural and built elements external to the road, i.e. excluding road geometry, design, conditions, and users. Standardised information was extracted from 50 studies. These studies have used experiments involving participants watching videos or driving a simulator or instrumented vehicle, usually with unrepresentative samples (mostly males, young age groups, and students). Most evidence is related to the driving task (e.g. distraction, fatigue), not to wider aspects of driver wellbeing (e.g. stress recovery), and to safety issues, not aesthetical ones. There is increased evidence for monotonous views (linked to fatigue), roadside vegetation (linked mainly to a reduction of stress and risky driving behaviours, but depending on the characteristics of the vegetation) and advertisements (linked to distraction, but depending on advertisement type and other variables). A few studies have looked at other elements of the built environment (memorials, drones, wind turbines, utility poles), with mixed evidence on distraction and safety behaviour. The links between continued exposure to certain types of views and car commuter stress have not been studied. There is little evidence for developing countries or differences by gender, visual impairment, trip purpose, and type of vehicle.
1. Introduction
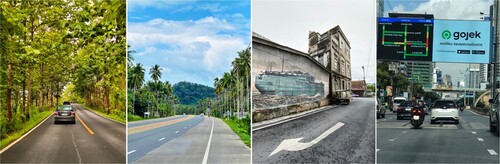
The view from the road is an important component of road travel (). Some trips are made precisely to enjoy the scenery, rather than to reach a destination (Hallo & Manning, Citation2009; Prideaux & Carson, Citation2010). Views contribute to the enjoyment of even non-leisure trips. However, some landscapes or roadside objects can be regarded as unpleasant and a source of visual clutter. Roadside landscapes and objects can also contribute to stressful or calming emotional states. In addition, they can cause distractions or induce sleepiness, potentially compromising safety and leading to collisions, injuries, and fatalities (Moradi et al., Citation2019; Young & Salmon, Citation2012). These factors are an important road planning issue, considering that an estimated 30–50% of drivers’ attention is aimed at objects that are not directly related to driving (Hughes & Cole, Citation1986).
Figure 1. The view from the road: examples.
Aesthetical considerations are a major component of road planning in scenic routes, which are sometimes managed as part of national-level programmes (e.g. National Scenic Routes in Norway, National Scenic Byways programme in the USA). Some governments have also produced guidelines about visual aspects of road planning, covering not only objective aspects, such as roadside landscaping, but also subjective aspects, such as diversity and duration of views and coherence in their sequences (Vägverket, Citation2004; Vegdirektoratet, Citation2014; Vejdirektoratet, Citation2002). However, as concluded in a review by Blumentrath and Tveit (Citation2014), these guidelines are not usually grounded on empirical evidence on the visual impacts on drivers.
There is also interest among planners about regulating visual clutter caused by roadside objects such as billboards. This is for example the main purpose of the Highway Beautification Act in the USA, which limits billboards to certain areas, subject to constraints on dimension and spacing (FHA, Citationn.d.). A survey among planners has also recommended as one of the main directions for future research the implementation of comprehensive studies of the safety risks that billboards pose for drivers (Dulebenets et al., Citation2018).
There is a long history of research into the cognitive aspects of the view from the road, studying how car users perceive visual elements as they appear in a sequence (Appleyard et al., Citation1964; Carr & Schissler, Citation1969). There are also many studies on the preferences of car users regarding roadside landscapes, usually finding they prefer natural landscapes (especially “green” and “blue” ones) to man-made ones (Froment & Domon, Citation2006; Wolf, Citation2006), and variety to monotony (Akbar et al., Citation2003). It is also known that the quality of roadside views affects road trip satisfaction (Denstadli & Jacobsen, Citation2011) and influence route choice for leisure trips (Alivand et al., Citation2015; Díez-Gutiérrez & Babri, Citation2020). These literatures cover what drivers perceive and prefer but not how they feel and behave when looking at the roadside visual environment.
This paper reviews evidence on the links between the roadside visual environment and driver wellbeing and behaviour. This encompasses aspects of general wellbeing (e.g. stress and stress recovery) and feelings and behaviour during the driving task (e.g. anger, frustration, distraction, fatigue, propensity to speed or disrespect regulations).
The review includes documents that:
Establish empirical links with driver wellbeing and behaviour. This excludes road design guidelines, statistical analyses of collisions, analyses of driver preferences and expert opinions, studies where drivers recall objects seen or self-assess risk, and models of travel behaviour (e.g. destination, mode, or route choice).
Focus on visual elements external to the road, located at the roadside and beyond. This excludes road geometry, design, condition, and users. shows examples of the elements included and excluded in the review, also illustrated in .
Figure 2. Scope of the review.
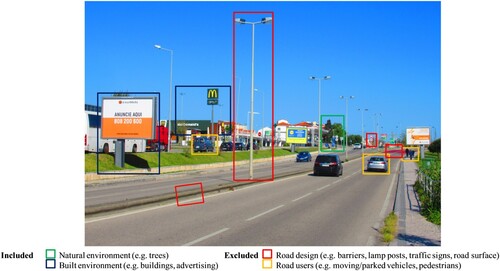
Table 1. Scope of the review.
We searched for documents in Scopus, PubMed, and TRID (to capture the general, health, and transport literatures, respectively). The search combined terms for subject (who views), object (what is viewed), location (from where), and outcome (on wellbeing or behaviour) (). shows the document selection process. The selected documents were first grouped into general studies comparing landscape types (Section 2 of the paper) and groups for each specific roadside element. Studies on roadside vegetation (Section 3) and advertisements (Section 4) were then assigned their own groups, given the number of studies found. The remaining studies deal with other roadside objects (Section 5).
Figure 3. Document selection process.
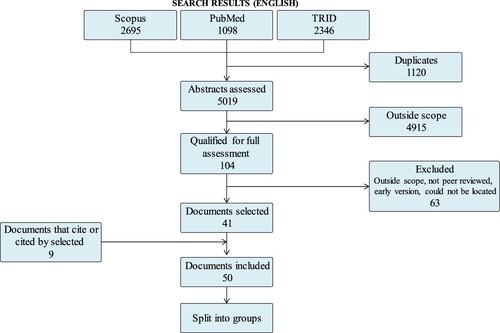
Table 2. Search terms.
Fifteen types of information were extracted from each study: authors, year, journal, type of road, type of area (urban, suburban, or rural; type of land use), country where evidence was obtained, roadside visual element, placement of that element (in relation to the road), type of outcome (on driver wellbeing or behaviour), data source, measures (of the outcome), method to analyse the links between visual element and outcome, sample size and number of scenarios or length of road per participant, sample balance (age, gender, occupation), and main findings (i.e. links between visual elements and outcomes).
The collection of standardised information allows the comparison of findings for each group of visual element and the identification of outstanding gaps and common methodological issues. The full results are shown in tables in appendices. The following four sections review those results, synthesising and assessing the information collected.
2. Landscape type
2.1. Search and selection results
Seven studies were selected about the effects of roadside landscape types, from safety and travel or environmental psychology/behaviour journals. The results of these studies were obtained in various countries, all upper-middle or high income. The table in Appendix 1 lists the 15 types of information extracted from the selected studies.
2.2. Visual aspects and their effects
The paper by Parsons et al. (Citation1998) remains the most influential study on this topic, cited regularly for almost 25 years. The study found that research participants who watched videos of drives on roads next to non-urban landscapes (forests or golf courses) recovered from a stressful event faster than those who watched urban landscapes (with commercial buildings), as measured by physiological measures. The conclusions are powerful, although they have the caveat that participants could think themselves either as the car driver or as a passenger.
Surprisingly, no studies have replicated this experiment, or used other methods, to measure the effects of different types of views on stress recovery of car drivers. Most of the studies citing Parsons et al. (Citation1998) analysed the general effect of landscapes on individuals’ stress, not the specific effect of roadside landscapes on driver stress. Antonson et al. (Citation2009) did look at the influence of different landscape types in Sweden on stress (not stress recovery). Using a driving simulator, participants drove next to different landscape types and were then asked how they felt, on a 4-point ordinal scale from “very calm” to “highly stressed”. Driving next to open landscapes was reported to be less stressful than driving next to forests or varied landscapes (those with farmhouses, fields, trees, and shrubs). However, analysis of driving behaviour showed that in open landscapes participants drove farther from road centre and grasped the steering wheel more often. The latter could be an indicator of more, rather than less, stress.
Antonson et al. (Citation2009) also looked at the effects on driving speed: faster in open landscapes, followed by forests, and varied landscapes. These results are consistent with those of Yu et al. (Citation2019), obtained in a different country (China) and with a different method (a naturalistic approach, i.e. participants driving instrumented vehicles on real roads). The probability of exceeding speed limits was highest in road sections next to open fields, followed by those next to trees/plants, tunnels, mountains, and houses/streets. In addition, roadside landscape was more important than road geometry in explaining speeding behaviour.
Three studies analysed the effect of landscape monotony on passive fatigue (i.e. disengagement with driving due to low workload). This is a small number, compared with the extensive research on monotony due to road geometry (e.g. long straight roads). Lack of variability in the landscape (i.e. open fields) has been linked with decreased vigilance, assessed with physiological measures and eye movements (Larue et al., Citation2011). Regularity in the distribution of objects (trees, houses, or farms) along a road has also been linked with more frequent and more variable large steering wheel movements, which could indicate fatigue (Thiffault & Bergeron, Citation2003). In contrast to these results, Ahlström et al. (Citation2018) found that sleepiness (assessed by physiological measures and self-assessments) and driving behaviour were less affected by type of landscape than by driving task demand.
A final topic is landscape colour, analysed in a single study (Wang et al., Citation2016). This study estimated an indicator of colour brightness of natural elements (e.g. vegetation) in the surroundings of a motorway. Brighter colours were associated with an increased heart rate. However, the study relied on data from only one (male) driver.
2.3. Evidence gaps
The evidence is still scarce and does not cover many types of landscape that are usually perceived positively in general landscape appreciation studies and have proven benefits for health and wellbeing, such as water bodies (Gascon et al., Citation2017). It also does not cover landscapes that are usually perceived negatively, such as industrial or derelict areas (Nasar, Citation1998).
There is no evidence on long-term effects of driving regularly through certain types of landscapes. Views may be regarded by drivers as a (positive or negative) component of their daily commute to work. While visual aspects are often mentioned in the literature dealing with travel and commuting satisfaction, there is no evidence on actual effects on commuter stress and general wellbeing, and on how visual effects interact with levels of congestion and other characteristics of commuting trips.
The impact of different landscape types on driver distraction is also understudied. It is possible that landscapes that reduce stress because of their beauty also have a detrimental effect on safety because drivers make more glances away from the roadway to appreciate the landscape or to take photos.
Finally, existing research has not assessed the impact of distance from the road, i.e. the difference between the landscape immediately next (and alongside) the road and the views of landscape beyond the road, an important factor in roads in mountainous areas and in elevated roads in urban areas.
2.4. Methodological issues
All studies used experiments involving participants driving either a simulator or an instrumented vehicle. The only exception is Parsons et al. (Citation1998), who used video displays. Most studies used multivariate statistics (ANOVA and regression), except Yu et al. (Citation2019), who also used a classification method. One study (Ahlström et al., Citation2018) triangulated data from a driving simulator experiment, physiological measurements, and driver self-assessments.
The number of drivers involved in the experiments varies from only one to 56. Yu et al. (Citation2019) collected a large dataset, corresponding to 50,000 km driven by participants. The main methodological issue in most studies is sample imbalance. Some studies used all male or overwhelmingly male samples. Others used samples composed mostly of young participants orstudents and university staff. The results are also not disaggregated by driver characteristics (such as gender, age, and socio-economic group) that are often significant in landscape appreciation studies and that may affect stress and passive fatigue.
3. Roadside vegetation
3.1. Search and selection results
Ten studies were selected about the effects of roadside vegetation, from general transport, travel safety, urban environment, and travel or environmental psychology/behaviour journals. The results refer to various upper-middle and high income countries. The table in Appendix 2 shows the information extracted from these studies.
3.2. Visual aspects and their effects
Exposure to vegetation is usually linked with wellbeing and stress reduction. This benefitial effect may also apply in the context of driving, although it is counterbalanced by possible detrimental effects on drivers’ mental states due to reduced visibility and an increased sense of enclosure, especially in the case of roadside trees.
The paper by Cackowski and Nasar (Citation2003) is the most cited study on the links between the amount of roadside vegetation and drivers’ mental states. The results suggest that more vegetation leads to more tolerance to frustration but has no effect on (self-rated) anger. Mixed results were also reported by Antonson et al. (Citation2015): vegetation density was linked to higher self-rated stress but not to heart rates. In addition, vegetation density led to a lower speed reduction when encountering a hazard but had no effect on mean speed, speed variability, lateral position, and drivers’ gaze. A third study, by Jiang et al. (Citation2021a), found that self-rated mental states (boredom, anger, frustration, avoidance, anxiety, tension, and fatigue) improve with “greenness” (i.e. provision of vegetation: tree vs. shrub vs. turf vs. barren) and with vegetation regularity (vs. random). Overall, these results point to benefitial outcomes, although not reflected in all indicators. A fourth study (Stamatiadis et al., Citation2010) analysed driver self-rated discomfort, which was found to depend on the interaction between “greenness” (trees vs. tall plants vs. low plants vs. grass) and the presence and type of roadside barriers.
The other six studies deal with effects on driver performance. All except one (Fitzpatrick et al., Citation2014) used data from driver simulators. The variables measured were speed, the vehicle's lateral position, and eye movements, with one study (Jiang et al., Citation2021b) also asking participants to self-assess their performance. Comparative analysis of the results suggests that driver performance depends on four groups of variables:
Vegetation type – Jiang et al. (Citation2021b) found that roadside shrubs were associated with better driving performance (assessed by several variables) than “greener” roadsides (i.e. trees) and “less green” ones (i.e. turf or no vegetation).
Vegetation density – Fitzpatrick et al. (Citation2014) found a link between tree density and speed reduction but this was not confirmed in a later study, where density was not related to speed (or to lateral position) (Fitzpatrick et al., Citation2016).
Vegetation spacing – Calvi (Citation2015) found that shorter distances between trees lead to a shift to road centre but had no impact on speed.
Distance from the road – There is consistent evidence that trees near the road lead drivers to reduce speed (Calvi, Citation2015; Fitzpatrick et al. Citation2016; Van der Horst & De Ridder, Citation2007) and some evidence that faraway trees increase speed (Calvi, Citation2015). A shift to the road centre was reported by Fitzpatrick et al. (Citation2014, Citation2016) and Calvi (Citation2015) (in the case of near trees), and by Van der Horst and De Ridder (Citation2007) (in the case of roads with barriers).
Degree of enclosure – This takes into account the height of trees and their distance to the road. Zheng et al. (Citation2018) found that a higher degree of enclosure reduces drivers’ reaction time when encountering a hazard. In straight roads, it also reduces speed.
3.3. Evidence gaps
As in the previous group of studies, there is no evidence on the long term effects of driving along roads with roadside vegetation. In addition, almost all studies have analysed vegetation in rural settings (and in 2-lane roads). It is possible that exposure to vegetation in urban settings (e.g. on roads with attractive roadside landscaping or next to parks) decreases the stress of car commuters, although this hypothesis needs testing.
Existing studies have only considered vegetation that is relatively near from the road (even when labelled as faraway trees), not panoramic views (for example, in mountainous areas), which tend to be highly appreciated.
There is also a lack of evidence on the impacts on some groups of drivers. For example, no study has looked at age groups above 60.
3.4. Methodological issues
Most studies have used experiments with driving simulators or questionnaires supported with the display of videos to participants. Three studies triangulated data from different experiments and questionnaires (Antonson et al., Citation2015; Fitzpatrick et al., Citation2014; Jiang et al., Citation2021a). Four studies used samples of only students or students and university staff.
4. Advertisements
4.1. Search and selection results
The search and selection process yielded 25 documents about the effects of advertisements. Appendix 3 shows the information extracted from the reviewed documents. Almost half (12) of the studies were published since 2018. Eleven were published in journals on safety, others in general transport, travel psychology/behaviour, ergonomics, health, and general psychology journals. Studies come from countries around the world, but only two (Iran and Lebanon) are not high income.
Two previous reviews exist: Decker et al. (Citation2015), on driver's visual performance, and Oviedo-Trespalacios et al. (Citation2019), on safety behaviour and consequences (e.g. collisions). The present review has a different scope (driver wellbeing and behaviour – not safety consequences). In addition, we include recent studies – the 2015 and 2019 reviews included studies up to 2013 and 2018, respectively. This means that 84% and 52% of the documents selected for this review were not included in the 2015 and 2019 reviews, respectively.
4.2. Visual aspects and their effects
All studies looked at the effects on distraction (usually assessed by eye movements) or driver performance (assessed by indicators such as speed, lateral position, reaction time, and vehicle headway).
Some studies measured the effects of the presence (vs. absence) of advertisements, without specifying their type, finding significant effects in some indicators of driver distraction and performance, but not all (see Appendix 3 for details of insignificant effects). Young et al. (Citation2009) found effects on drivers’ glances at advertisements, lane drifting, and time out of lane, and Bendak and Al-Saleh (Citation2010) found effects on lane drifting and instances of crossing junctions in a dangerous manner. Horberry et al. (Citation2006) found that older drivers drove slower in road sections with many advertisements, but no significant effects, for any age group, on self-rated driving workload and performance in in-vehicle distraction tasks.
Other studies measured the effects of specific types of advertisements. Young et al. (Citation2017) found only a limited impact of static billboards on drivers’ situation awareness. There is more (and consistent) evidence for electronic billboards, which have been associated with long glances off the road (Belyusar et al., Citation2016) and with long reaction times, when comparing with a no-billboard scenario (Mollu et al., Citation2018) or with other external distractions such as police cars and work zones (Shaw et al., Citation2019). Harms et al. (Citation2019) found that seeing ads in traffic management variable management signs was not associated with a lower propensity to follow subsequent safety instructions.
The bulk of the studies tested the effects of different characteristics of advertisements. Comparative analysis of the results suggests that those effects depend on six groups of variables:
Type of advertisement – Costa et al. (Citation2019) found that static billboards received the most glances from drivers, followed by gas price LED signs, directional signs, vendor signs, and display boards. Considering billboards only, there is consistent evidence of more and longer glances at electronic billboards with movable displays, compared with static ones (Beijer et al., Citation2004; Brome et al., Citation2021; Dukic et al., Citation2013), and some evidence of more glances at electronic billboards with shorter display times (Mollu et al., Citation2018). However, Smiley et al. (Citation2004) found that static billboards received more unsafe glances (i.e. those made at short vehicle headways). Other studies found no major difference in the effect of static and electronic billboards on glances (Edquist et al., Citation2011) or that the difference depended on the drivers’ age (Stavrinos et al., Citation2016). Brome et al. (Citation2021) found evidence of worse driving performance (e.g. reaction time) in the case of movable displays, but Edquist et al. (Citation2011) found no significant effect.
Advertisement placement – This includes:
Elevation – This was a negative predictor of duration of glances at advertisements in a study by Costa et al. (Citation2019). Other results are more nuanced. Meuleners et al. (Citation2020) found that the difference in the effect on driving performance of electronic billboards placed on overhead bridges and posts depended on the complexity of the billboard. Crundall et al. (Citation2006) found that drivers facing possible hazards made more glances at street-level advertisements (on bus shelters) than at advertisements raised three metres from the street. However, when drivers were looking specifically for advertisements, they made more glances at raised advertisements.
Angle to the road – Zalesinska (Citation2018) found that in the presence of an electronic billboard, reaction time decreased with the angle to the road (depending on the billboard's size and luminance).
Advertisement content – This includes:
Complexity – In the study by Meuleners et al. (Citation2020), more complex electronic billboards tended to be associated with worse driving performance (depending on interactions with placement and display time). Marciano (Citation2020) also found that (static) billboards with graphic elements and little text were the safest (in terms of reaction time and probability of collision) in most of the scenarios analysed. This was confirmed by Harasimczuk et al. (Citation2021): advertisements with longer slogans led to more variability in the distance and time headway to the vehicle in front.
Emotional content – Billboards with emotional content receive more glances (Megías et al., Citation2011) and lead to speed reduction (Chan & Singhal, Citation2013). Negative emotions have been associated with better memory recall (Chan & Singhal, Citation2013) and with both shorter (Megías et al., Citation2011) and longer response times (Walker & Trick, Citation2019) when drivers faced a hazard.
Sexual appeal – linked with lower and more variable speed and longer reaction times to a hazard (Maliszewski et al., Citation2019). The hypothesis is that sexual appeal in advertisements causes emotional arousal, which is then linked with cognitive distractions, as revealed by driving behaviour.
Road and traffic characteristics – Attention to billboards has been found to be higher at junctions (Sheykhfard & Haghighi, Citation2020), and at times when the traffic volume was low/moderate and traffic speed was low or the vehicle was stationary (Young et al., Citation2017).
Type of area – There is evidence of more glances at advertisements in roads in retail areas (Mollu et al., Citation2018) and longer glances in rural areas (Costa et al., Citation2019). Young et al. (Citation2009) found no interaction between the presence of billboards and type of road/area (urban, rural, and motorways). However, this could be because motorways were considered as a separate category, not disaggregated into urban and rural.
Driver characteristics – More and longer glances at billboards have been identified both for teenagers (Stavrinos et al., Citation2016) and older drivers (Belyusar et al., Citation2016). Edquist et al. (Citation2011) found that errors and longer reactions times occurred mainly in the case of older drivers. Age (and gender) did not alter the effects of billboards with sexual appeal in the study of Maliszewski et al. (Citation2019).
4.3. Evidence gaps
The existing evidence is relative to a variety of road and area types, including 6- and 8-lane motorways, rural 2-lane roads, and urban streets. This reduces the potential for generalisation. There is also insufficient knowledge on the interactions between the many variables affecting the results. In some cases, these variables are not even specified. For example, the placement of the advertisements was not clear in several of the studies reviewed. Evidence on the effect of distance of the advertisement to the road is inconclusive. The only study testing this effect (Mollu et al., Citation2018) found it to be significant only when interacted with the billboard's display time. Evidence on the influence of driver characteristics is also scarce: interactions with age, gender, and visual impairment have not been clarified. Vehicle type and trip characteristics may also be relevant. Only one study has looked at effects on motorcyclists (Megías et al., Citation2011), and no studies have looked at goods vehicles.
All studies analysed detrimental effects on distraction and performance. There is no evidence on possible benefits of looking at advertisements.
4.4. Methodological issues
Apart from Crundall et al. (Citation2006), who tracked eye movements of participants watching videos, all other studies have used experiments involving either a driving simulator or a naturalistic approach using an instrumented vehicle. The experiments vary widely across the studies reviewed in terms of the number of advertisements seen by participants, from 4 to 154. The main outcomes measured are distraction (glances) and driving performance. However, the data collected is not usually triangulated with self-reported information about what drivers recall seeing during the drive and what they report seeing in their usual drives in the real world. This is a limitation, because experiments (especially those using simulators) do not necessarily replicate the visual (and other) stimuli that drivers encounter. There are also no before-after analyses (for example, before and after the installation of advertisements).
Almost all studies have used multivariate methods (especially ANOVA). The exception is Young et al. (Citation2017), who analysed the network of verbal protocols provided by drivers as a part of a naturalistic approach. However, the samples of many studies are unrepresentative of the population of drivers. Most studies have relied on a young sample, in some cases not gender-balanced and composed only of students, which limits the scope for deriving policy implications from the results.
5. Other roadside objects
5.1. Search and select results
Nine studies were selected about the effects of roadside objects other than advertisements. The studies were published in safety, general transport, general psychology, and travel psychology/behaviour journals and report results obtained in high-income countries around the world. Appendix 4 shows the information extracted from the reviewed documents.
5.2. Visual aspects and their effects
Only one study compared different types of objects. Antonson et al. (Citation2014) compared the effect of “old” objects (a nineteenth century church and a seventeenth century milestone) and “modern” ones (a wind turbine and a bus stop) on driver stress, distraction, and performance in a rural road in Sweden. In general, the presence of objects reduced speed but did not affect stress (as measured by heart rates and self-rated by participants). None of the outcomes measured (stress, eye movements, driving performance) differed according to the type of objects (old or modern). Differences arose only in relation to object placement. Faraway objects were associated with longer glances and near objects were associated with speed variability and a shift towards the road centre.
Other studies focused on a single type of object, as follows.
Roadside memorials (identifying locations of previous collisions with fatalities) are common around the world. They can be distracting but can also make drivers more aware of collision risk and influence safety behaviour, due to the message they transit. Results of studies testing these effects are contradictory. Tay (Citation2009) observed fewer red light violations after the installation of mock roadside memorials in a city in Canada. In another study by the same author in Australia, older people, middle-aged females, and participants who feel sad/sympathetic or worried/concerned stated they are less likely to violate red lights when they see roadside memorials (Tay, Citation2018). In contrast to these results, Tay et al. (Citation2011) observed no effect on speed and vehicle headways, and Beanland and Wynne (Citation2019) found only brief distractions and no effect on participants’ preferred speed. These contradictions can be explained by the characteristics of the road sections analysed (motorway vs. standard road, link vs. junction, speed limit) and the placement of the memorials. For example, the lack of effects found by Tay et al. (Citation2011) may be explained by the type of road (motorway with 110 km/h speed limit) and the offset of the memorials to the road (16 m) – drivers may not notice memorials this far from the road.
An increasingly common sight near roads, unmanned aerial vehicles (drones) are a moving visual element that is potentially distracting for drivers. Two studies found that drones lead to glances from drivers. Barlow et al. (Citation2019) found that this is especially the case in rural areas and when the drone is adjacent to road. Ryan et al. (Citation2020) found that glances occurred irrespectively of drone height and the driver's age and gender. Despite this evidence of the impact of drones on driver distraction, Ryan et al. (Citation2020) found little impact on driving performance, as assessed by speed and lateral position.
The rotor blades of wind turbines are another moving element that might distract drivers. De Ceunynck et al. (Citation2017) found that the presence of wind turbines was linked to speed reduction, a shift in the lateral position of the vehicle towards the road centre, and slightly higher variability in speed and lateral position. There was no evidence of serious traffic conflicts.
Finally, utility poles can reduce visibility affecting driver's safety behaviour – Fitzpatrick et al. (Citation2014) found that they do reduce driving speed.
5.3. Evidence gaps
There is no evidence for several types of roadside objects. This includes aesthetically pleasing elements such as roadside public art (which is common in roundabouts in some countries) and unattractive or distracting elements such as utility wires.
There is no evidence on the effects of other transport infrastructure visible from the road (e.g. railways, other roads) and of different types of buildings, according to number of stories, type of design and use (e.g. residential, commercial, industrial). While some information could be derived from a few studies comparing driver performance in urban and rural areas, the analysis of these studies did not isolate the impact of type of buildings from that of road geometry (e.g. junctions) and road use (e.g. higher traffic volumes, more pedestrians). For this reason, these studies were not selected for review.
5.4. Methodological issues
Three studies used a before-after comparison approach (De Ceunynck et al., Citation2017; Tay, Citation2009; Tay et al., Citation2011). All three were observational studies with large datasets on speed and driver safety behaviour, thus being particularly suitable in establishing cause–effect relationships. The other studies used statistical tests and regression models on data from driver simulators and questionnaires. The approach used by Beanland and Wynne (Citation2019) is also robust as it triangulates data from eye trackers and questionnaires (both confirming that roadside memorials have little impact on drivers).
6. Synthesis
6.1. Summary of findings
The sections above suggest mixed evidence, as shown in . The empirical link between monotonous views and driver fatigue seems to be stable, but the effect of other visual aspects is uncertain, depending on many variables. Roadside vegetation can reduce driver stress and lead drivers to adjust their behaviour, reducing speeds, but that depends on how high and dense the vegetation is and how it is placed along and away from the road. Advertisements have a generally detrimental effect, increasing distractions and risky behaviours, but this depends on the type, placement, and content of the advertisement and on the characteristics of road, area, and driver. Finally, other visual elements (roadside memorials, drones, utility poles, and wind turbines) have been linked to more distractions and risky behaviours, but there are not enough studies to draw definitive conclusions.
Table 3. Evidence on effects of roadside visual environment on driver wellbeing and behaviour.
The evidence comes mostly from the fields of road safety and travel or environmental psychology/behaviour. The topic remains unexplored in the fields of landscape planning and tourism management (which have focused on travellers’ perceptions and preferences, not on driver wellbeing and behaviour). It is also unexplored in public health, a field that could bring insights into the major gap we identified in this paper: the long-term effects on wellbeing, including stress related to reduced satisfaction with daily travel. There is also little knowledge on changes in the effect over time, for drivers using the same route regularly. Drivers may not notice the roadside visual environment as they become used to it.
The set of visual elements studied has been limited (most studies are about roadside advertisements). This leaves gaps regarding the beneficial or detrimental effects of many types of landscape (e.g. water bodies, mountains, industrial estates, derelict areas, urban parks) and of elements of the built environment (e.g. buildings, other transport infrastructure, public art, utility wires). Some studies have segmented results according to age, but interactions with other demographic factors have rarely been analysed. No studies have tested interactions with trip purpose (e.g. work, leisure, commuting), and type of driver/vehicle (looking at issues in specific populations of professional drivers such as bus, taxi, and truck drivers). There is also little knowledge about differences across countries or cultures and specific effects arising in the Global South (although the lack of studies found for this review could be related to restricting search results to documents in English).
6.2. Policy implications and directions for future research
The policy implications of the existing body of evidence are ambiguous as different conclusions can be derived from the results of each study – significant links with driver wellbeing and behaviour appear for some indicators but not others. This problem can be mitigated by the triangulation of data from various sources, attempted by some of the studies reviewed. The difficulty in deriving policy implications is compounded by the fact that cause–effect relationships are not always clear.
The methods used in the literature also have limitations. Most studies have used experiments with video displays, driver simulators, or instrumented vehicles. As a result, the samples are small. They also tend to be unbalanced, often only male. This has been justified with the confounding effects of menstruation and contraceptives in physiological measures of stress among female drivers, and with the higher incidence of collisions among male drivers. The latter has also been given as a reason for having samples of only young people. In addition, the samples of many studies are composed of students only (probably because of being easier to recruit).
Besides covering the gaps and solving the methodological issues described above, future research could also make links with the study of other effects of the visual environment of roads and roadsides. This includes the effect on car and bus passengers, who are able to look at their surroundings without compromising safety. This is a priority for future research, as eventually all car users will become passengers in driverless vehicles. In this context, more effort can be put into studying the effects of the roadside element on stress and relaxation, rather than on driver distraction and other aspects of driver behaviour. Other research priorities include the effect of the roadside environment on pedestrians and cyclists and the effect of the road itself on people in buildings or public places. There are possible synergies but also conflicts in improving the view from the road (balancing aesthetics and traffic safety) and the view of the road (attending mostly to aesthetics). In sum, improving the visual environment of roads and roadsides can only be fruitful by attending to the wellbeing of both road users and non-users.
Disclosure statement
No potential conflict of interest was reported by the author(s).
References
- Ahlström, C., Anund, A., Fors, C., & Åkerstedt, T. (2018). Effects of the road environment on the development of driver sleepiness in young male drivers. Accident Analysis and Prevention, 112, 127–134. https://doi.org/10.1016/j.aap.2018.01.012
- Akbar, K. F., Hale, W. H. G., & Headley, A. D. (2003). Assessment of scenic beauty of the roadside vegetation in northern England. Landscape and Urban Planning, 63(3), 139–144. https://doi.org/10.1016/S0169-2046(02)00185-8
- Alivand, M., Hochmair, H., & Srinivasan, S. (2015). Analyzing how travelers choose scenic routes using route choice models. Computers, Environment and Urban Systems, 50, 41–52. https://doi.org/10.1016/j.compenvurbsys.2014.10.004
- Antonson, H., Ahlström, C., Mårdh, S., Blomqvist, G., & Wiklund, M. (2014). Landscape heritage objects’ effect on driving: A combined driving simulator and questionnaire study. Accident Analysis and Prevention, 62, 168–177. https://doi.org/10.1016/j.aap.2013.09.021
- Antonson, H., Jägerbrand, A., & Ahlström, C. (2015). Experiencing moose and landscape while driving: A simulator and questionnaire study. Journal of Environmental Psychology, 41, 91–100. https://doi.org/10.1016/j.jenvp.2014.11.010
- Antonson, H., Mårdh, S., Wiklund, M., & Blomqvist, G. (2009). Effect of surrounding landscape on driving behaviour: A driving simulator study. Journal of Environmental Psychology, 29(4), 493–502. https://doi.org/10.1016/j.jenvp.2009.03.005
- Appleyard, D., Lynch, K., & Myer, J. (1964). The view from the road. MIT Press.
- Barlow, Z., Jashami, H., Sova, A., Hurwitz, D. S., & Olsen, M. J. (2019). Policy processes and recommendations for unmanned aerial system operations near roadways based on visual attention of drivers. Transportation Research Part C: Emerging Technologies, 108, 207–222. https://doi.org/10.1016/j.trc.2019.09.012
- Beanland, V., & Wynne, R. A. (2019). Effects of roadside memorials on drivers’ risk perception and eye movements. Cognitive Research, 4, 32. https://doi.org/10.1186/s41235-019-0184-1
- Beijer, D., Smiley, A., & Eizenman, M. (2004). Observed driver glance behavior at roadside advertising signs. Transportation Research Record: Journal of the Transportation Research Board, 1899(1), 96–103. https://doi.org/10.3141/1899-13
- Belyusar, D., Reimer, B., Mehler, B., & Coughlin, J. F. (2016). A field study on the effects of digital billboards on glance behavior during highway driving. Accident Analysis and Prevention, 88, 88–96. https://doi.org/10.1016/j.aap.2015.12.014
- Bendak, S., & Al-Saleh, K. (2010). The role of roadside advertising signs in distracting drivers. International Journal of Industrial Ergonomics, 40(3), 233–236. https://doi.org/10.1016/j.ergon.2009.12.001
- Blumentrath, C., & Tveit, M. S. (2014). Visual characteristics of roads: A literature review of people’s perception and Norwegian design practice. Transportation Research Part A: Policy and Practice, 59, 58–71. https://doi.org/10.1016/j.tra.2013.10.024
- Brome, R., Awad, M., & Moacdieh, N. M. (2021). Roadside digital billboard advertisements: Effects of static, transitioning, and animated designs on drivers’ performance and attention. Transportation Research Part F: Traffic Psychology and Behaviour, 83, 226–237. https://doi.org/10.1016/j.trf.2021.10.013
- Cackowski, J. M., & Nasar, J. L. (2003). The restorative effects of roadside vegetation: Implications for automobile driver anger and frustration. Environment and Behavior, 35(6), 736–751. https://doi.org/10.1177/0013916503256267
- Calvi, A. (2015). Does roadside vegetation affect driving performance? Driving simulator study on the effects of trees on drivers’ speed and lateral position. Transportation Research Record: Journal of the Transportation Research Board, 2518(1), 1–8. https://doi.org/10.3141/2518-01
- Carr, S., & Schissler, D. (1969). The city as a trip: Perceptual selection and memory in the view from the road. Environment and Behavior, 1(1), 7–35. https://doi.org/10.1177/001391656900100102
- Chan, M., & Singhal, A. (2013). The emotional side of cognitive distraction: Implications for road safety. Accident Analysis and Prevention, 50, 147–154. https://doi.org/10.1016/j.aap.2012.04.004
- Costa, C., Bonetti, L., Vignali, V., Bichicchi, A., Lantieri, C., & Simone, A. (2019). Driver's visual attention to different categories of roadside advertising signs. Applied Ergonomics, 78, 127–136. https://doi.org/10.1016/j.apergo.2019.03.001
- Crundall, D., Van Loon, E., & Underwood, G. (2006). Attraction and distraction of attention with roadside advertisements. Accident Analysis and Prevention, 38(4), 671–677. https://doi.org/10.1016/j.aap.2005.12.012
- De Ceunynck, T., Pauw, E. D., Daniels, S., Polders, E., Brijs, T., Hermans, E., … Wets, G. (2017). The effect of wind turbines alongside motorways on drivers’ behaviour. European Journal of Transport and Infrastructure Research, 17, 477–494. https://doi.org/10.18757/ejtir.2017.17.4.3210
- Decker, J. S., Stannard, S. J., McManus, B., Wittig, S. M. O., Sisiopiku, V. P., & Stavrinos, D. (2015). The impact of billboards on driver visual behavior: A systematic literature review. Traffic Injury Prevention, 16(3), 234–239. https://doi.org/10.1080/15389588.2014.936407
- Denstadli, J. M., & Jacobsen, J. K. S. (2011). The long and winding roads: Perceived quality of scenic tourism routes. Tourism Management, 32(4), 780–789. https://doi.org/10.1016/j.tourman.2010.06.014
- Díez-Gutiérrez, M., & Babri, S. (2020). Explanatory variables underlying the route choice decisions of tourists: The case of Geiranger Fjord in Norway. Transportation Research Part A: Policy and Practice, 141, 398–409. https://doi.org/10.1016/j.tra.2020.09.023
- Dukic, T., Ahlstrom, C., Patten, C., Kettwich, C., & Kircher, K. (2013). Effects of electronic billboards on driver distraction. Traffic Injury Prevention, 14(5), 469–476. https://doi.org/10.1080/15389588.2012.731546
- Dulebenets, M. A., Ozguven, E. E., & Moses, R. (2018). The Highway Beautification Act: Towards improving efficiency of the federal outdoor advertising control program. Transportation Research Part A: Policy and Practice, 110, 88–106. https://doi.org/10.1016/j.tra.2018.01.031
- Edquist, J., Horberry, T., Hosking, S., & Johnston, I. (2011). Effects of advertising billboards during simulated driving. Applied Ergonomics, 42(4), 619–626. https://doi.org/10.1016/j.apergo.2010.08.013
- FHA (US Federal Highway Administration). (n.d.). Outdoor advertising control – a history and overview of the Federal Outdoor Advertising Control Program. http://www.fhwa.dot.gov/real_estate/oac/oacprog.cfm
- Fitzpatrick, C. D., Harrington, C. P., Knodler, M. A., & Romoser, M. R. E. (2014). The influence of clear zone size and roadside vegetation on driver behavior. Journal of Safety Research, 49, 97.e1–97104. https://doi.org/10.1016/j.jsr.2014.03.006
- Fitzpatrick, C. D., Samuel, S., & Knodler, M. A. (2016). Evaluating the effect of vegetation and clear zone width on driver behavior using a driving simulator. Transportation Research Part F: Traffic Psychology and Behaviour, 42, 80–89. https://doi.org/10.1016/j.trf.2016.07.002
- Froment, J., & Domon, G. (2006). Viewer appreciation of highway landscapes: The contribution of ecologically managed embankments in Quebec, Canada. Landscape and Urban Planning, 78(1-2), 14–32. https://doi.org/10.1016/j.landurbplan.2005.05.004
- Gascon, M., Zijlema, W., Vert, C., White, M. P., & Nieuwenhuijsen, M. J. (2017). Outdoor blue spaces, human health and well-being: A systematic review of quantitative studies. International Journal of Hygiene and Environmental Health, 220(8), 1207–1221. https://doi.org/10.1016/j.ijheh.2017.08.004
- Hallo, J. C., & Manning, R. E. (2009). Transportation and recreation: A case study of visitors driving for pleasure at Acadia National Park. Journal of Transport Geography, 17(6), 491–499. https://doi.org/10.1016/j.jtrangeo.2008.10.001
- Harasimczuk, J., Maliszewski, N. E., Olejniczak-Serowiec, A., & Tarnowski, A. (2021). Are longer advertising slogans more dangerous? The influence of the length of ad slogans on drivers’ attention and motor behavior. Current Psychology, 40(1), 429–441. https://doi.org/10.1007/s12144-018-9955-y
- Harms, I. M., Dijksterhuis, C., Jelijs, B., De Waard, D., & Brookhuis, K. A. (2019). Don’t shoot the messenger: Traffic-irrelevant messages on variable message signs (VMSs) might not interfere with traffic management. Transportation Research Part F: Traffic Psychology and Behaviour, 65, 564–575. https://doi.org/10.1016/j.trf.2018.09.011
- Horberry, T., Anderson, J., Regan, M. A., Triggs, T. J., & Brown, J. (2006). Driver distraction: The effects of concurrent in-vehicle tasks, road environment complexity and age on driving performance. Accident Analysis and Prevention, 38(1), 185–191. https://doi.org/10.1016/j.aap.2005.09.007
- Hughes, P. K., & Cole, B. L. (1986). What attracts attention when driving? Ergonomics, 29(3), 377–391. https://doi.org/10.1080/00140138608968272
- Jiang, B., He, J., Chen, J., & Larsen, L. (2021b). Moderate is optimal: A simulated driving experiment reveals freeway landscape matters for driving performance. Urban Forestry and Urban Greening, 58, 126976. https://doi.org/10.1016/j.ufug.2021.126976
- Jiang, B., He, J., Chen, J., Larsen, L., & Wang, H. (2021a). Perceived green at speed: A simulated driving experiment raises new questions for attention restoration theory and stress reduction theory. Environment and Behavior, 53(3), 296–335. https://doi.org/10.1177/0013916520947111
- Larue, G. S., Rakotonirainy, A., & Pettitt, A. N. (2011). Driving performance impairments due to hypovigilance on monotonous roads. Accident Analysis and Prevention, 43(6), 2037–2046. https://doi.org/10.1016/j.aap.2011.05.023
- Maliszewski, N., Olejniczak-Serowiec, A., & Harasimczuk, J. (2019). Influence of sexual appeal in roadside advertising on drivers’ attention and driving behavior. PLoS ONE, 14(5), e0216919. https://doi.org/10.1371/journal.pone.0216919
- Marciano, H. (2020). The effect of billboard design specifications on driving: A driving simulator study. Accident Analysis and Prevention, 138, 105479. https://doi.org/10.1016/j.aap.2020.105479
- Megías, A., Maldonado, A., Catena, A., Di Stasi, L. L., Serrano, J., & Cándido, A. (2011). Modulation of attention and urgent decisions by affect-laden roadside advertisement in risky driving scenarios. Safety Science, 49(10), 1388–1393. https://doi.org/10.1016/j.ssci.2011.06.001
- Meuleners, L., Roberts, P., & Fraser, M. (2020). Identifying the distracting aspects of electronic advertising billboards: A driving simulation study. Accident Analysis and Prevention, 145, 105710. https://doi.org/10.1016/j.aap.2020.105710
- Mollu, K., Cornu, J., Brijs, K., Pirdavani, A., & Brijs, T. (2018). Driving simulator study on the influence of digital illuminated billboards near pedestrian crossings. Transportation Research Part F: Traffic Psychology and Behaviour, 59, 45–56. https://doi.org/10.1016/j.trf.2018.08.013
- Moradi, A., Nazari, S. S. H., & Rahmani, K. (2019). Sleepiness and the risk of road traffic accidents: A systematic review and meta-analysis of previous studies. Transportation Research Part F: Traffic Psychology and Behaviour, 65, 620–629. https://doi.org/10.1016/j.trf.2018.09.013
- Nasar, J. L. (1998). The evaluative image of the city. SAGE.
- Oviedo-Trespalacios, O., Truelove, V., Watson, B., & Hinton, J. A. (2019). The impact of road advertising signs on driver behaviour and implications for road safety: A critical systematic review. Transportation Research Part A: Policy and Practice, 122, 85–98. https://doi.org/10.1016/j.tra.2019.01.012
- Parsons, R., Tassinary, L. G., Ulrich, R. S., Hebl, M. R., & Grossman-Alexander, M. (1998). The view from the road: Implications for stress recovery and immunization. Journal of Environmental Psychology, 18(2), 113–140. https://doi.org/10.1006/jevp.1998.0086
- Prideaux, B., & Carson, D. (Eds.). (2010). Drive tourism: Trends and emerging markets. Routledge.
- Ryan, A., Fitzpatrick, C., Christofa, E., & Knodler, M. (2020). Driver performance due to small unmanned aerial system applications in the vicinity of roadways. Transportation Research Part F: Traffic Psychology and Behaviour, 68, 118–131. https://doi.org/10.1016/j.trf.2019.12.006
- Shaw, F. A., Park, S. J., Bae, J., Becerra, Z., Corso, G. M., Rodgers, M. O., & Hunter, M. P. (2019). Effects of roadside distractors on performance of drivers with and without attention deficit tendencies. Transportation Research Part F: Traffic Psychology and Behaviour, 61, 141–151. https://doi.org/10.1016/j.trf.2018.02.013
- Sheykhfard, A., & Haghighi, F. (2020). Driver distraction by digital billboards? Structural equation modeling based on naturalistic driving study data: A case study of Iran. Journal of Safety Research, 72, 1–8. https://doi.org/10.1016/j.jsr.2019.11.002
- Smiley, A., Smahel, T., & Eizenman, M. (2004). Impact of video advertising on driver fixation patterns. Transportation Research Record: Journal of the Transportation Research Board, 1899(1), 76–83. https://doi.org/10.3141/1899-10
- Stamatiadis, N., Bailey, K., Grossardt, T., & Ripy, J. (2010). Evaluation of highway design parameters on influencing operator speeds through casewise visual evaluation. Transportation Research Record: Journal of the Transportation Research Board, 2195(1), 143–149. https://doi.org/10.3141/2195-15
- Stavrinos, D., Mosley, P. R., Wittig, S. M., Johnson, H. L., Decker, J. S., Sisiopiku, V. P., & Welburn, S. C. (2016). Visual behavior differences in drivers across the lifespan: A digital billboard simulator study. Transportation Research Part F: Traffic Psychology and Behaviour, 41, 19–28. https://doi.org/10.1016/j.trf.2016.06.001
- Tay, R. (2009). Drivers’ perceptions and reactions to roadside memorials. Accident Analysis & Prevention, 41(4), 663–669. https://doi.org/10.1016/j.aap.2009.03.006
- Tay, R. (2018). Effects of roadside memorials on red light running intention in different age, gender and personality groups. Transportation Research Part F: Traffic Psychology and Behaviour, 54, 86–95. https://doi.org/10.1016/j.trf.2018.01.016
- Tay, R., Churchill, A., & De Barros, A. G. (2011). Effects of roadside memorials on traffic flow. Accident Analysis and Prevention, 43(1), 483–486. https://doi.org/10.1016/j.aap.2010.08.026
- Thiffault, P., & Bergeron, J. (2003). Monotony of road environment and driver fatigue: A simulator study. Accident Analysis and Prevention, 35(3), 381–391. https://doi.org/10.1016/S0001-4575(02)00014-3
- Vägverket (Swedish Road Administration). (2004). Mål Och Mått för Gestaltningskvaliteter i Vägmiljön [Goals and dimensions for design qualities in the road environment]. Vägverket [in Swedish].
- Van der Horst, R., & De Ridder, S. (2007). Influence of roadside infrastructure on driving behavior – driving simulator study. Transportation Research Record: Journal of the Transportation Research Board, 2018(1), 36–44. https://doi.org/10.3141/2018-06
- Vegdirektoratet (Norwegian Public Roads Administration). (2014). Vegen i Landskapet Om Vakre Veger [The road in the landscape – about beautiful roads]. Vegdirektoratet [in Norwegian].
- Vejdirektoratet (Danish Road Directorate). (2002). Beautiful roads: A handbook of road architecture. Danish Road Directorate.
- Walker, H. E. K., & Trick, L. M. (2019). How the emotional content of roadside images affect driver attention and performance. Safety Science, 115, 121–130. https://doi.org/10.1016/j.ssci.2019.02.004
- Wang, L., Bie, Y., & Li, S. (2016). The impact of roadside landscape colors on driver’s mean heart rate considering driving time. Transportation Research Part F: Traffic Psychology and Behaviour, 42, 151–161. https://doi.org/10.1016/j.trf.2016.07.009
- Wolf, K. L. (2006). Assessing public response to freeway roadsides – urban forestry and context-sensitive solutions. Transportation Research Record: Journal of the Transportation Research Board, 1984(1), 102–111. https://doi.org/10.1177/0361198106198400110
- Young, K. L., & Salmon, P. M. (2012). Examining the relationship between driver distraction and driving errors: A discussion of theory, studies and methods. Safety Science, 50(2), 165–174. https://doi.org/10.1016/j.ssci.2011.07.008
- Young, K. L., Stephens, A. N., Logan, D. B., & Lenné, M. G. (2017). Investigating the impact of static roadside advertising on drivers’ situation awareness. Applied Ergonomics, 60, 136–145. https://doi.org/10.1016/j.apergo.2016.11.009
- Young, M. S., Mahfoud, J. M., Stanton, N. A., Salmon, P. M., Jenkins, D. P., & Walker, G. H. (2009). Conflicts of interest: The implications of roadside advertising for driver attention. Transportation Research Part F: Traffic Psychology and Behaviour, 12(5), 381–388. https://doi.org/10.1016/j.trf.2009.05.004
- Yu, B., Chen, Y., & Bao, S. (2019). Quantifying visual road environment to establish a speeding prediction model: An examination using naturalistic driving data. Accident Analysis and Prevention, 129, 289–298. https://doi.org/10.1016/j.aap.2019.05.011
- Zalesinska, M. (2018). The impact of the luminance, size and location of LED billboards on drivers’ visual performance – laboratory tests. Accident Analysis and Prevention, 117, 439–448. https://doi.org/10.1016/j.aap.2018.02.005
- Zheng, H., Qin, Y., Guo, F., Xiong, J., Xu, B., & Chen, Y. (2018). Speed and reaction behavior in different highway landscapes: A driving simulator study. Traffic Injury Prevention, 19(8), 880–884. https://doi.org/10.1080/15389588.2018.1511897
Appendices
Appendix 1. Evidence of effects of roadside landscape type.
Appendix 2. Evidence of effects of roadside vegetation.
Appendix 3. Evidence of effects of roadside advertisements
Appendix 4. Evidence of effects of roadside objects