
ABSTRACT
Value of Time (VOT) is a key element in transport infrastructure planning decisions. It is widely believed that travellers using autonomous vehicles (AVs) will have a lower VOT than conventional vehicles (CVs) because of improved road safety, increased road capacity, engagement in productive activity during travel and increased mobility. A number of researchers have measured VOT effects of AVs though no consolidation of this evidence has been undertaken to date. This is the first study to provide a quantitative summary and synthesis of the estimated VOT of AV travel including a synthesis of factors affecting AV VOT. Meta-analyses of 24 studies show that mean VOTs for conventional cars, private AVs and shared AVs are respectively 17.3, 12.1 and 19.4 AU$/hr. However, wide variations in these estimates are evident and 12 factors have been identified with statistically significant effects on these variations including geographical context, study experimental characteristics, trip characteristics and socio-economic factors. We found that AV VOT estimates are lower when animated videos are used to demonstrate AV capabilities. Private AVs have the lowest VOT estimates as do commute trips and morning peak periods. Young adults (18–30 years) and people with current driving experience consistently report lower AV VOT while those with higher educational status and higher-incomes report having higher AV VOT. Implications of findings for policy and future research are presented.
1. Introduction
Improvements in technology have transformed the transportation sector in the last few decades. Vehicles are now equipped with modern facilities e.g. audio and video playback, Wi-Fi connection, adaptive cruise control, lane assist systems, automatic emergency braking system, etc. to enable a more comfortable experience for passengers. Since Google’s (now Waymo) first demonstration of a self-driving vehicle in the early 2010s, vehicle manufacturers are in a race to develop and introduce autonomous vehicles (AVs) (Hartmans, Citation2016). West (Citation2016) predicted that by the end of 2040, AVs will occupy 25% of the global market share. AVs are expected to provide better road safety, increased road capacity, reduce congestion and pollution, and increase mobility for the elderly and disabled (Fagnant & Kockelman, Citation2015; Haboucha et al., Citation2017; Harper et al., Citation2016; Metz, Citation2018; van den Berg & Verhoef, Citation2016). It is thus widely assumed that AVs will change the current riding experience of conventional vehicles (CVs).
In the transport economics literature, driving is considered a disutility of travelling (Beesley, Citation1965; Oort, Citation1969). In conventional vehicles (CVs), drivers lose a considerable amount of their daily time while travelling. But AVs are presumed to bring back some of that lost time and reduce the disutility of travel by freeing drivers from the stress of driving (Wadud et al., Citation2016). According to SAE International (SAE, Citation2021), a level 5 fully automated vehicle will have the capability to perform all driving-related tasks independent of any human intervention. AVs will thus allow the drivers to engage in other worthwhile in-vehicle activities that would not have been possible in a CV (Pudāne et al., Citation2019; Wadud & Huda, Citation2018). An online survey conducted by Zou et al. (Citation2022) in China reported that 78% of respondents showed a willingness to utilise their in-vehicle time more efficiently by engaging in worthwhile activities in an AV. Harb et al. (Citation2021) presumed that multitasking while travelling will allow the riders to perceive the benefits of an AV. In such a quest, researchers are now trying to estimate the functional use of in-vehicle time (once they will be free from driving tasks) and how that affects the disutility of travel in terms of reducing the value of travel time (VOT).
Ortúzar and Willumsen (Citation2011) define the value of travel time (VOT) as “the value of the parameter associated with in-vehicle travel time in the generalised cost function”. VOT represents the willingness of a traveller to pay for a reduction in their travel time (Jara-Diaz, Citation2007). Currently, the viability of various transport schemes (both in forecasting and appraisal) largely depends on the VOT values as it reflects travellers’ perceptions affecting their choices. In addition, a reduced disutility of travel means that people will be travelling more and longer as evidenced with any previous transport innovations (Hardman, Citation2021). The consequences are unsustainable travel behaviour and urban growth patterns. As a result, it is critical to understand the true VOT effects of AVs for better appraisal of transport infrastructure and planning decisions. However, empirical evidence shows much heterogeneity in the estimated VOTs. This heterogeneity calls for a synthesised estimate of the VOTs for generalisability and a better understanding of the factors contributing to these variations. This study aims to contribute to these gaps in the literature. It has two objectives: a) to assess and summarise the strength of evidence present on VOTs for different types of AVs against conventional cars, and b) to determine how different factors contribute to the strength of evidence either positively or negatively.
Several studies concern the impact of AV. Milakis et al. (Citation2017) reviewed the policy and societal impacts of AV travelling and reported them in three orders. Travel time reliability, travel safety, personal comfort and performing non-driving activities are believed to have a significant positive impact on VOT reduction in AVs. But whether these impacts will be short-term or long-term and what could be the size of the impact was not covered in the literature. Iskander et al. (Citation2019) briefly discussed how drivers of conventional vehicles will lose the controllability of the vehicle and turn into a passenger in an AV which could result in motion sickness and impede the benefits of AV travel. If AV passengers are susceptible to motion sickness, this will obstruct them from using their in-vehicle travel time productively. This might increase the VOT for AV usage which will in return impact the perceived positive benefits of AVs. Nordström and Engholm (Citation2021) performed a morphological analysis to identify and propose the probable AV mobility concepts (e.g. private premium AV, shared taxi, feeder shuttle) that will have a significant impact on four broad categories (vehicle characteristics, operating principles, journey characteristics and traveller characteristics) relevant to the VOT. But the authors were not conclusive in terms of the changes in VOT for AVs compared to conventional cars and between various AV concepts due to several factors, e.g. comfort, privacy, wait time reliability. In addition, the authors specified that they have disregarded trip purpose and activities associated with travel time use which influence travellers mode choice decision and thus influence the changes in VOT. Rashidi et al. (Citation2020) undertook an alternative theoretical framework analysis and suggested that VOT in AVs will either remain the same (as CVs) or increase although speculations were made that field data may reveal the opposite. In their theoretical framework, the authors only focused on contemporary and isolated reports that proclaimed the possibility of a higher VOT for AV usage. Singleton (Citation2019) in a review paper, discussed the positive utility of travel time in AVs and commented that in-vehicle activities in AVs could be more of a coping with time rather than using it productively. And if travel time can be of (some or all) productive use that will also be limited to long-distance trips. Singleton (Citation2019) commented “given high uncertainty, further empirical research on the experimental, time use, and VOT impacts of AVs is needed”. We regard that the wider benefits of a transport system will be realised when both the technical and societal sub-systems combine (Currie, Citation2018; Lyons, Citation2018; Milakis, Citation2019). To date, no studies have attempted to quantify the changes in VOT between different AV mobility concepts and with conventional vehicles. To the best of our knowledge, our study is the first of its kind to provide a quantitative summary and synthesis of the estimated impacts of AVs on VOT through a meta-analysis of different technical and societal factors from published research.
The rest of the paper is structured as follows. Methodological approach is outlined next which explicitly describes the systematic literature review process followed for this study. The third section elaborates on the meta-analysis results, the fourth section continues with a discussion of the results and the fifth section concludes with some limitations, policy and research implications and direction for future research.
2. Methodology
2.1. Selection of papers
We followed the systematic literature review approach which Fink (Citation1998) defines as “a systematic, explicit, and reproducible design for identifying, evaluating and interpreting the existing body of recorded documents”. We collected empirical papers from the following source databases: Web of Science Core Collection, SCOPUS, Engineering Village (Compendex, Inspec and GEOBASE), and TRID. A search of these databases till 18 April 2022 found 368 papers using the following keywords and Boolean operators:
[“autonomous vehicle(s)” or “autonomous driving” or “connected autonomous vehicle(s)” or “automated vehicle(s)” or “vehicle automation” or “self-driving car(s)”]
AND
[“value(s) of time” or “value(s) of travel time” or “VOT” or “time valuation” or “travel time use”]
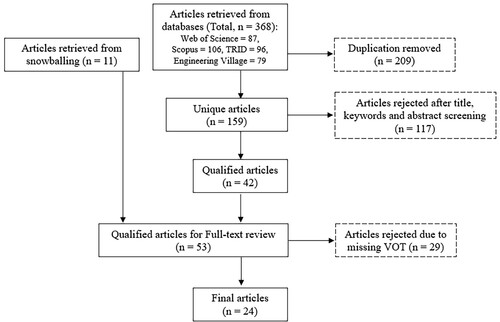
In order to be inclusive of this review, papers have been sorted out based on the following criteria: (1) publications need to be peer-reviewed; (2) language must be English; (3) studies must report VOT estimates; (4) at least one AV type (e.g. private autonomous car, shared autonomous car or taxi, pooled autonomous car and autonomous transit) have to be reported with VOT estimates; (5) mention VOT estimation method; and (6) have at least one socio-demographic variable related to AV-VOT values. shows the sifting process to assess the papers following the PRISMA (Moher et al., Citation2009; Page et al., Citation2021) guideline. After sorting out duplicates 159 unique articles are found for the next screening process. Reviewing the title, keywords and abstracts, 117 articles are rejected and 42 qualified papers are found for full-text review. Following an initial scan of the reference list of these articles, we included another 11 articles through a backward snowballing process (Wee & Banister, Citation2016). Finally, after the full-text screening, 24 articles have been selected for this literature review. A list of all the reviewed articles have been provided in Appendix A. We found that the earliest study on the topic published in 2016 (Krueger et al., Citation2016; Yap et al., Citation2016).
Figure 1. Summary of the comprehensive search procedure (source: authors analysis).
2.2. Data extraction and analysis process
After reviewing the full-text of all 24 articles, we extracted the following data: (1) general article information (title, publication year, country), (2) estimated VOT values, (3) vehicle characteristics (AV or CV, private or shared or transit), (4) experimental variables (survey types, survey method, sample size, trip characteristics), and (5) socio-demographic characteristics (i.e. gender, age, income level, education). Four types of AV concepts were reported in the empirical studies namely, private, shared, pooled and public transit. We denote them as “private AV”, “shared AV”, “pooled AV”, and “transit AV” in the rest of the paper. Pooled AVs are different from shared AVs where two or more persons have a common point of destination or the destinations are in the same route (Kang et al., Citation2021). In terms of CVs, we collected data for a car, transit (bus and metro), and train only.
We performed a meta-analysis of the extracted data which is a research process that allows the synthesis of the data from independent studies through statistical methods to determine the overall mean effect of a variable (Egger & Smith, Citation1997). For data extraction of any specific variable, if the study reports the variable (e.g. survey method, sample size, income level, etc.) explicitly, only then we consider the VOT values of that specific variable for the meta-analysis. But for the trip type variable, we categorised the data into two types: commute trip and non-commute trip. In some studies, trip purpose was not clearly mentioned. We assumed their VOT values were for non-commute trips. Similarly, for time of the day variable, AM peak and other time period are considered for VOT data. Studies that did not report VOT values for AM peak are considered as other time period. For the remaining variables, if no information has been found from a study, VOT values of that particular study have been excluded from the meta-analysis of that particular variable. It is worth mentioning that for each study, VOT values can vary based on various variables e.g. vehicle interior design (Correia et al., Citation2019), income level (Etzioni et al., Citation2021; Kolarova & Steck, Citation2019; Wong et al., Citation2018), education level (Kolarova & Cherchi, Citation2021), analysis method (Correia et al., Citation2019; Hicks et al., Citation2019). As such, the number of data points (VOT values) for a specific variable can be more than the total number of finally selected articles, such as, for private AV, 81 data points have been extracted from 24 articles (e.g. private AV for low, middle and high-income groups).
Studies reported VOT values according to their country-specific monetary units and for different years. As the aim of this study is to compare VOT values between studies, we converted all VOT values to Australian dollar (AU$) of 2021 rate using Purchasing Power Parities (PPPs) published by the OECD (OECD, Citation2022) to control any misrepresentation that may arise from ordinary currency exchange rates and also to account for inflationary impacts on monetary value over time (Eftec, Citation2009). VOT values are then analysed to perform various statistical tests (e.g. t-test, ANOVA test, Post-hoc test, Kruskal–Wallis test) depending on the variable characteristics to identify their impact on AV.
3. Results
3.1. Comparison of VOT values between AV and CV
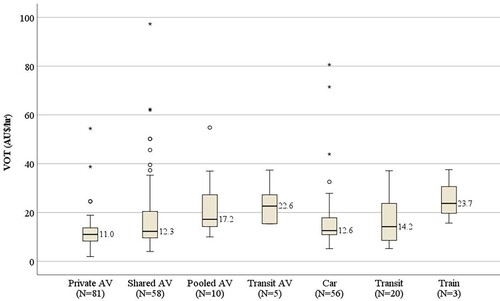
In order to understand the impact of AV over CV, we compared the estimated VOT values of all types of AVs (private, shared, pooled, and transit) with CVs (car, transit, train). shows the box plot distribution of estimated VOTs for all types of vehicles. While the boxes represent the interquartile range (25th and 75th percentile) with the dark black horizontal line representing the median value, bottom and top whiskers represent the minimum and maximum values, respectively, for individual vehicle category. It is observed that the VOT distribution of private AVs is significantly lower than all other types of AVs and CVs. The lowest median VOT among all types of AVs is for the private AVs (11 AU$/hr) which gradually increases for shared (12.3 AU$/hr), pooled (17.2 AU$/hr) and transit AVs (22.6 AU$/hr).
Figure 2. Box plot distribution of the estimated VOT for different types of vehicle.
We compare the mean values between each category and report them in . The negative or positive sign in the table indicates whether the vehicle categories in the first row is lower or higher (in percentage difference) to the vehicle categories of the first column. We also check the statistical significance of these differences through t-tests and presented them in colour code as green (significant) or orange (not significant) in . When compared with other AV categories, private AVs will have a minimum of 10.6% (shared AVs) to a maximum of 51.3% (transit AVs) lower VOT. When compared to CVs, private AVs show an almost similar range of VOT reduction, minimum 12.7% (car) to maximum 53.6% (train). This indicates that travellers in general are willing to pay less for saving one hour of their travel time while they are on private AVs compared to other modes. In other words, they will not be in a hurry to reach a destination. Similarly, they will be more comfortable to travel longer in a private AV, perhaps to enjoy/avail the benefits from AV travel (Lavieri & Bhat, Citation2019). This also implies that in the long run, AV ownership may increase significantly as private AVs are presumed to provide more privacy, personal safety, time reliability and business flexibility (Jing et al., Citation2020; Wadud & Chintakayala, Citation2021).
Table 1. Difference in VOT (in %) among vehicle categories (row minus column) .
The results suggest that travellers believe that riding in a private AV will broadly halve the VOT of riding in a conventional train. It is evident that travellers are now utilising their in-vehicle time (multitasking) while riding in a conventional train (Lyons et al., Citation2007). But due to privacy, travel time reliability and unavailability of a seat, often travellers cannot use their in-vehicle time in a train productively. As private AVs are believed to overcome these problems, in-vehicle travel time could become more productive (Malokin et al., Citation2019). Comparing shared AV with pooled AV and transit AV also shows significant VOT reductions which we think is primarily because of traveller privacy and safety concerns which may result from sharing the pooled or transit AV with unknown travellers. All other comparisons are not statistically significant. shows some outliers and extreme VOT values for private AV, shared AV, pooled AV and conventional cars. After investigating these VOT values, we found, they differ due to study context (country), income level and geographical location.
3.2. Influence of different factors on VOT estimates for AV
A range of factors acts to influence estimated VOT values. We identified 14 variables under four categories to check their impact on VOT estimates: (1) study context (e.g. country, geographical location), (2) experimental characteristics (e.g. sample size, AV demonstration approach, sample characteristics), (3) trip characteristics (e.g. trip type, trip distance, trip duration, time of the day), and (4) socio-economic factors (e.g. gender, age, education, income, driving license). Earlier, we found from that VOT estimates differ by travel modes and types of vehicle. To understand the impact of different variables on VOT estimates, we analysed all the above 14 variables by individual type of vehicles. But due to the low number of sample data, pooled AV, transit AV, conventional transit and train have not been analysed further. Only private AV, shared AV and conventional cars have been considered for further analysis. shows the variation of mean VOT (AU$/hr) of private AV, shared AV and conventional car (hereafter termed as “PAV”, “SAV” and “CAR” accordingly) for all 14 variables along with their individual categories.
Table 2. Variation of mean VOT (AU$/hr) between vehicle types and different variables.
3.2.1. Study context: country
Empirical studies reporting VOT estimates for AVs originated from various contexts, including: seven from the US, six from Germany, three from Australia, two from the Netherlands, one from each of these seven other European Union (EU) countries (Switzerland, the UK, Cyprus, Slovenia, Montenegro, Hungary and Iceland), and one from each of these Asian countries (Singapore, South Korea and Israel). Among all the European countries, we separate the study results of Germany and the Netherlands from the other seven EU countries to investigate statistical difference between them. shows that the mean VOT for PAV is highest in the USA (18.8 AU$/hr) and lowest in Australia (9.0 AU$/hr). A one-tailed t-test indicates that the mean VOT in Australia is significantly lower e.g. 52% than the USA (t = −1.317, p = .109). For PAV, the mean VOT of Germany and Netherlands is respectively 35% and 41% lower than the USA. In terms of SAV, Europe has the highest mean VOT (45.4 AU$/hr) compared to Germany with a lowest mean VOT (10.8 AU$/hr). To investigate whether these variations are statistically significant or not, we first conduct an ANOVA test to identify the significant pairs. Then we conduct a t-test to check their significance and report the statistical test results in . We find that the mean VOT in Germany is significantly lower than the USA for PAV (12.2 vs 18.8 AU$/hr) and SAV (10.8 vs 28.6 AU$/hr). The Netherlands also have lower mean VOT than the USA for PAV (11.0 vs 18.8 AU$/hr) and CAR (11.8 vs 27.1 AU$/hr). Comparing vehicle types, we find that both PAV (12.2 AU$/hr) and SAV (10.8 AU$/hr) will have significantly lower mean VOT than CAR (16.6 AU$/hr) in Germany.
Table 3. Statistical t-test results of the mean VOT difference between different variables and their individual categories.
3.2.2. Geographical location (rural vs. urban)
Studies reported their AV VOT estimates primarily for two types of geographical locations: rural and urban. We found from that in every case, the mean VOT is lower in rural than in urban. We also found that mean VOT is significantly lower (e.g. 50%) in rural (11.9 AU$/hr) than in urban area (23.6 AU$/hr) for conventional car. But for PAV, mean VOT will not be significantly different between rural (11 AU$/hr) and urban (14 AU$/hr) location which indicates that rural dwellers will enjoy travelling in PAV as the same as urbanites. We also tested the variation of mean VOT for different vehicle types in urban locations (see ). We found that in urban areas, mean VOT in PAV (14 AU$/hr) will be significantly lower (45%) than SAV (25.5 AU$/hr) at the 0.1 level (t = −1.414, p = .091).
3.2.3. AV demonstration approach in experimental design
In our systematic review, we found that with one exception (Harb et al., Citation2022) all the empirical studies estimate VOT for AV travel using stated preference (SP) techniques because no actual AV operations exist to enable revealed preference (RP) testing of respondent VOT. The exception is Harb et al. (Citation2022) who conducted an experiment with chauffeur-driven conventional cars as an analogy to AV to estimate VOT. All other empirical studies use SP so have to adopt various approaches of describing AV scenarios to their survey respondents so that they can understand AV technology which may affect their travel. The following types of demonstration approaches are found:
in writing; or
by showing an animation video of “futuristic” journey using AV’s.
In terms of writing, we found that research involves two types of approaches. One group of researchers mentioned the vehicle as a self-driving vehicle or autonomous vehicle or robot car. While the other group explained the AV scenario as being equivalent to a chauffeur-driven car. We refer to these two groups as “written as AV” and “written as chauffeur-driven” in our analysis. shows the box plot distribution of the VOT estimates for different demonstration approaches in the SP surveys. VOT distribution for the demonstration approach “written as AV” is much higher than the other two approaches. We hypothesise that the approaches taken to explain AV scenarios to respondents in SP surveys have a significant impact on VOT estimation. To examine this, we compare between the pairs of demonstration approaches to find their statistical significance.
Figure 3. VOT distribution classed by AV demonstration approach.
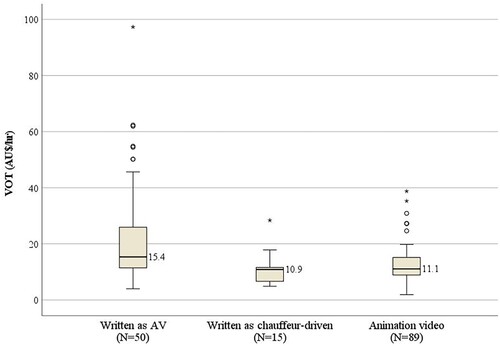
We found that there is no significant difference between demonstration approach of “written as chauffeur-driven” versus “animation video” (p = .402). In both cases, respondents estimate similar VOT regardless of demonstration approach. But when we compare the approach “written as AV” to other two approaches, we found significant difference between VOT estimates (for “animation video” p = .001 and for “written as chauffeur-driven” p = .002). We also compare individual AV types () and found that for both PAV and SAV, mean VOT is higher for “written as AV” approach than other two approaches. Our analysis from shows that for “written as AV” approach, perceived mean VOT in PAV is 60% lower than SAV. But for “animation video” approach, there is no significant difference on perceived mean VOT between PAV and SAV. Again, for PAV only, there is no significant difference between “written as AV” and “animation video” approaches. But mean VOT for “written as chauffeur-driven” approach is significantly lower than “written as AV” (36% lower) and “animation video” (24% lower) approaches. In contrast, for SAV only, “animation video” approach would yield a significant lower (64%) mean VOT than “written as AV” approach.
3.2.4. Sample size
In terms of the survey sample size mentioned in the empirical studies, we hypothesise that the VOT distribution will be same across various sample sizes. To test our hypothesis, we distributed sample sizes (n) into four categories:
Category-1: n ≤ 100 (no of data points, N = 55)
Category-2: 100 ≤ n ≤ 250 (N = 41)
Category-3: 250 ≤ n ≤ 500 (N = 26)
Category-4: n > 500 (N = 24)
We found that mean VOT is significantly higher for category-4 e.g. sample size of more than 500 respondents. And this is true for both PAV, SAV and CAR ( and ). For PAV, mean VOT is 43% higher when sample size of category 4 is compared to category 1 (21.1 AU$/hr vs 12.1 AU$/hr) and becomes 50% when compared with category 2 (21.1 AU$/hr vs 10.5 AU$/hr). For SAV, the sample size of category 4 is a significant 61% higher compared to category 1 (31 AU$/hr vs 12 AU$/hr). The trend is similar for CAR as well. Mean VOT is significantly 57% higher for the sample size of category 4 compared to category 2 (30.4 AU$/hr vs 13 AU$/hr).
3.2.5. Sample characteristics: respondents who prefer not to make a trade-off between choice sets
Empirical studies estimating VOT in AV travel have designed their SP survey with a number of choice scenarios considering the variation among various variables e.g. travel mode, travel time, travel cost, etc. Literature suggests that some respondents do not make any trade-off between the choice scenarios (Correia et al., Citation2019; Hamadneh & Esztergár-Kiss, Citation2022; Steck et al., Citation2018). These respondents are termed as “non-traders”. Whatever choice scenarios are presented, they always tend to go for the same choice option. Some studies reported that they exclude responses from “non-traders” while others include them. We hypothesise that the VOT will be different between the studies that excluded “non-traders” (N = 133) than those that included them (N = 21). Statistical result shows that the mean VOT from studies that excluded “non-traders” (termed as “trader” hereafter) is significantly lower (13.3 AU$/hr) compared to other (termed as “non-trader”) studies (32.6 AU$/hr) at an aggregate level. In an individual category e.g. SAV and CAR, the result is the same. shows that mean VOT of “non-trader” (39.7 AU$/hr for SAV, 38.3 AU$/hr for CAR) is significantly 66% higher than “trader” (13.6 AU$/hr for SAV, 15.7 AU$/hr for CAR).
3.2.6. Trip type
Empirical studies reported their estimated VOTs for different types of trips e.g. commute, leisure and shopping. We categorised them in two classes: commute and non-commute and performed t-test to check their impact on VOT. Statistical results (t = −3.176, p = .003) show that considering both types of AVs, the mean VOT estimates of commute trips (13.3 AU$/hr) is significantly lower than non-commute trips (22.9 AU$/hr). We also analysed the result for individual vehicle types. We found that for conventional car users, mean VOT is 35% lower (15 AU$/hr vs 23.1 AU$/hr) in commuting trips compared to non-commute trips at 0.1 level (t = −1.682, p = .109). The difference is significantly higher (51%) for SAV. Mean VOT for commute trips in SAV is 15 AU$/hr compared to 31 AU$/hr for non-commute trips. In contrast, mean VOT is not significantly different between commute and non-commute trips in PAV. We also found that mean VOT in PAV is significantly lower than SAV in both commute trip (23% lower; t = −2.132, p = .035) and non-commute trip (53% lower; t = −2.319, p = .028).
3.2.7. Time of the day
Studies also report estimated VOTs for different time periods with most of the study experiments conducted for the AM peak. We thus classified them in two categories: AM peak (N = 115) and others (N = 39) and conducted statistical tests at an aggregate level e.g. considering both types of AV (PAV and SAV). We found the mean VOT of AM peak (12 AU$/hr) is significantly lower than any other time periods of the day (27.7 AU$/hr). At a disaggregate level, e.g. PAV, SAV and CAR, mean VOT is significantly lower (41%, 66% and 53% for PAV, SAV and CAR accordingly) in the AM peak compared to the other time period. We also found that between PAV and SAV, mean VOT is not different in AM peak but mean VOT will be significantly different for other time period. For other time period, mean VOT for PAV will be 46% lower than SAV through a t-test (t = −2.250, p = .034).
3.2.8. Trip distance
Empirical studies have previously assumed that VOT in AVs will be valued lower for long-distance trips (Ashkrof et al., Citation2019; Becker & Axhausen, Citation2018). To check this assumption, we divided our dataset into two groups with a reference value of 20 km for trip distance and performed statistical t-tests. We found that the mean VOT for long-distance trips (>20 km, N = 11) is higher (13.6 vs. 12.9 AU$/hr) than short-distance trips (<20 km, N = 94) when considered for both types of AVs (PAV and SAV). But shows that mean VOT is lower in long-distance trips compared to short-distance trips for conventional car (15.8 AU$/hr vs 17.3 AU$/hr) and PAV (9.4 AU$/hr vs 11.9 AU$/hr) but higher for SAV (15.9 AU$/hr vs 12 AU$/hr). We found these differences are not statistically significant through an independent sample t-test (t = 1.072, p = .165 for PAV and t = −1.469, p = .112 for SAV). In contrast, shows that for short-distance trips, mean VOT will be significantly 31% lower for both PAV (11.9 AU$/hr) and SAV (12.0 AU$/hr) compared to conventional car (17.3 AU$/hr). But for long-distance trips, mean VOT will be lower in PAV (9.4 AU$/hr) by a significant 41% when compared to both conventional car (15.8 AU$/hr) and SAV (15.9 AU$/hr).
3.2.9. Trip duration
Empirical studies assume that AV VOT will be lower for long duration trips. If journey duration is long enough then travellers will find time to engage in worthwhile activities which will lower their VOT (Milakis et al., Citation2017; Singleton, Citation2019; Steck et al., Citation2018). In this regard we divided our dataset into two groups: short trips (duration is less than 30 min) and long trips (trip duration is more than 30 min). Our analysis in shows that mean VOT is perceived to be higher for long trips in conventional car (23.8 AU$/hr vs 13.3 AU$/hr), PAV (14.7 AU$/hr vs 10.8 AU$/hr) and SAV (23.4 AU$/hr vs 18.5 AU$/hr). Although perceived mean VOT in a conventional car is 44% lower in short trips, the difference of mean VOT between short and long trips are not statistically different according to t-tests. We also found that for short trips, perceived mean VOT in PAV will be 42% lower than SAV and 19% lower than conventional car while it will be 29% higher in SAV compared to CAR. For long trips, there is no statistical significant difference of mean VOT between PAV, SAV and CAR.
3.2.10. Gender
Some studies suggest females do not perceive the benefits of AV travel in the same way as males (Hohenberger et al., Citation2016). We checked this hypothesis between male (N = 24) and female (N = 24) from the VOT estimates of empirical studies. Our result shows that the mean VOT of males (11.7 AU$/hr) is not statistically different (t = .752, p = .456) from the females (11.2 AU$/hr) when considering PAV and SAV altogether. Considered separately for PAV and SAV, still there is no significant difference of the perceived mean VOT between both males and females. We also found that while females perceive the mean VOT of PAV and SAV at the same way, there is a significant difference among males in this case. The mean VOT of SAV is perceived to be 28% lower in SAV (9.8 AU$/hr) compared to PAV (13.6 AU$/hr) by males.
3.2.11. Age
Malokin et al. (Citation2021) studied travel behaviour of millennials and reported that they perceive their in-vehicle journey time differently than older adults and thus their VOT is strongly influenced by the on-board activities. Hohenberger et al. (Citation2016) found that promoting the pleasurable benefits of AV have significant impact on the perceived benefits by young adults. We assume that respondents under the age of 18 years will not be as reliable or rationale in providing responses compared to adults. We found 8 data points with respondents less than 18 years and 98 data points with mixed age groups but all above 18 years. The mean VOT of the age group of below 18 years, is significantly higher (48.1 AU$/hr) compared to the mixed age groups (15.5 AU$/hr). We also tested whether younger adults perceive the benefits of AV differently from mature-aged respondents. For this purpose, we compared the estimated VOT between two-sample groups: between 18 and 30 years (young adults, N = 16) versus more than 50 years of age (seniors, N = 16). Considering PAV and SAV together, we found that the mean VOT of young adults (9.9 AU$/hr) is significantly lower than seniors (12.3 AU$/hr) through a two-sample t-test (t = −2.679, p = .012). This also indicates that seniors will be the early adopters of AV and will be willing to pay more to avail the benefits of AVs. A similar finding was reported by de Winter and Nordhoff (Citation2022) where AV acceptance increases with respondents’ age. We also tested this for individual AV types and found that perceived mean VOT is significantly lower among young adults compared to seniors for both PAV (10.9 AU$/hr vs 13.3 AU$/hr) and SAV (9.0 AU$/hr vs 11.2 AU$/hr). We performed t-tests among the perceived mean VOT of PAV and SAV for young adults, middle aged (30–50 years) and seniors (). We found that there is no significant difference in perceived mean VOT between PAV and SAV among young adults. But both middle aged and seniors perceive 16% lower mean VOT in SAV than PAV at 0.1 level (t = 1.747, p = .108 for middle aged and t = 1.780, p = .102 for seniors).
3.2.12. Education
Empirical research has previously suggested that highly educated people in the society value their journey time more than others (Haboucha et al., Citation2017; Rashidi et al., Citation2020). We are interested to check this hypothesis for AVs (PAV and SAV) and thus divided our data points into two categories: with a university degree (N = 24) and below university degree (N = 24). We found that the mean AV VOT of respondents with at least a university degree is significantly higher (13.2 AU$/hr) than respondents below a university degree (9.7 AU$/hr). The scenario is the same if considered PAV and SAV separately. shows that respondents with at least a university degree perceive higher mean VOT compared to those who do not for both PAV (14.6 AU$/hr vs 10.3 AU$/hr) and SAV (11.7 AU$/hr vs 9.1 AU$/hr). The perceived mean VOT is significantly 29% lower for non-university degree holders for PAV while the amount is 22% for SAV. Interestingly from we found that both university degree holder and non-holder perceive the mean VOT to be significantly lower in SAV than PAV. The mean VOT for non-university degree holders is 9.1 AU$/hr in SAV compared to 10.3 AU$/hr in PAV. Similarly, mean VOT for university degree holders in SAV is 11.7 AU$/hr compared to 14.6 AU$/hr in PAV.
3.2.13. Income
Wadud (Citation2017) and Wadud and Mattioli (Citation2021) have found that high-income households will be the early adopters of AVs as they value their journey time more than low- or middle-income groups. We investigated this hypothesis from our data set. We divided our data points into three categories: low, middle and high-income. Among these three categories, the perceived mean VOT is found to be higher for high-income group for PAV, SAV and CAR. Statistical t-test result from shows that high-income groups will have a significant 60%, 42% and 54% higher mean VOT compared to low income groups for PAV, SAV and CAR accordingly.
3.2.14. Driving license
In a recent study, Corvec and Laroche (Citation2021) suggests that current car users are more interested in AV usage as they perceive their journey time to be useful in an AV. We assume that respondents with a driving license will have a better understanding of the (dis) utility of driving themselves. Thus, we hypothesise that the estimated AV VOT from studies where all respondents have a driving license will be significantly different from other studies having a mixed class of respondents e.g. not all the respondents have a driving license. shows that studies where all the respondents possess a driving license have lower mean VOT for PAV (11.7 AU$/hr vs 14.0 AU$/hr), SAV (12.7 AU$/hr vs 34.4 AU$/hr) and even in a conventional car (14.6 AU$/hr vs 26.3 AU$/hr). But statistical t-test result from show that for SAV and CAR, the difference in perceived mean VOT is significantly lower (44% lower, t = 2.940, p = .005 for CAR and 63% lower, t = 5.453, p < .001 for SAV) for having a driving license. In contrast, for PAV, those having a driving license have no significant difference in mean VOT. Results also shows that among non-driving license holders, perceived mean VOT will be 59% lower for PAV users compared to SAV users with a two-sample t-test (t = −2.932, p = .007).
4. Discussion
We reviewed 24 existing research papers related to VOT estimates of AV travel and synthesised the impacts of different variables on the VOT estimates. Our study reveals that in several factors, private AV would yield greater benefits to consumers compared to conventional travel modes. We also studied several factors and identified twelve to have significant impacts on AV VOT estimates through a meta-analysis. presents all the variables that are found to affect AV VOT estimates. Our study reveals that for both private and shared AV, mean VOT is significantly higher in the USA (18.8 AU$/hr for PAV and 28.6 AU$/hr for SAV) and lower in Germany (12.2 AU$/hr for PAV and 10.8 AU$/hr for SAV) and the Netherlands (11.0 AU$/hr for PAV). In terms of SAV, the mean VOT of the seven EU countries is significantly higher than any other countries with a wide variation of VOT (standard deviation is 28.50 AU$/hr) among them. A detailed review of the VOT of these seven EU countries reveals that the wide variations of VOT between these countries could be related to cultural differences, sample size variation or variation in economic wealth (Etzioni et al., Citation2020). Our study indicates that rural residents favour AV travel more than urban residents because their perceived travel time is cheaper than urbanites. As a result, people from rural areas are likely to make longer distance trips to access goods and services located in urban areas. Especially, in terms of PAV, we found that there is no significant difference of mean VOT between rural residents and urban dwellers. This would likely also influence city dwellers to choose rural neighbourhoods as a place to live (Duarte & Ratti, Citation2018) resulting in traffic congestion and air pollution in new areas (Nadafianshahamabadi et al., Citation2021).
Table 4. Factors influencing the VOT estimates for AV travel.
In measuring VOT in surveys, respondents can perceive the benefits of AV travel when demonstrated through an animated video or mentioning them as chauffeur-driven. It may well be that AVs when demonstrated through an animation video present a more positive impression of riding in an AV and thus the VOT values are estimated to be less compared to those demonstrated as “written as AV” (Janatabadi & Ermagun, Citation2022). Similarly, when respondents were demonstrated to ride with a chauffeur, they probably perceived the in-vehicle time to undertake other productive activities positively rather than “watching the roadway” in a fully autonomous car (a predominant activity by most of the AV users found by Wadud and Huda (Citation2019) and Corvec and Laroche (Citation2021) when mentioned riding in a self-driving vehicle). A similar lower VOT was estimated by Harb et al. (Citation2022) from revealed preference data of chauffeur-driven car users which some researchers have reasoned as the better way to demonstrate AVs to travellers to engage in other productive in-vehicle activities. We also found that perceived AV VOT is lower when demonstrated by chauffeur-driven car compared to those studies where AVs were demonstrated by animation video. This suggests that respondents are still cautious about AV technology (Enam et al., Citation2022; Fagnant & Kockelman, Citation2015) compared to chauffeur-driven car and also implies that there is a need for more sophisticated visualisation techniques in stated choice experiment to portray the AV travel more realistically in order to estimate the true value of travel time. Our results also show that respondents perceive the benefits of private AV and shared AV in much the same way when demonstrated through animation video but differently when demonstrated through writing as AV. This also indicates that proper and realistic visualisation may reveal greater benefits for shared AV mobility which will in return may reduce car ownership in long-term.
Our research found that studies with higher sample sizes reported a higher level of VOTs. This finding is true for PAV, SAV and conventional car. We don’t understand why a large sample size will end up with a large VOT estimate. We speculate that this could be because studies that used a lower sample size did not follow a random sampling technique or representative sample. Another reason behind this could be studies that used a higher sample size have estimated VOTs by controlling various exogenous factors which may resulted in higher VOTs. However, if we accept the conventional wisdom that higher sample sizes are more likely to represent/reality better, future studies should aim to have larger sample sizes to more robustly estimate AV VOT.
In terms of trip type, our study reveals that respondents would have reduced VOT in commute trips especially in shared AVs much as they do in the conventional car when compared to non-commute trips. In contrast, respondents would perceive their travel time similarly for commute and non-commute trips in private AVs. However, in both commute and non-commute trips, respondents perceive greater benefits in private AVs compared to conventional car and shared AVs which is demonstrated by their lower VOT values. This finding is important for AV future planning. While some researchers argue that travel time in an AV will not be productive at all (Krueger et al., Citation2019; Rashidi et al., Citation2020), our results show that travellers presume their commute time in an AV will be positively valued. But such benefits are highly dependent on the types of AV (e.g. private or shared or pooled). In most cases, travellers who choose private AV over shared AVs can be engaged in worthwhile in-vehicle activities (Harb et al., Citation2021; Kolarova et al., Citation2018). Our study also justifies this belief that both commuters and non-commuters can experience the benefit of their freed time in a private AV which will enable them to engage in worthwhile activities (e.g. working, emailing, video conferencing). Although widespread AV commuting may result in traffic congestion, but congestion will be viewed as less of a burden because they can use the in-vehicle time for productive outcomes (Kolarova et al., Citation2019; Moore et al., Citation2020; Zhang et al., Citation2020).
Certain times of the day (AM peak) are viewed to have a positive impact on AV VOT much as conventional cars demonstrated by their lower VOT values. A lower VOT during the AM peak hour is expected given that people have limited time to organise multiple tasks in the morning (preparing and taking breakfast, making kids ready for the school, driving) and AV would allow some of these tasks to be completed while travelling (Wadud & Huda, Citation2018). Besides, certain household characteristic such as having children in the family means parents must drive their children to school or day-care centres at morning peak hours which can act to constrain time availability for other activities. But a fully autonomous vehicle could relieve them from the driving task which in turn can be utilised for other productive activities such as having breakfast, and organising office tasks inside the AV and thus travel time can be valued positively (Zhong et al., Citation2020).
Our study found that in short trips (e.g. less than 20 km), both PAV and SAV would provide greater benefits than a conventional car but in long trips, PAV would be the best option to avail greater benefits. This is similar to the findings of the variable “geographical location” where we found that people would be willing to move to rural locations to enjoy greater tranquillity, spacious and noise-free environment compared to the hustle and bustle of the urban life. Other factors such as, exclusion of “non-trader” from survey sample and current driving experience have a positive impact on AV VOT demonstrated by their lower VOT values. Individuals with a current drivers’ license exhibited a lower AV VOT. We speculate from this result that as driving itself is a stressful task, people who currently drive themselves perceive more benefits in travelling in AVs compared to those who currently do not drive. Young adults (18–30 years of age) perceive the benefits of AV travel due to their willingness to engage in multitasking while travelling. Highly educated and high-income groups value their time more than others for which their perceived VOT in AV travel is also estimated to be high. This also indicates that these groups of people will be the early adopters of AV as they have proven for electric vehicles (Hidrue et al., Citation2011; Trommer et al., Citation2015).
5. Conclusion
The aim of this review paper is to synthesise existing research related to the VOT estimates of AV travel. In this quest, we first compared the VOT estimates between AVs and CVs to understand their probable impacts and then examined several variables to identify their probable impacts on AV VOT. Our analysis indicates that travellers perceive greater benefits in private AVs. This finding robustly verifies the widely held belief that a relief from driving tasks would allow travellers to engage in multitasking activities and consequently travel time would be viewed as a less of a burden. This finding has some potential implications for urban/transport policy and research:
first, there is a possibility that traditionally held belief of constant travel time budget of around one hour will no longer be a norm (Fishman & Davies, Citation2016; Milakis et al., Citation2017; Mokhtarian & Salomon, Citation2001). People tend to save travel time to enable participation in more productive activities. AVs will enable people to travel more without trading-off time for other activities (e.g. sending emails, meeting online, watching movies) resulting in traffic congestion. Our analysis indirectly indicates that people will be willing to engage more in multitasking or other worthwhile activities in an AV resulting in excess travel. These factors will likely weaken the fundamentals driving the travel time budget theory. Future research should explore these effects further together with other theories such as the alternative travel time theory (Milakis et al., Citation2015);
second, accessibility planning approach, particularly the provision of opportunities locally, might need a rethink (Eppenberger & Richter, Citation2021; Milakis et al., Citation2018). Accessibility refers to the ease/ability of people to reach destinations; and it depends on both the availability of destinations and transport services. With AVs, the ability of people (drivers/non-drivers) to access goods and services increases, and as a result, they would be able to travel further than what would be expected with a CV. Besides, any groups in a society (including those with driving difficulties) would be able to capitalise on the benefits of AV to participate in opportunities located near or far. This helps us to posit that facility planning (land use component of accessibility) within a certain threshold distance (e.g. 15-min) can be relaxed. When people travel further with AVs to access certain goods, naturally, this will affect the traditionally used distance decay parameters in transport models. Research has already raised concern that the traditionally used distance decay parameters will need to be redefined (Martínez & Viegas, Citation2013);
third, the ability to travel longer and further means that people may move away from the hustle and bustle of city life to find tranquillity near rural or peri-urban areas resulting in urban sprawl (Moore et al., Citation2020);
fourth, additional benefit items need to be added in the cost–benefit analysis (CBA) to justify the financial viability of transport infrastructure decision. Traditionally, VOT is used as a major benefit component in the CBA for transport infrastructure planning (Eliasson et al., Citation2015; Mackie et al., Citation2003). Given that AVs put a lower value for travel time, new infrastructure would incur a low benefit from travel time savings. As a result, new infrastructure investment decision would suffer from meeting the financial feasibility; and
fifth, future research on AV VOT estimates can be improved by considering the factors identified to have a significant effect in this study. These factors can be treated as exogenous or endogenous variables in econometric model for estimating the effects of AVs on VOT. A robust estimate of AV VOT is critical for policymakers to correctly identify/predict the perceived benefits of AVs and consequently devising effective AV policy. AV car manufacturers can also benefit from better VOT estimates since this will improve their understanding of design criteria for vehicle and service design to provide maximum benefits to their future customers.
Ownership cost of private AVs is also important when considering perceived benefits of AVs, but in the long-term, owning a private AV could be the most cost-effective option (Szimba & Hartmann, Citation2020; Wadud & Mattioli, Citation2021; Zhang et al., Citation2020).
To the best of our knowledge, this paper is the first attempt to synthesise the existing literature on VOT estimates of AV travel and identifies, through meta-analysis, the key factors with significant impact on the VOT estimates. Although our study sheds light on identifying the key variables and their impacts on VOT estimates, the correlations between these key variables are not considered in this study. Future research can focus on conducting a meta-regression to identify the true effect of each of the factors by controlling for other factors. We identified two variables (gender type and trip duration) with no significant impact on VOT estimates. This could be due to the limited sample sizes used in this study. Further research should seek to validate these findings when the field is more matured. There might be several other factors e.g. experimental method (discrete choice experiments vs simulation) and multitasking effect which could also have a significant impact on the perceived benefits for AV travel which our study (and other researchers) have yet to consider. We believe further research can shed light into these issues.
Disclosure statement
No potential conflict of interest was reported by the author(s).
Additional information
Funding
References
- Ashkrof, P., Homem De Almeida Correia, G., Cats, O., & Van Arem, B. (2019). Impact of automated vehicles on travel mode preference for different trip purposes and distances. Transportation Research Record: Journal of the Transportation Research Board, 2673(5), 607–616. https://doi.org/10.1177/0361198119841032
- Becker, F., & Axhausen, K. W. (2018). Predicting the use of automated vehicles for Zurich, Switzerland. (Ed.). 15th international Conference on Travel Behavior Research (IATBR 2018).
- Beesley, M. E. (1965). The value of time spent in travelling: Some new evidence. Economica, 32(126), 174–185. https://doi.org/10.2307/2552547
- Choi, S., Kim, D., Ko, J., Park, J., & Ko, Y. (2022). Value of travel time savings of autonomous vehicle commuters: A segmented valuation for local and inter-city travel. https://doi.org/10.2139/ssrn.4106430
- Correia, G. H. D., Looff, E., van Cranenburgh, S., Snelder, M., & van Arem, B. (2019). On the impact of vehicle automation on the value of travel time while performing work and leisure activities in a car: Theoretical insights and results from a stated preference survey. Transportation Research PART A-Policy and Practice, 119, 359–382. https://doi.org/10.1016/j.tra.2018.11.016
- Corvec, S.-L., & Laroche, F. (2021). Autonomous vehicles: Attitudes, activities, and feelings. Activities, and Feelings. https://dx.doi.org/10.2139/ssrn.4029688.
- Currie, G. (2018). Lies, damned lies, AVs, shared mobility, and urban transit futures. Journal of Public Transportation, 21(1), 3. https://doi.org/10.5038/2375-0901.21.1.3
- de Winter, J. C. F., & Nordhoff, S. (2022). Acceptance of conditionally automated cars: Just one factor? Transportation Research Interdisciplinary Perspectives, 15, 100645. https://doi.org/10.1016/j.trip.2022.100645
- Duarte, F., & Ratti, C. (2018). The impact of autonomous vehicles on cities: A review. Journal of Urban Technology, 25(4), 3–18. https://doi.org/10.1080/10630732.2018.1493883
- Eftec. (2009). Valuing environmental impacts: Practical guidelines for the use of value transfer in policy and project appraisal.
- Egger, M., & Smith, G. D. (1997). Meta-analysis: Potentials and promise. Bmj, 315(7119), 1371–1374. https://doi.org/10.1136/bmj.315.7119.1371
- Eliasson, J., Börjesson, M., Odeck, J., & Welde, M. (2015). Does benefit–cost efficiency influence transport investment decisions? Journal of Transport Economics and Policy (JTEP), 49(3), 377–396. https://www.jstor.org/stable/jtranseconpoli.49.3.037
- Enam, A., Ardeshiri, A., Rashidi, T. H., & Auld, J. (2022). Do automated vehicle (AV) enthusiasts value travel time differently from cautious travelers? An exploration of travelers’ attitudes towards AV. Transportation Planning and Technology, 45(1), 19–38. https://doi.org/10.1080/03081060.2021.2017208
- Eppenberger, N., & Richter, M. A. (2021). The opportunity of shared autonomous vehicles to improve spatial equity in accessibility and socio-economic developments in European urban areas. European Transport Research Review, 13(1), 32. https://doi.org/10.1186/s12544-021-00484-4
- Etzioni, S., Daziano, R. A., Ben-Elia, E., & Shiftan, Y. (2021). Preferences for shared automated vehicles: A hybrid latent class modeling approach. Transportation Research Part C: Emerging Technologies, 125, 103013. https://doi.org/10.1016/j.trc.2021.103013
- Etzioni, S., Hamadneh, J., Elvarsson, A. B., Esztergar-Kiss, D., Djukanovic, M., Neophytou, S. N., Sodnik, J., Polydoropoulou, A., Tsouros, I., Pronello, C., Thomopoulos, N., & Shiftan, Y. (2020). Modeling cross-national differences in automated vehicle acceptance. Sustainability (Switzerland), 12(22), https://doi.org/10.3390/su12229765
- Fagnant, D. J., & Kockelman, K. (2015). Preparing a nation for autonomous vehicles: Opportunities, barriers and policy recommendations. Transportation Research. Part A, Policy and Practice, 77, 167–181. https://doi.org/10.1016/j.tra.2015.04.003
- Fink, A. (1998). Conducting research literature reviews: From paper to the Internet. Sage Publications.
- Fishman, E., & Davies, L. (2016). Road user pricing: Driverless cars, congestion and policy responses. (Ed.). Proceedings of the Australasian Transport Research Forum. Melbourne.
- Gao, J., Ranjbari, A., & MacKenzie, D. (2019). Would being driven by others affect the value of travel time? Ridehailing as an analogy for automated vehicles [Article]. Transportation, 46(6), 2103–2116. https://doi.org/10.1007/s11116-019-10031-9
- Haboucha, C. J., Ishaq, R., & Shiftan, Y. (2017). User preferences regarding autonomous vehicles. Transportation Research. Part C, Emerging Technologies, 78, 37–49. https://doi.org/10.1016/j.trc.2017.01.010
- Hamadneh, J., & Esztergár-Kiss, D. (2022). The preference of onboard activities in a new age of automated driving. European Transport Research Review, 14(1), 1–22. https://doi.org/10.1186/s12544-022-00540-7
- Harb, M., Stathopoulos, A., Shiftan, Y., & Walker, J. L. (2021). What do we (Not) know about our future with automated vehicles? Transportation Research Part C: Emerging Technologies, 123, 102948. https://doi.org/10.1016/j.trc.2020.102948
- Harb, M., Walker, J. L., Malik, J., & Circella, G. (2022). Estimating short-term travel demand models that incorporate personally owned autonomous vehicles. Travel Behaviour and Society, 26, 279–289. https://doi.org/10.1016/j.tbs.2021.10.008
- Hardman, S. (2021). Investigating the decision to travel more in a partially automated electric vehicle. Transportation Research Part D: Transport and Environment, 96, 102884. https://doi.org/10.1016/j.trd.2021.102884
- Harper, C. D., Hendrickson, C. T., Mangones, S., & Samaras, C. (2016). Estimating potential increases in travel with autonomous vehicles for the non-driving, elderly and people with travel-restrictive medical conditions. Transportation Research. Part C, Emerging Technologies, 72, 1–9. https://doi.org/10.1016/j.trc.2016.09.003
- Hartmans, A. (2016). How Google's self-driving car project rose from a crazy idea to a top contender in the race toward a driverless future. Business Insider. https://www.businessinsider.com/google-driverless-car-history-photos-2016-10
- Hicks, A., Ahn, S., & Kontar, W. (2019). Autonomous vehicle adoption: Assessing operational and environmental impacts. https://trid.trb.org/view/1713389
- Hidrue, M. K., Parsons, G. R., Kempton, W., & Gardner, M. P. (2011). Willingness to pay for electric vehicles and their attributes. Resource and Energy Economics, 33(3), 686–705. https://doi.org/10.1016/j.reseneeco.2011.02.002
- Hohenberger, C., Spörrle, M., & Welpe, I. M. (2016). How and why do men and women differ in their willingness to use automated cars? The influence of emotions across different age groups. Transportation Research. Part A, Policy and Practice, 94, 374–385. https://doi.org/10.1016/j.tra.2016.09.022
- Iskander, J., Attia, M., Saleh, K., Nahavandi, D., Abobakr, A., Mohamed, S., Asadi, H., Khosravi, A., Lim, C. P., & Hossny, M. (2019). From car sickness to autonomous car sickness: A review. Transportation Research. Part F, Traffic Psychology and Behaviour, 62, 716–726. https://doi.org/10.1016/j.trf.2019.02.020
- Janatabadi, F., & Ermagun, A. (2022). Empirical evidence of bias in public acceptance of autonomous vehicles. Transportation Research Part F: Traffic Psychology and Behaviour, 84, 330–347. https://doi.org/10.1016/j.trf.2021.12.005
- Jara-Diaz, S. (2007). Transport economic theory. Elsevier.
- Jing, P., Xu, G., Chen, Y. X., Shi, Y. J., & Zhan, F. P. (2020). The determinants behind the acceptance of autonomous vehicles: A systematic review. Sustainability (Switzerland), 12(5), https://doi.org/10.3390/su12051719
- Kang, S., Mondal, A., Bhat, A. C., & Bhat, C. R. (2021). Pooled versus private ride-hailing: A joint revealed and stated preference analysis recognizing psycho-social factors. Transportation Research. Part C, Emerging Technologies, 124, 102906. https://doi.org/10.1016/j.trc.2020.102906
- Kolarova, V., & Cherchi, E. (2021). Impact of trust and travel experiences on the value of travel time savings for autonomous driving. Transportation Research Part C: Emerging Technologies, 131, Article 103354. https://doi.org/10.1016/j.trc.2021.103354
- Kolarova, V., & Steck, F. (2019). Estimating impact of autonomous driving on value of travel time savings for long-distance trips using revealed and stated preference methods. Mapping the travel behavior genome (pp. 561–575). Elsevier. https://doi.org/10.1016/B978-0-12-817340-4.00028-0
- Kolarova, V., Steck, F., & Bahamonde-Birke, F. J. (2019). Assessing the effect of autonomous driving on value of travel time savings: A comparison between current and future preferences. Transportation Research Part A: Policy and Practice, 129, 155–169. https://doi.org/10.1016/j.tra.2019.08.011
- Kolarova, V., Steck, F., Cyganski, R., & Trommer, S. (2018). Estimation of the value of time for automated driving using revealed and stated preference methods. (Ed.). 45th European Transport Conference.
- Krueger, R., Rashidi, T. H., & Dixit, V. V. (2019). Autonomous driving and residential location preferences: Evidence from a stated choice survey. Transportation Research Part C: Emerging Technologies, 108, 255–268. https://doi.org/10.1016/j.trc.2019.09.018
- Krueger, R., Rashidi, T. H., & Rose, J. M. (2016). Preferences for shared autonomous vehicles. Transportation Research Part C: Emerging Technologies, 69, 343–355. https://doi.org/10.1016/j.trc.2016.06.015
- Lavieri, P. S., & Bhat, C. R. (2019). Modeling individuals’ willingness to share trips with strangers in an autonomous vehicle future. Transportation Research Part A: Policy and Practice, 124, 242–261. https://doi.org/10.1016/j.tra.2019.03.009
- Lyons, G. (2018). Getting smart about urban mobility – aligning the paradigms of smart and sustainable. Transportation Research. Part A, Policy and Practice, 115, 4–14. https://doi.org/10.1016/j.tra.2016.12.001
- Lyons, G., Jain, J., & Holley, D. (2007). The use of travel time by rail passengers in Great Britain. Transportation Research Part A: Policy and Practice, 41(1), 107–120. https://doi.org/10.1016/j.tra.2006.05.012
- Mackie, P., Wardman, M., Fowkes, A., Whelan, G., Nellthorp, J., & Bates, J. (2003). Values of travel time savings in the UK: Report to Department for Transport.
- Malokin, A., Circella, G., & Mokhtarian, P. L. (2019). How do activities conducted while commuting influence mode choice? Using revealed preference models to inform public transportation advantage and autonomous vehicle scenarios. Transportation Research Part A: Policy and Practice, 124, 82–114. https://doi.org/10.1016/j.tra.2018.12.015
- Malokin, A., Circella, G., & Mokhtarian, P. L. (2021). Do millennials value travel time differently because of productive multitasking? A revealed-preference study of Northern California commuters. Transportation, 48(5), 2787–2823. https://doi.org/10.1007/s11116-020-10148-2
- Martínez, L. M., & Viegas, J. M. (2013). A new approach to modelling distance-decay functions for accessibility assessment in transport studies. Journal of Transport Geography, 26, 87–96. https://doi.org/10.1016/j.jtrangeo.2012.08.018
- Metz, D. (2018). Developing policy for urban autonomous vehicles: Impact on congestion. Urban Science, 2(2), 33. https://doi.org/10.3390/urbansci2020033
- Milakis, D. (2019). Long-term implications of automated vehicles: An introduction. Transport Reviews, 39(1), 1–8. https://doi.org/10.1080/01441647.2019.1545286
- Milakis, D., Cervero, R., van Wee, B., & Maat, K. (2015). Do people consider an acceptable travel time? Evidence from Berkeley, CA. Journal of Transport Geography, 44, 76–86. https://doi.org/10.1016/j.jtrangeo.2015.03.008
- Milakis, D., Kroesen, M., & van Wee, B. (2018). Implications of automated vehicles for accessibility and location choices: Evidence from an expert-based experiment. Journal of Transport Geography, 68, 142–148. https://doi.org/10.1016/j.jtrangeo.2018.03.010
- Milakis, D., van Arem, B., & van Wee, B. (2017). Policy and society related implications of automated driving: A review of literature and directions for future research. Journal of Intelligent Transportation Systems, 21(4), 324–348. https://doi.org/10.1080/15472450.2017.1291351
- Moher, D., Liberati, A., Tetzlaff, J., Altman, D. G., & Group, P. (2009). Preferred reporting items for systematic reviews and meta-analyses: The PRISMA statement. Annals of Internal Medicine, 151(4), 264–269. https://doi.org/10.7326/0003-4819-151-4-200908180-00135
- Mokhtarian, P. L., & Salomon, I. (2001). How derived is the demand for travel? Some conceptual and measurement considerations. Transportation Research. Part A, Policy and Practice, 35(8), 695–719. https://doi.org/10.1016/S0965-8564(00)00013-6
- Moore, M. A., Lavieri, P. S., Dias, F. F., & Bhat, C. R. (2020). On investigating the potential effects of private autonomous vehicle use on home/work relocations and commute times. Transportation Research Part C: Emerging Technologies, 110, 166–185. https://doi.org/10.1016/j.trc.2019.11.013
- Nadafianshahamabadi, R., Tayarani, M., & Rowangould, G. (2021). A closer look at urban development under the emergence of autonomous vehicles: Traffic, land use and air quality impacts. Journal of Transport Geography, 94, 103113. https://doi.org/10.1016/j.jtrangeo.2021.103113
- Nordström, M., & Engholm, A. (2021). The complexity of value of travel time for self-driving vehicles–a morphological analysis. Transportation Planning and Technology, 44(4), 400–417. https://doi.org/10.1080/03081060.2021.1919349
- OECD. (2022). Purchasing power parities (PPP). Organisation for Economic Co-operation and Development. Retrieved April 12, 2022 from https://data.oecd.org/conversion/purchasing-power-parities-ppp.htm
- Oort, C. J. (1969). The evaluation of travelling time. Journal of Transport Economics and Policy, 3(3), 279–286. https://www.jstor.org/stable/20052155
- Ortúzar, J. d. D., & Willumsen, L. G. (2011). Modelling transport (4th ed). John Wiley & Sons Ltd. https://doi.org/10.1002/9781119993308
- Page, M. J., McKenzie, J. E., Bossuyt, P. M., Boutron, I., Hoffmann, T. C., Mulrow, C. D., Shamseer, L., Tetzlaff, J. M., Akl, E. A., Brennan, S. E., Chou, R., Glanville, J., Grimshaw, J. M., Hróbjartsson, A., Lalu, M. M., Li, T., Loder, E. W., Mayo-Wilson, E., McDonald, S., … Moher, D. (2021). The PRISMA 2020 statement: An updated guideline for reporting systematic reviews. Bmj, 372, n71. https://doi.org/10.1136/bmj.n71
- Pudāne, B., Rataj, M., Molin, E. J. E., Mouter, N., van Cranenburgh, S., & Chorus, C. G. (2019). How will automated vehicles shape users’ daily activities? Insights from focus groups with commuters in The Netherlands. Transportation Research. Part D, Transport and Environment, 71, 222–235. https://doi.org/10.1016/j.trd.2018.11.014
- Rashidi, T. H., Waller, T., & Axhausen, K. (2020). Reduced value of time for autonomous vehicle users: Myth or reality? Transport Policy, 95, 30–36. https://doi.org/10.1016/j.tranpol.2020.06.003
- SAE, I. (2021). Taxonomy and definitions for terms related to driving automation systems for On-road motor vehicles. SAE Standard J, 3016, 1–41. https://doi.org/10.4271/J3016_202104
- Singleton, P. A. (2019). Discussing the “positive utilities” of autonomous vehicles: Will travellers really use their time productively? Transport Reviews, 39(1), 50–65. https://doi.org/10.1080/01441647.2018.1470584
- Steck, F., Kolarova, V., Bahamonde-Birke, F., Trommer, S., & Lenz, B. (2018). How autonomous driving May affect the value of travel time savings for commuting. Transportation Research Record, 2672(46), 11–20. https://doi.org/10.1177/0361198118757980
- Sun, S., Wong, Y. D., & Rau, A. (2020). Economic assessment of a dynamic autonomous road transit system for Singapore [Article]. Research in Transportation Economics, 83, 100843. https://doi.org/10.1016/j.retrec.2020.100843
- Szimba, E., & Hartmann, M. (2020). Assessing travel time savings and user benefits of automated driving–A case study for a commuting relation. Transport Policy, 98, 229–237. https://doi.org/10.1016/j.tranpol.2020.03.007
- Torres-Montoya, M., & Innao, M. (2019). Willingness to pay in the autonomous vehicle age. (Ed.). International Conference on Sustainable Infrastructure 2019: Leading Resilient Communities through the 21st Century - Proceedings of the International Conference on Sustainable Infrastructure 2019.
- Trommer, S., Jarass, J., & Kolarova, V. (2015). Early adopters of electric vehicles in Germany unveiled. World Electric Vehicle Journal, 7(4), 722–732. https://doi.org/10.3390/wevj7040722
- van den Berg, V. A. C., & Verhoef, E. T. (2016). Autonomous cars and dynamic bottleneck congestion: The effects on capacity, value of time and preference heterogeneity. Transportation Research Part B: Methodological, 94, 43–60. https://doi.org/10.1016/j.trb.2016.08.018
- Wadud, Z. (2017). Fully automated vehicles: A cost of ownership analysis to inform early adoption. Transportation Research Part A: Policy and Practice, 101, 163–176. https://doi.org/10.1016/j.tra.2017.05.005
- Wadud, Z., & Chintakayala, P. K. (2021). To own or not to own – That is the question: The value of owning a (fully automated) vehicle. Transportation Research. Part C, Emerging Technologies, 123, 102978. https://doi.org/10.1016/j.trc.2021.102978
- Wadud, Z., & Huda, F. Y. (2018). The potential use and usefulness of travel time in fully automated vehicles. https://trid.trb.org/view/1494972
- Wadud, Z., & Huda, F. Y. (2019). Fully automated vehicles: The use of travel time and its association with intention to use. Proceedings of the Institution of Civil Engineers. Transport, 1-15. https://doi.org/10.1680/jtran.18.00134.
- Wadud, Z., MacKenzie, D., & Leiby, P. (2016). Help or hindrance? The travel, energy and carbon impacts of highly automated vehicles. Transportation Research. Part A, Policy and Practice, 86(C), 1–18. https://doi.org/10.1016/j.tra.2015.12.001
- Wadud, Z., & Mattioli, G. (2021). Fully automated vehicles: A cost-based analysis of the share of ownership and mobility services, and its socio-economic determinants. Transportation Research Part A: Policy and Practice, 151, 228–244. https://doi.org/10.1016/j.tra.2021.06.024
- Wee, B. V., & Banister, D. (2016). How to write a literature review paper? Transport Reviews, 36(2), 278–288. https://doi.org/10.1080/01441647.2015.1065456
- West, D. M. (2016). Moving forward: Self-driving vehicles in China, Europe, Japan, Korea, and the United States. Brookings Institution Reports.
- Wong, T. W., Saxena, N., & Dixit, V. V. (2018). A study of route choice behavior of drivers in autonomous vehicles. https://trid.trb.org/view/1495416
- Yap, M. D., Correia, G., & van Arem, B. (2016). Preferences of travellers for using automated vehicles as last mile public transport of multimodal train trips. Transportation Research Part A: Policy and Practice, 94, 1–16. https://doi.org/10.1016/j.tra.2016.09.003
- Zhang, F., Liu, W., Lodewijks, G., & Travis Waller, S. (2020). The short-run and long-run equilibria for commuting with autonomous vehicles. Transportmetrica B: Transport Dynamics, 1–28. https://doi.org/10.1080/21680566.2020.1779146
- Zhong, H., Li, W., Burris, M. W., Talebpour, A., & Sinha, K. C. (2020). Will autonomous vehicles change auto commuters’ value of travel time? [Article]. Transportation Research Part D: Transport and Environment, 83, 102303. https://doi.org/10.1016/j.trd.2020.102303
- Zou, X., Logan, D. B., & Vu, H. L. (2022). Modeling public acceptance of private autonomous vehicles: Value of time and motion sickness viewpoints [Article]. Transportation Research Part C: Emerging Technologies, 137, 103548. https://doi.org/10.1016/j.trc.2021.103548
Appendix A
Table A1. Studies along with their major characteristics included in the meta-analysis (ordered by year of publication).